. 2024 May 31;9(95):eadl2171.
doi: 10.1126/sciimmunol.adl2171. Epub 2024 May 31.

The tumor-intrinsic role of the m6A reader YTHDF2 in regulating immune evasion

Affiliations

The tumor-intrinsic role of the m6A reader YTHDF2 in regulating immune evasion

Sai Xiao et al. Sci Immunol. .

Abstract

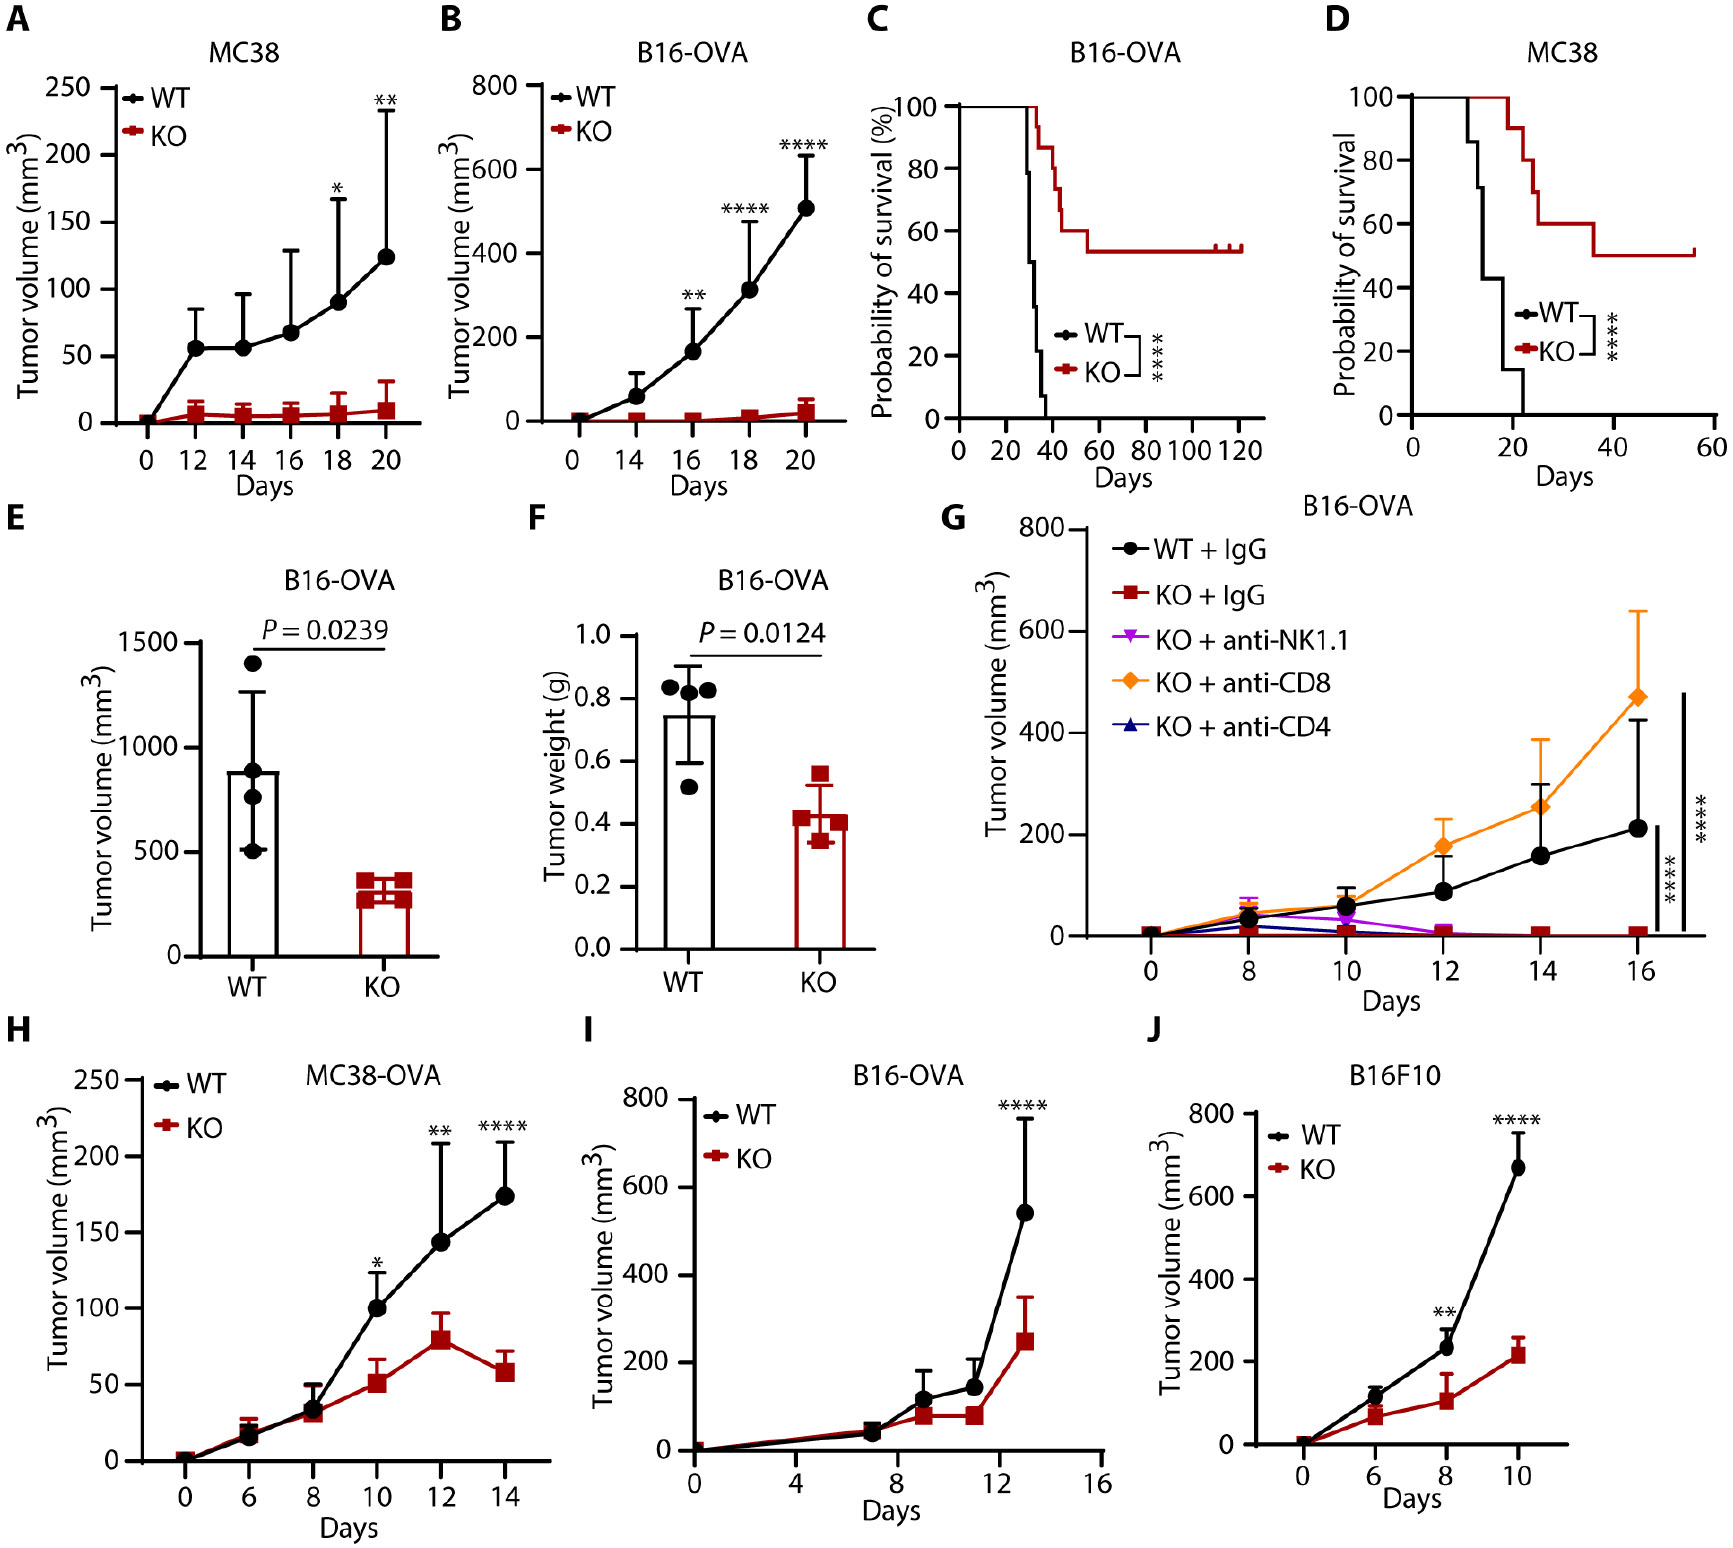
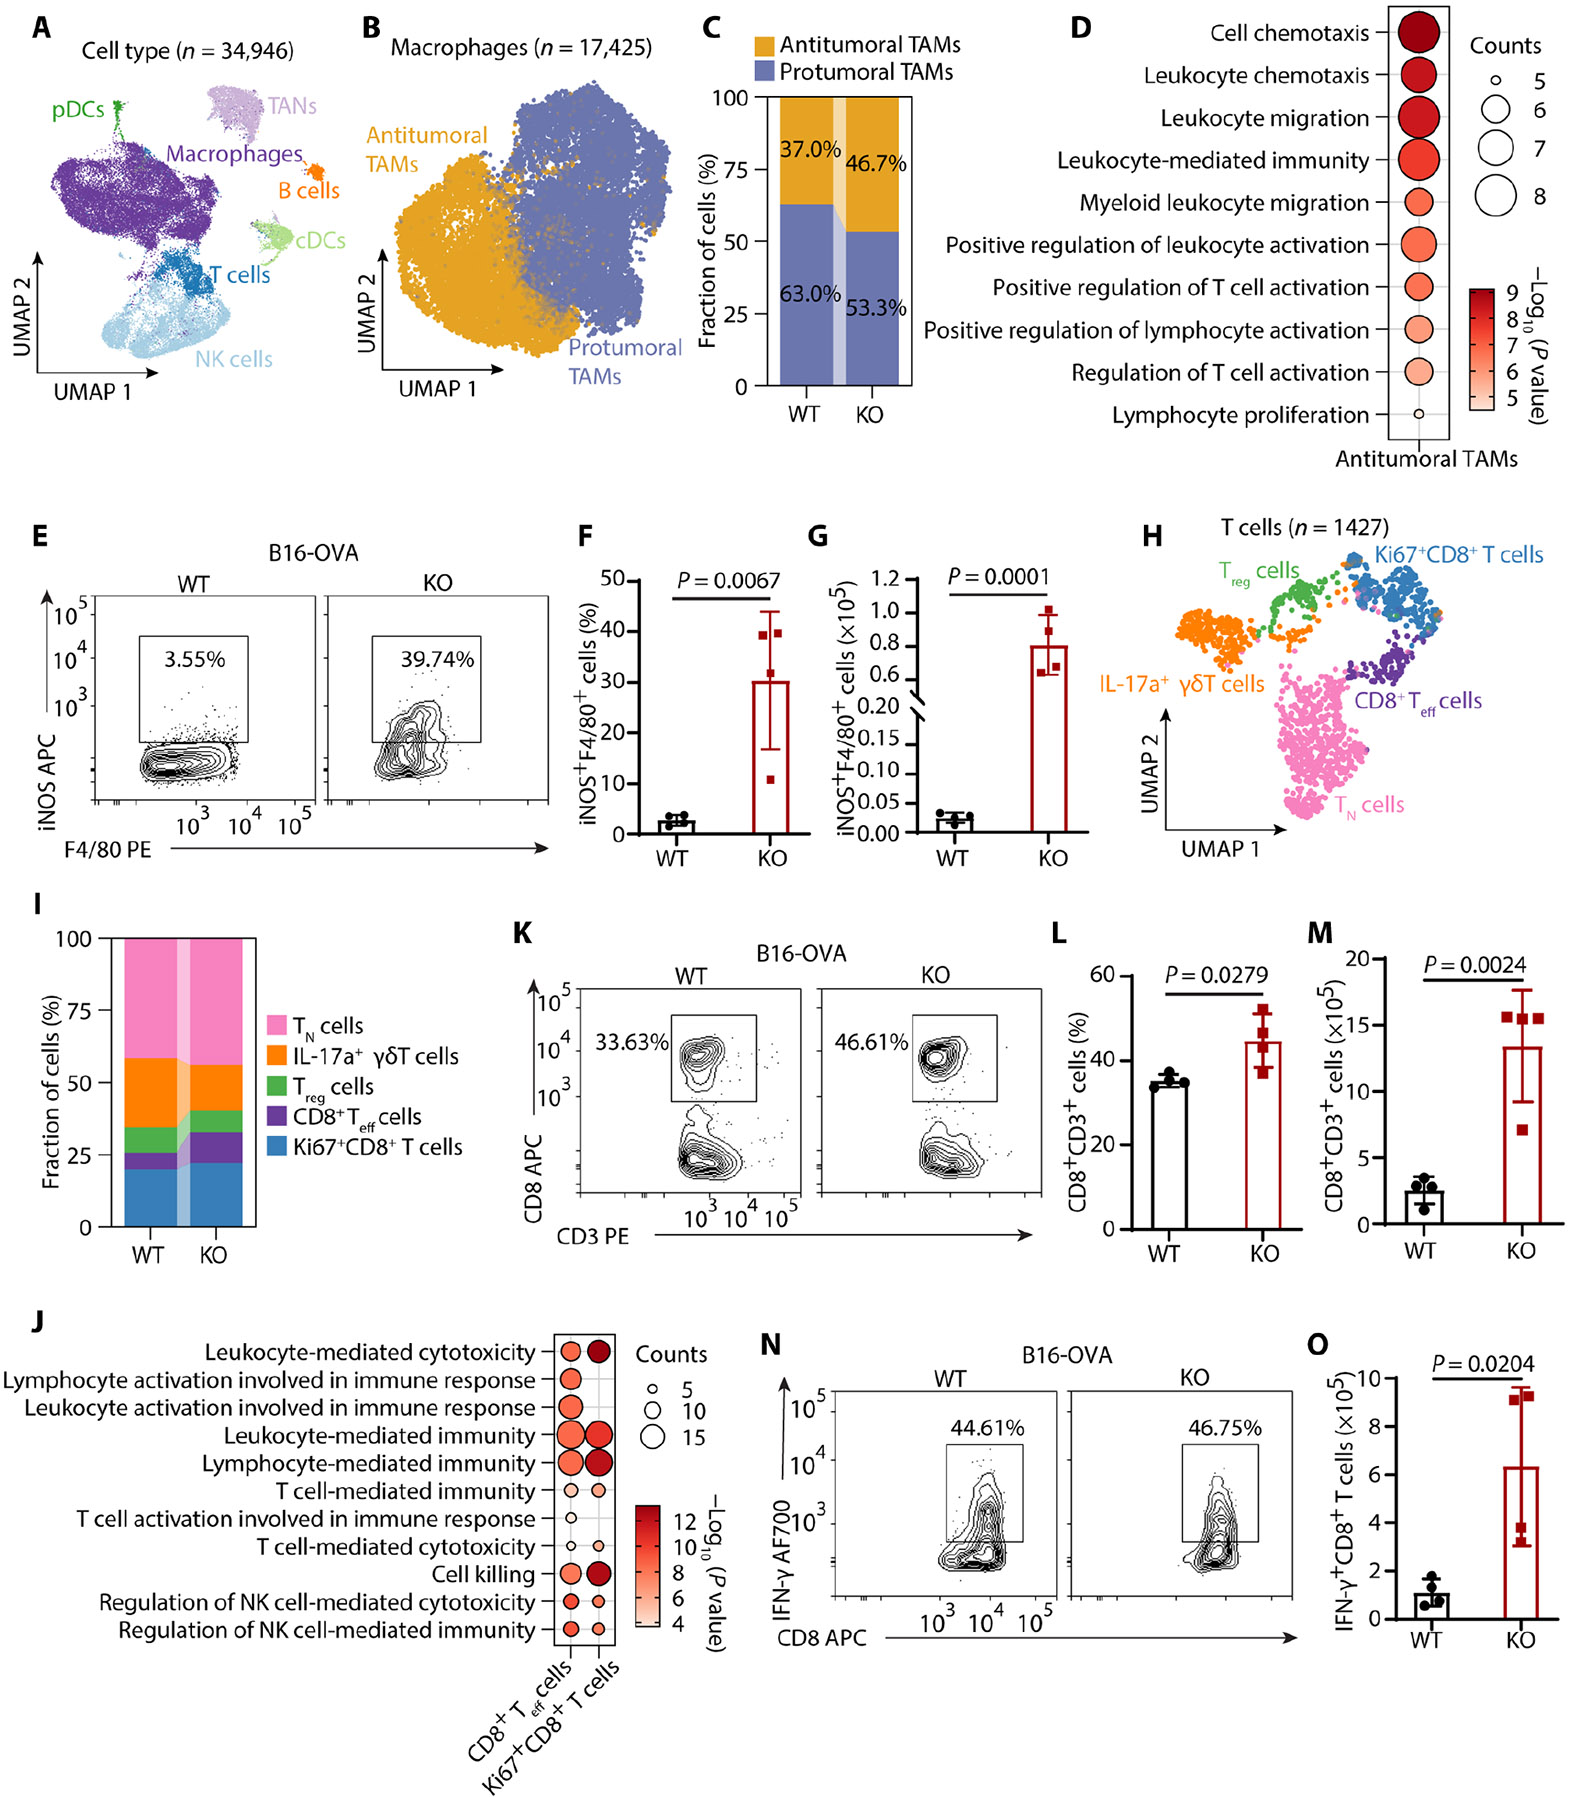
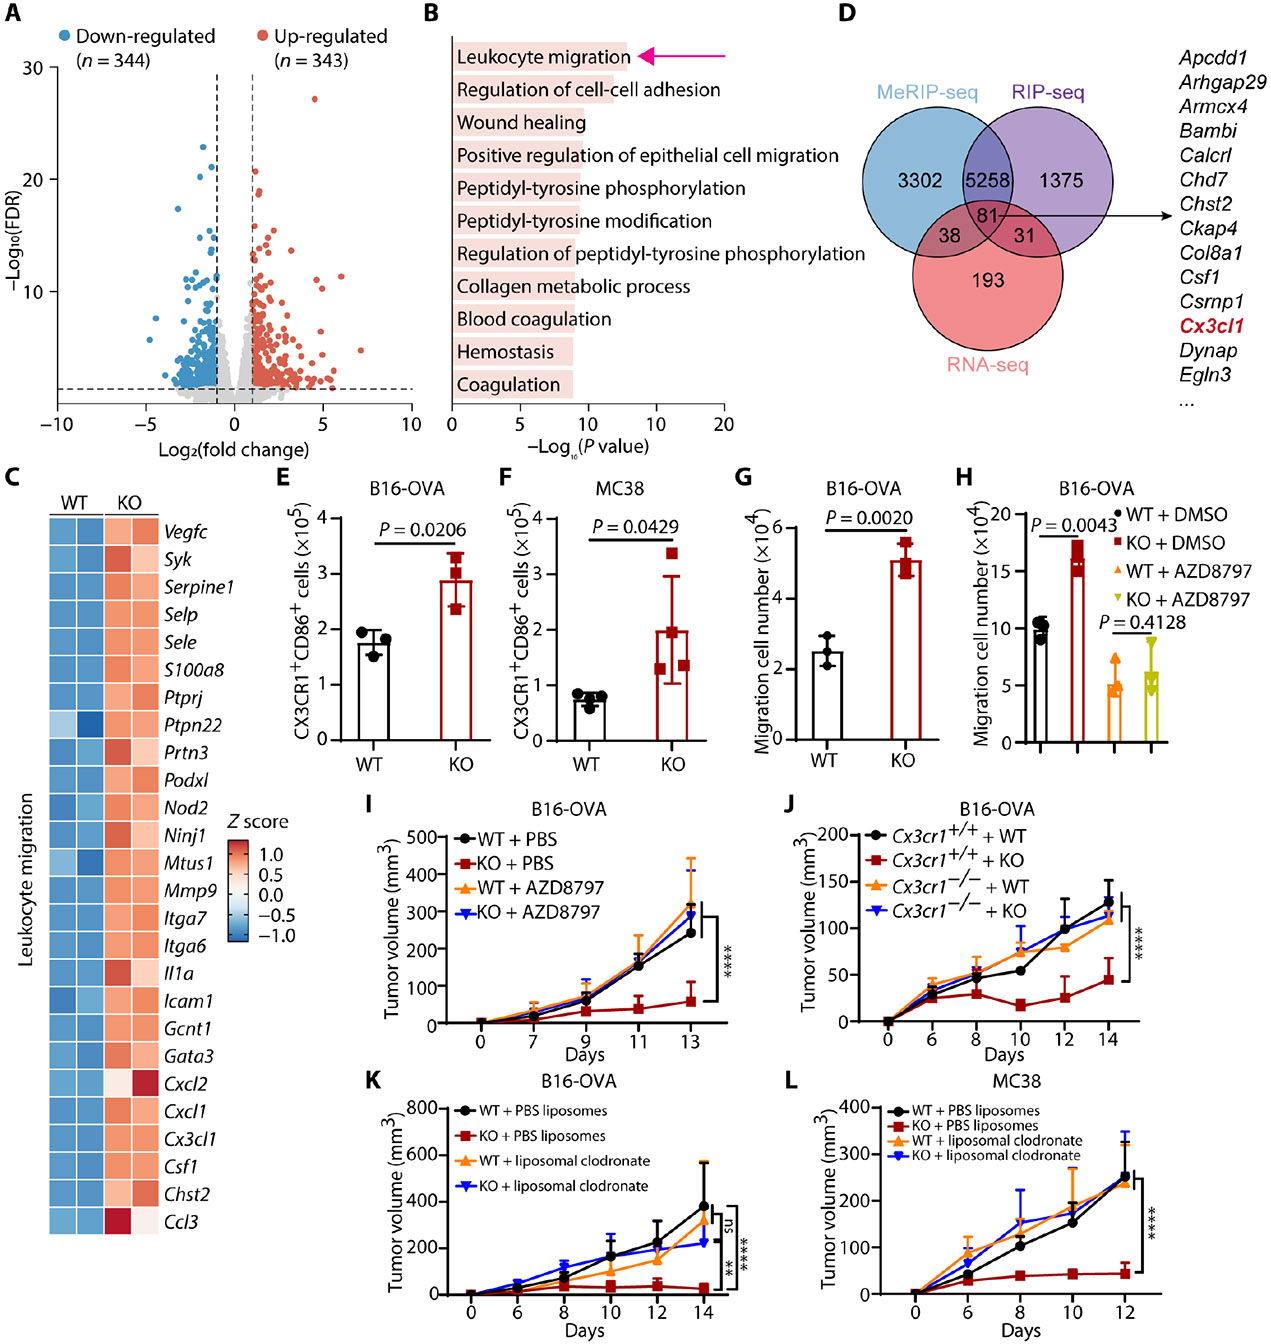
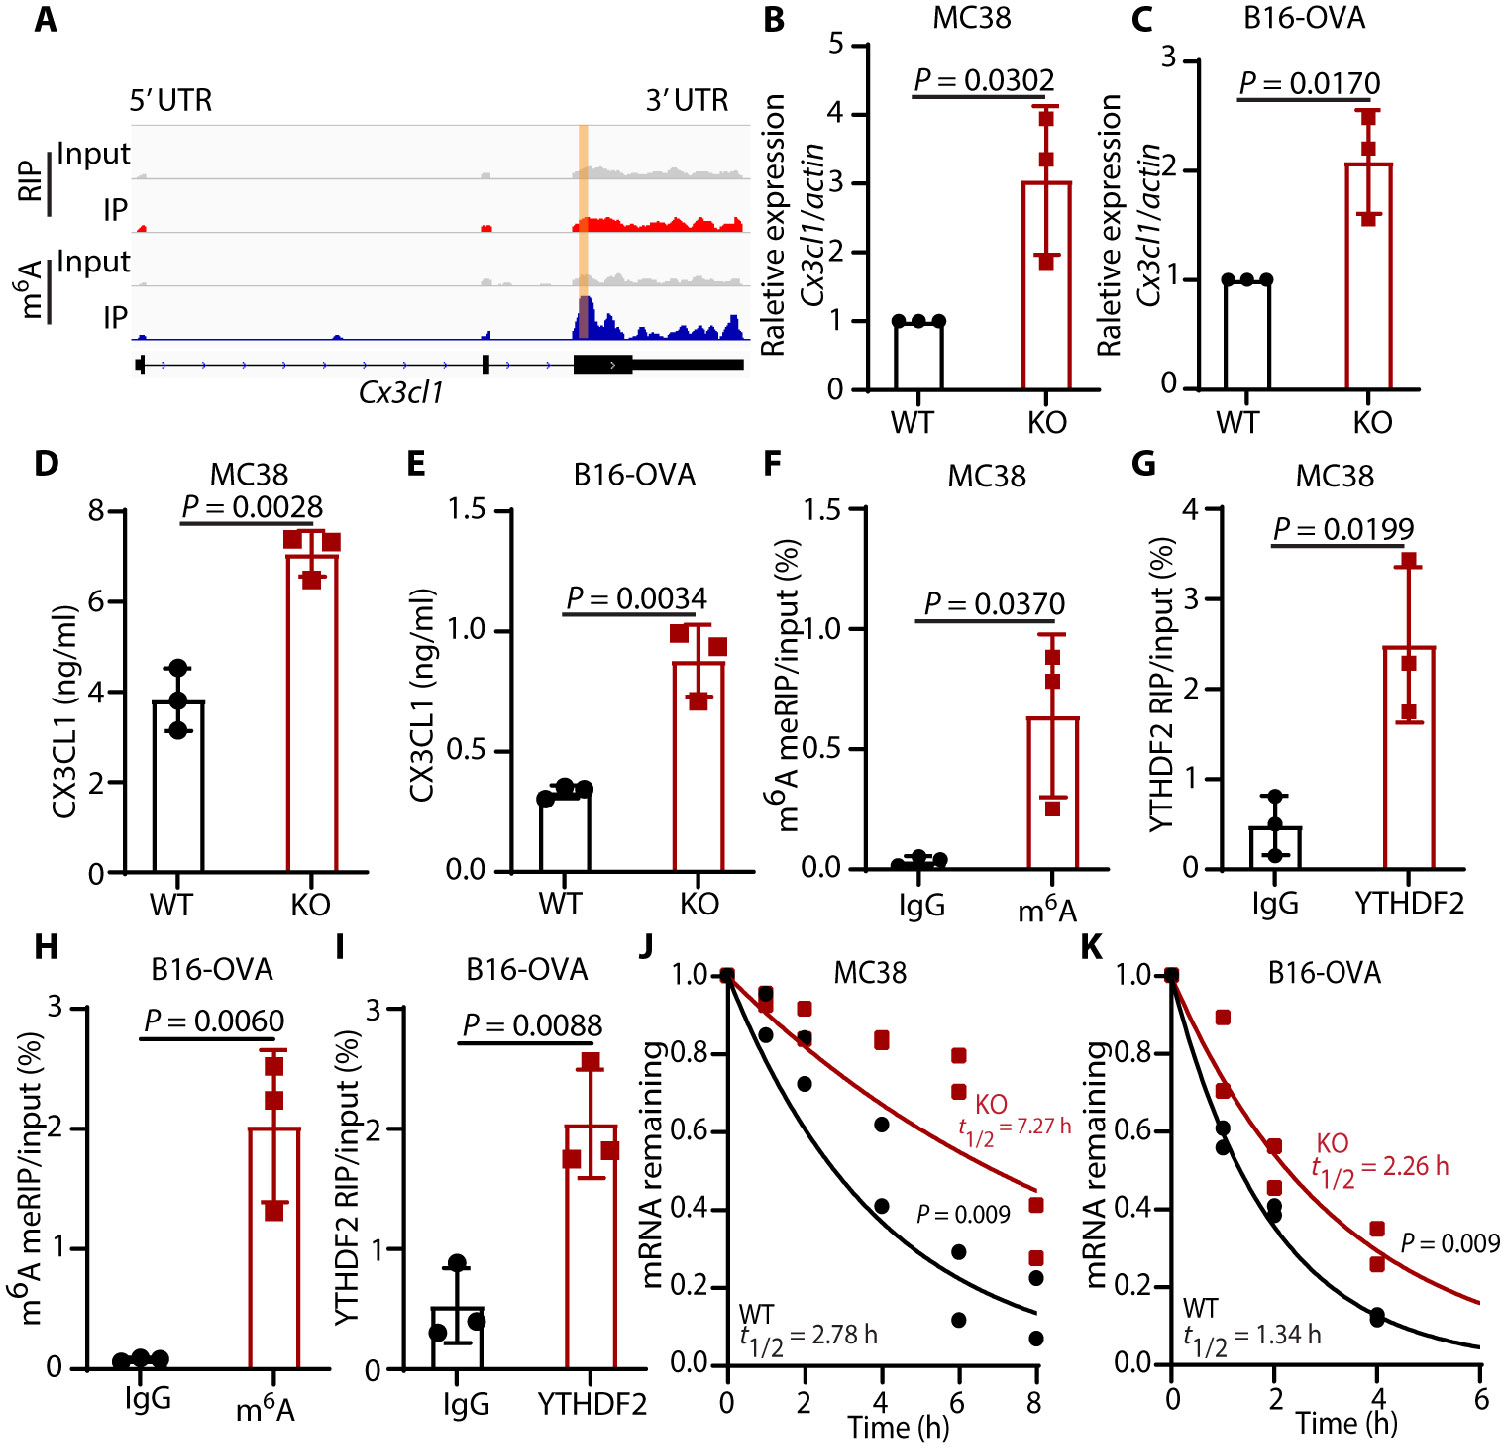
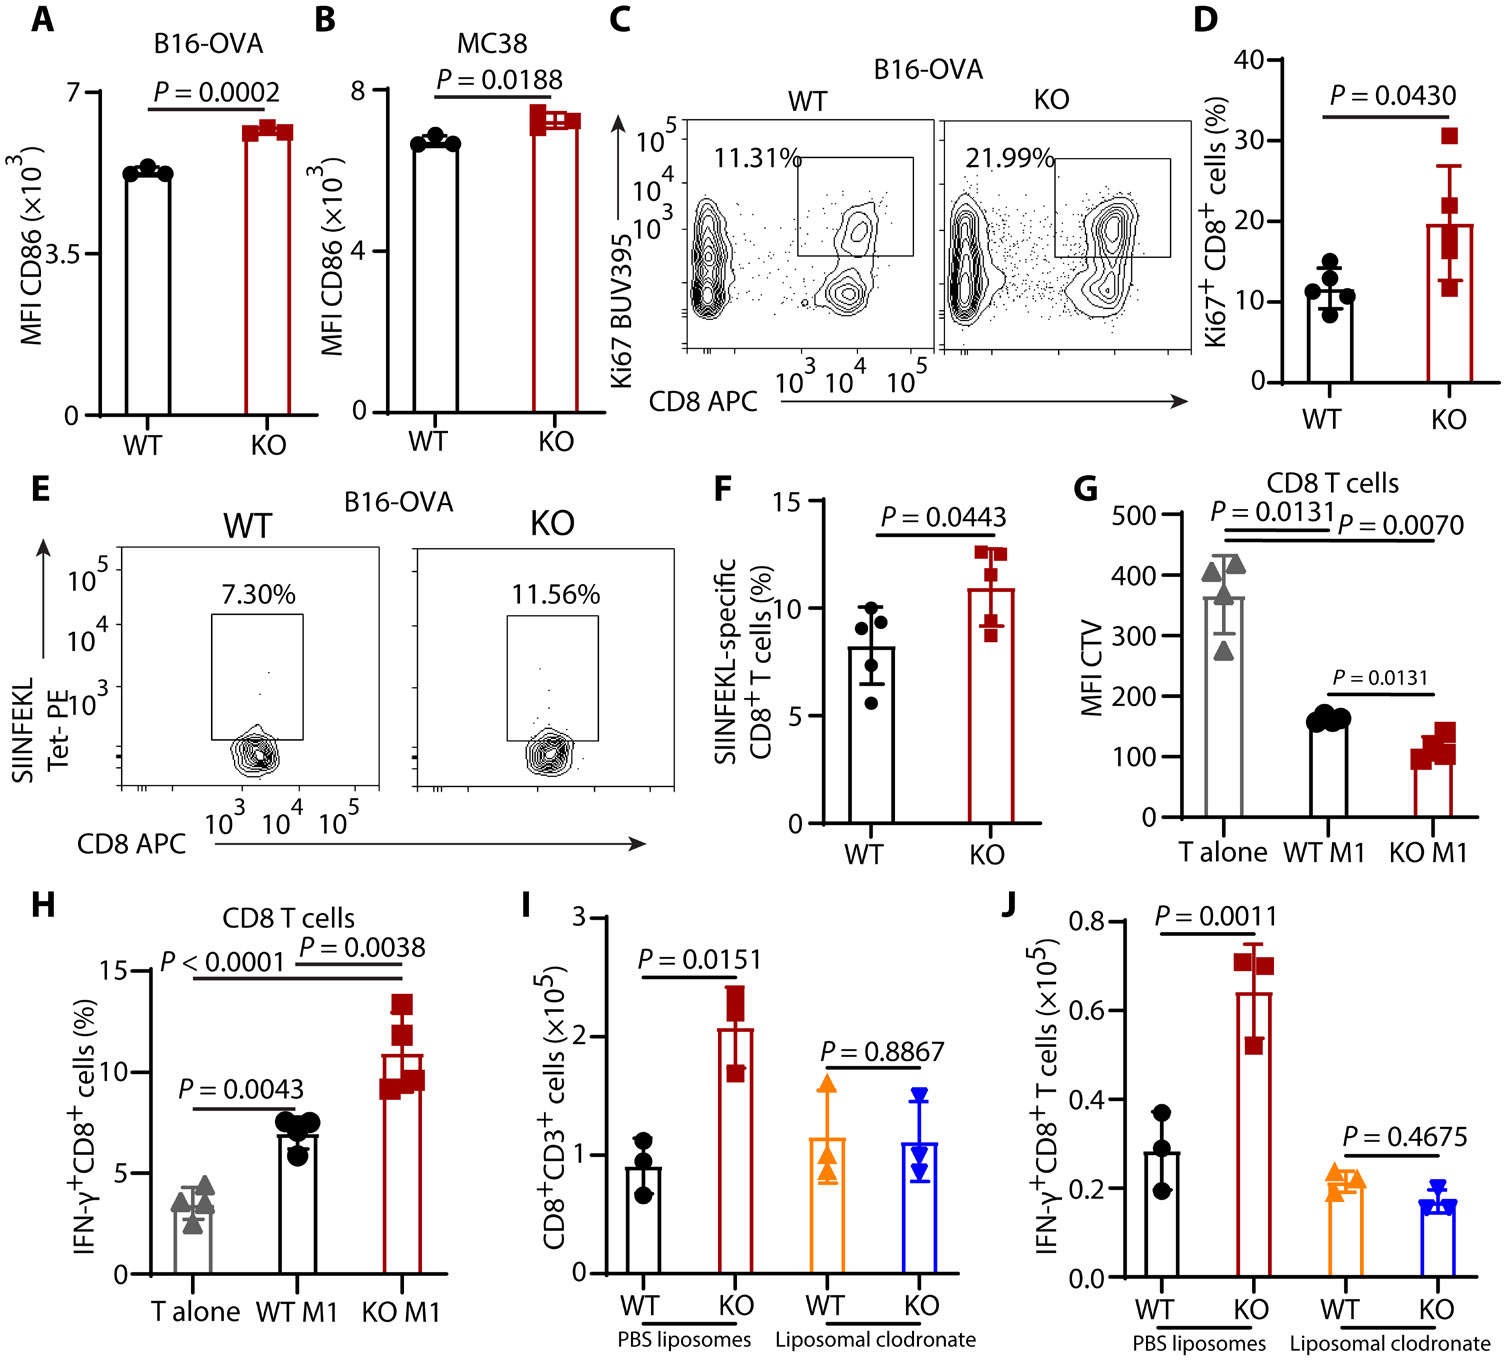
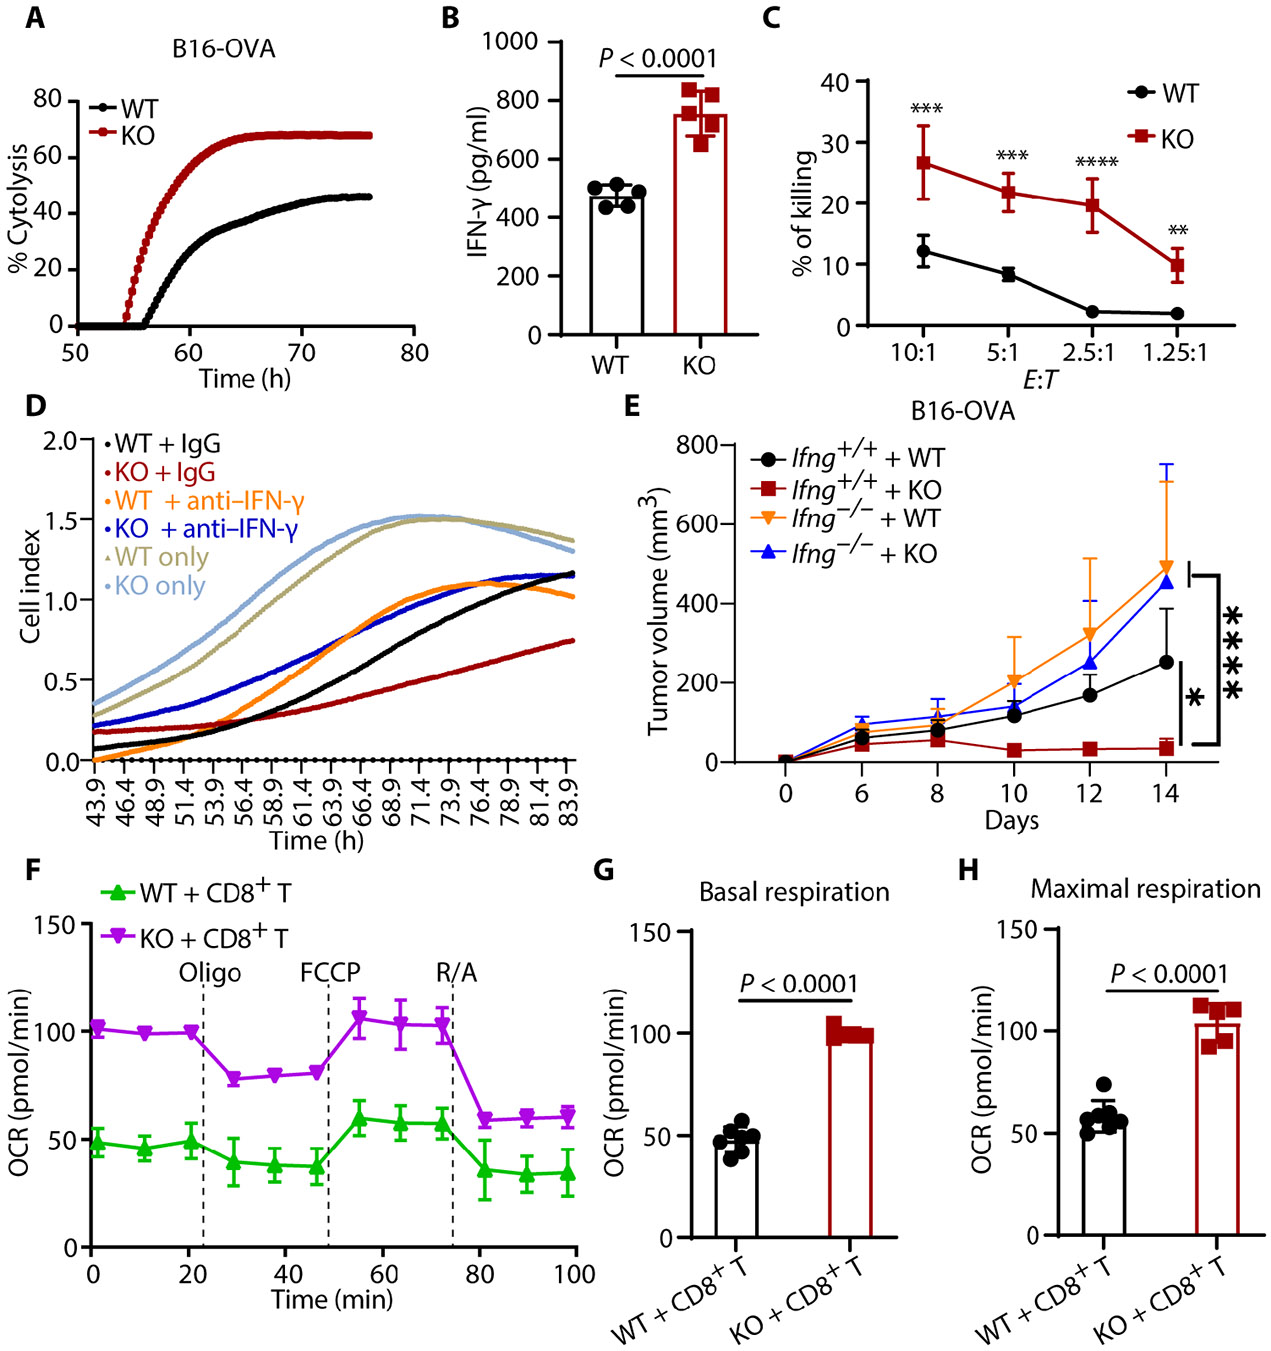
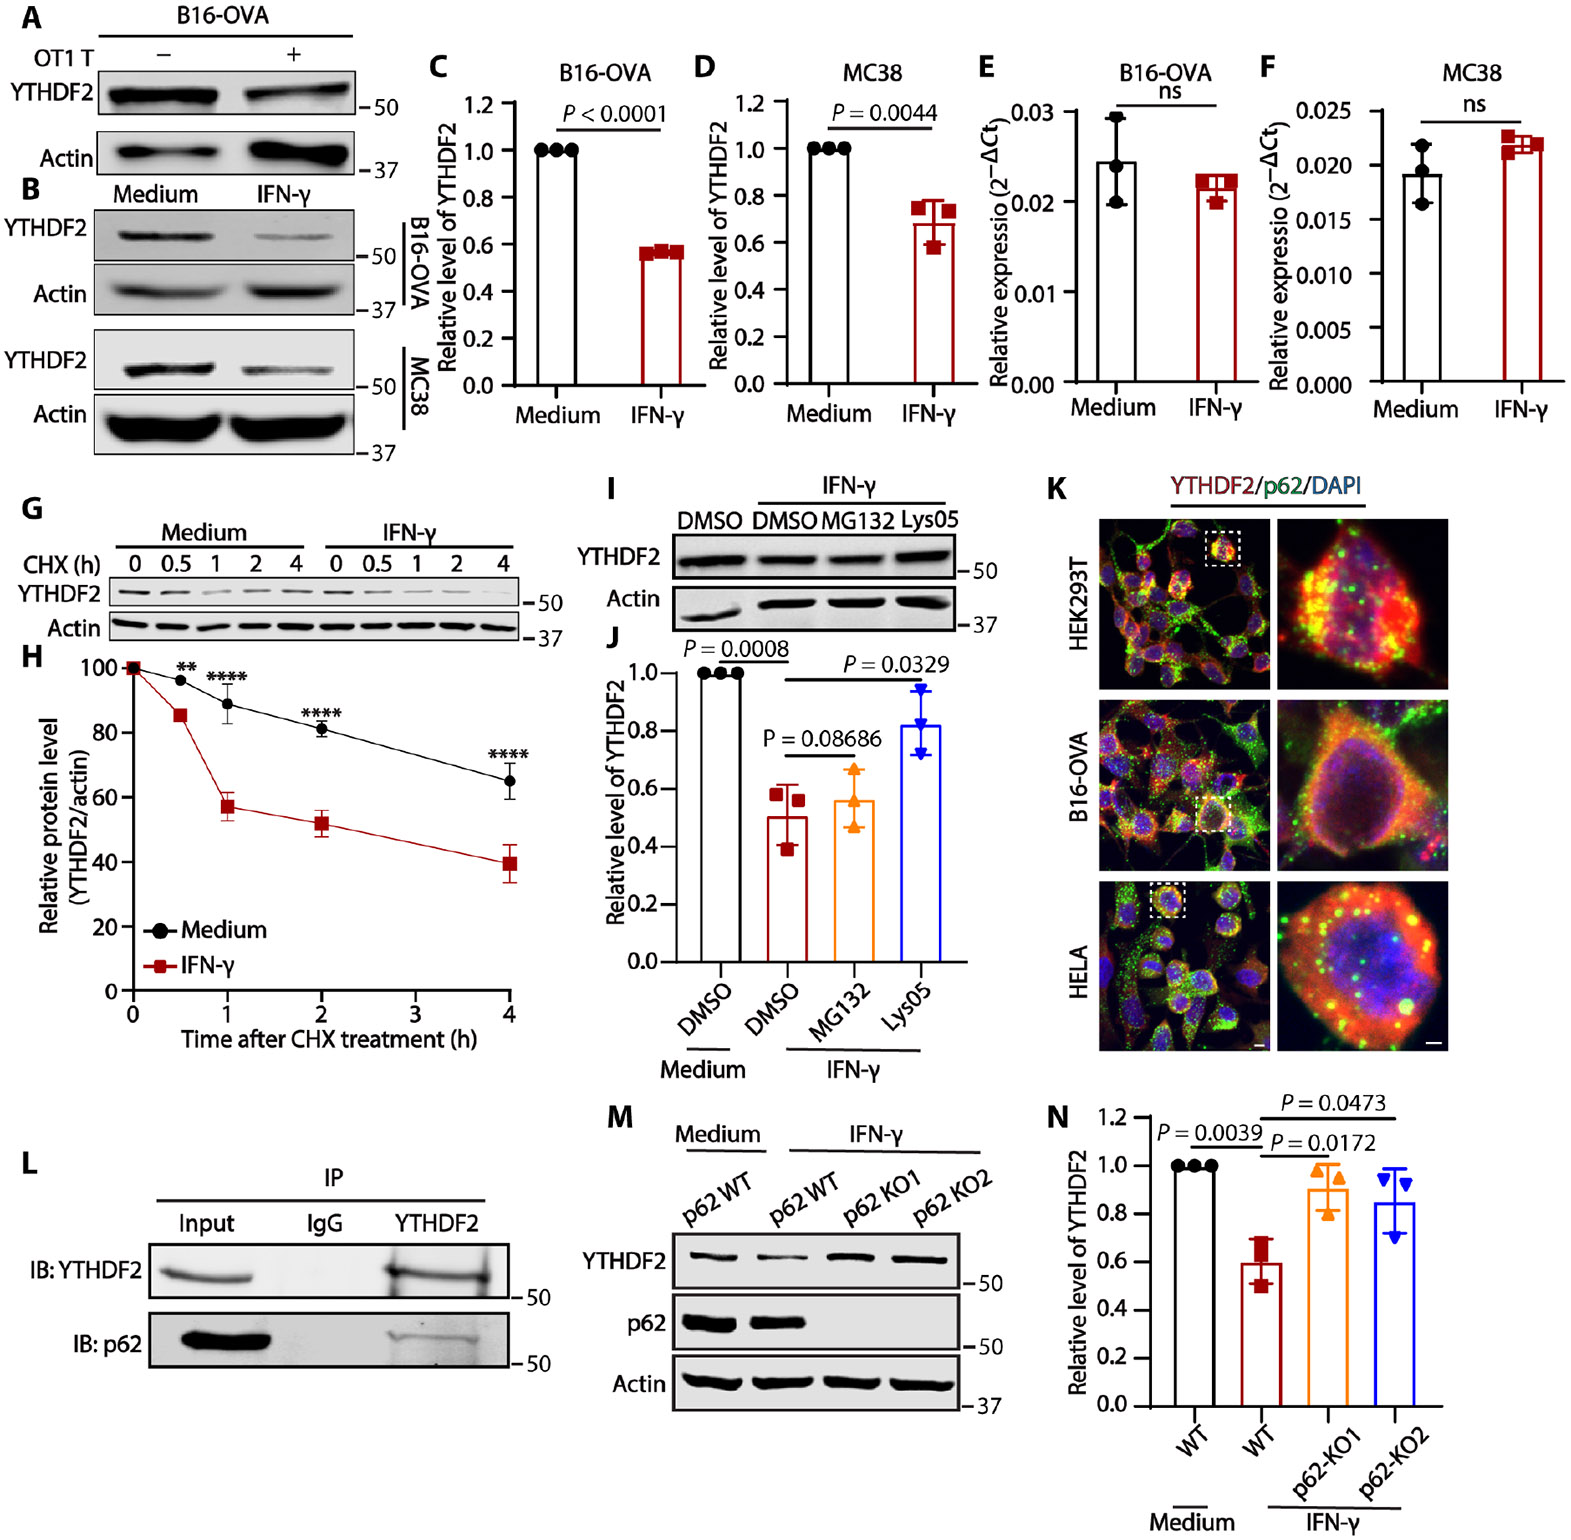
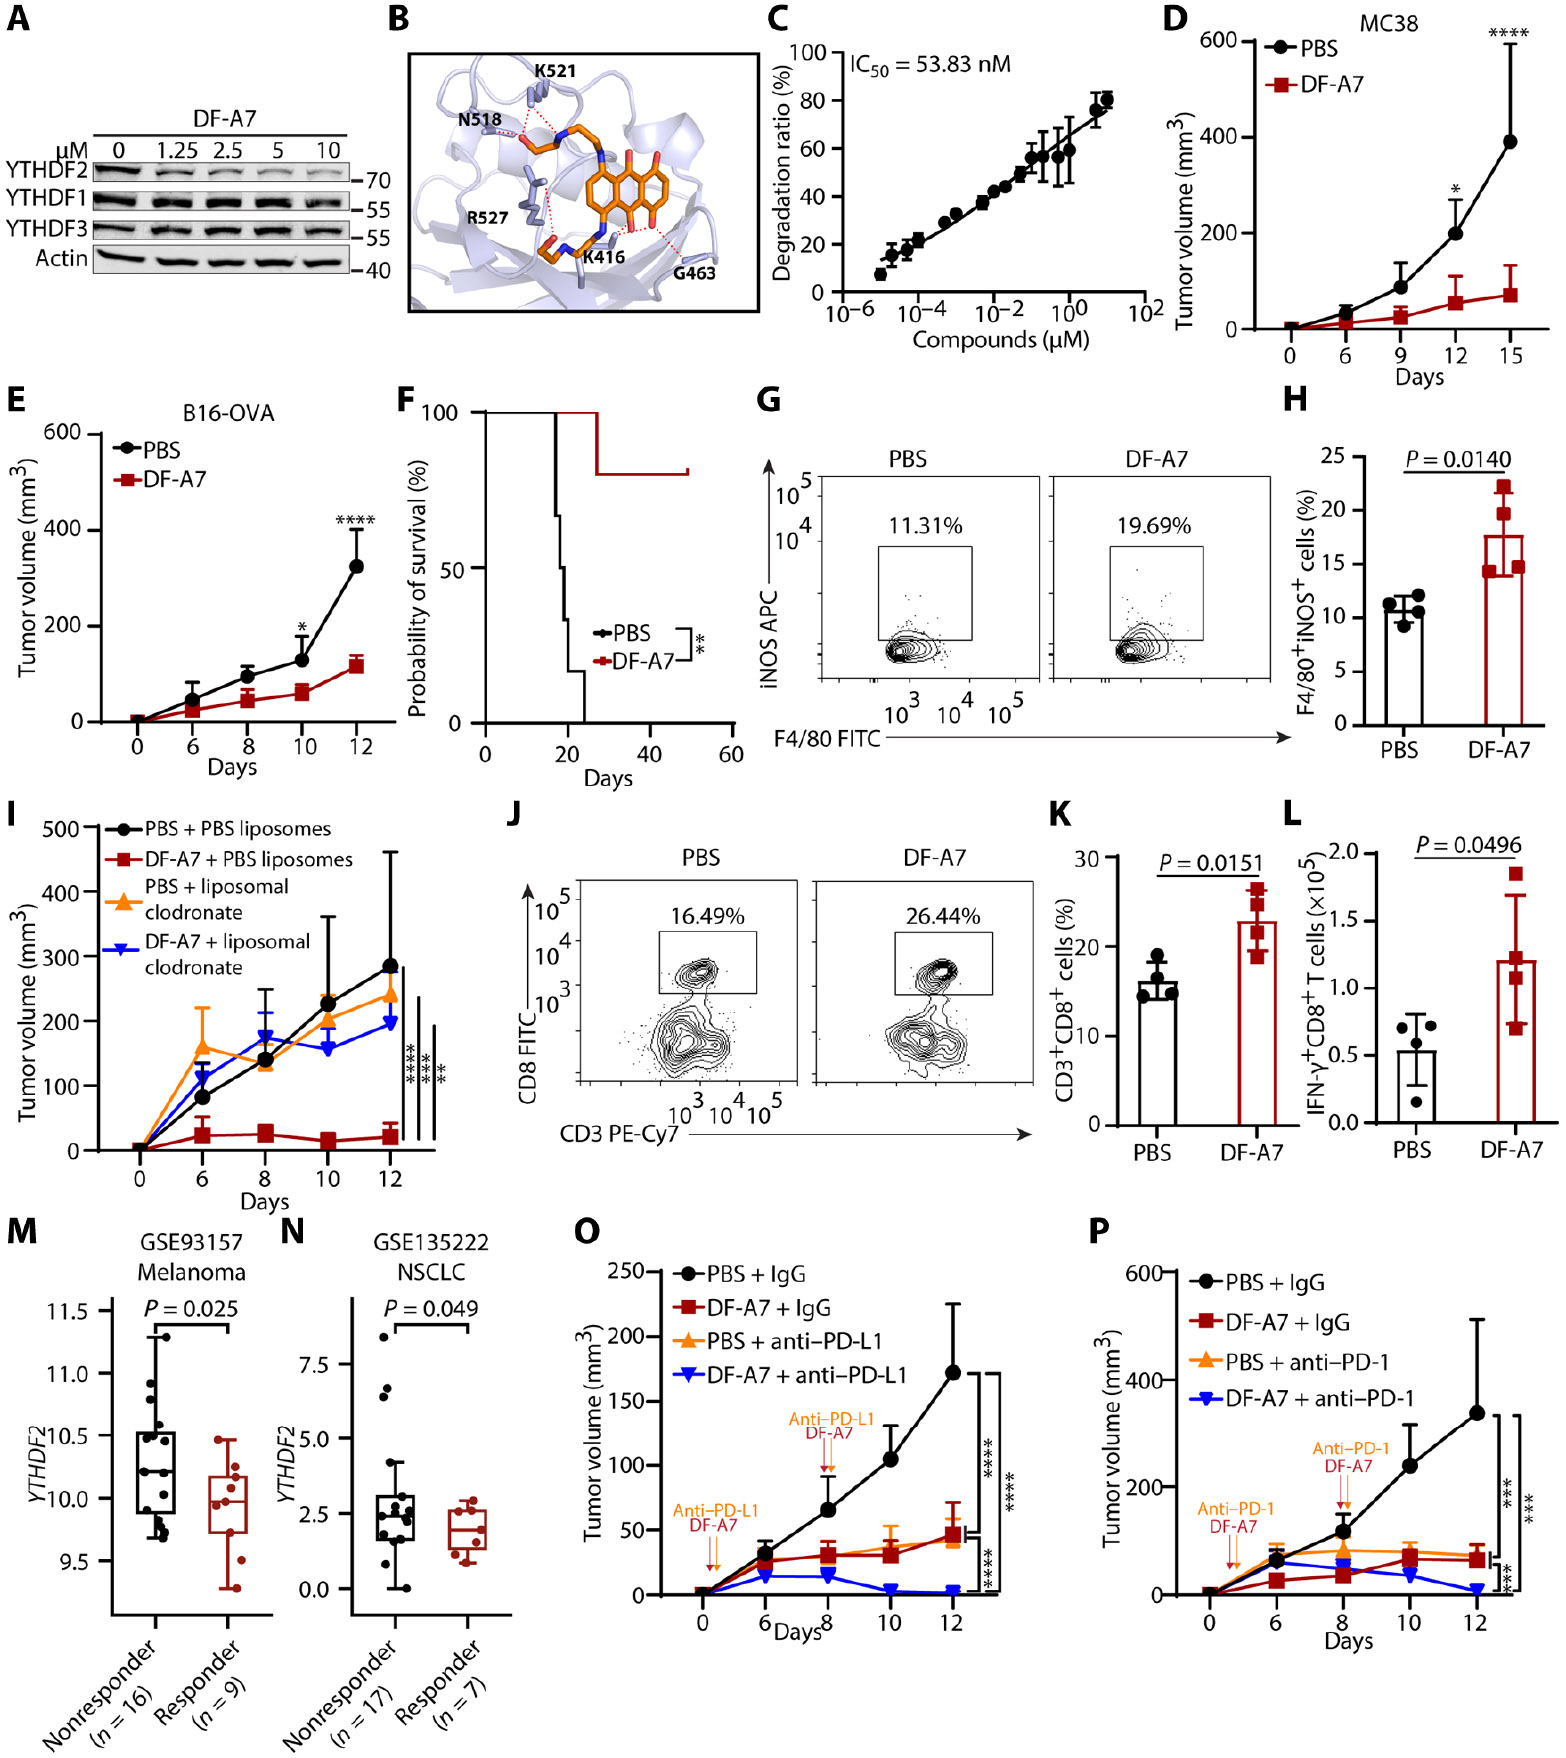
Tumors evade attacks from the immune system through various mechanisms. Here, we identify a component of tumor immune evasion mediated by YTH domain-containing family protein 2 (YTHDF2), a reader protein that usually destabilizes m6A-modified mRNA. Loss of tumoral YTHDF2 inhibits tumor growth and prolongs survival in immunocompetent tumor models. Mechanistically, tumoral YTHDF2 deficiency promotes the recruitment of macrophages via CX3CL1 and enhances mitochondrial respiration of CD8+ T cells by impairing tumor glycolysis metabolism. Tumoral YTHDF2 deficiency promotes inflammatory macrophage polarization and antigen presentation in the presence of IFN-γ. In addition, IFN-γ induces autophagic degradation of tumoral YTHDF2, thereby sensitizing tumor cells to CD8+ T cell-mediated cytotoxicity. Last, we identified a small molecule compound that preferentially induces YTHDF2 degradation, which shows a potent antitumor effect alone but a better effect when combined with anti-PD-L1 or anti-PD-1 antibodies. Collectively, YTHDF2 appears to be a tumor-intrinsic regulator that orchestrates immune evasion, representing a promising target for enhancing cancer immunotherapy.


Figures

Fig. 1.
Fig. 1.. Genetic deletion of Ythdf2 in tumor cells impairs tumor progression in immunocompetent mice.
(A and B) The tumor growth of WT and Ythdf2-KO MC38 tumors (n = 5) and B16-OVA tumors (n = 6) in C57BL/6 mice. C57BL/6 mice were subcutaneously injected with either 1 × 10⁶ WT and Ythdf2-KO MC38 cells (A) or 1 × 10⁶ WT and Ythdf2-KO B16-OVA cells (B). Tumor sizes were measured every other day starting from the 12th or 14th day after tumor inoculation. (C and D) Overall survival of immunocompetent mice subcutaneously implanted with WT or Ythdf2-KO B16-OVA tumor cells (n = 14 for WT and n = 15 for KO) (C) or MC38 tumor cells (n = 8 for WT and n = 10 for KO) (D). (E and F) WT or Ythdf2-KO B16-OVA tumors were transplanted from Rag1−/− to C57BL/6 mice (n = 4). Tumor volume (E) and tumor weight (F) were measured on the 14th day after the tumor was transplanted. (G) A total of 1 × 10⁶ WT or Ythdf2-KO B16-OVA tumor cells were subcutaneously implanted in C57BL/6 mice pretreated with anti–immunoglobulin G (IgG), anti-NK1.1, anti-CD4, and anti-CD8 antibodies (n = 5 or 6). Tumor growth was monitored by measuring tumor sizes every other day starting from the eighth day after tumor inoculation. (H and I) WT or Ythdf2-KO MC38-OVA (H) and B16-OVA (I) tumor growth in Rag1−/− mice that were adoptively transferred with OT1 CD8+ T cells. The mice were subcutaneously injected with either 1 × 10⁶ WT or Ythdf2-KO tumor cells. Tumor sizes were measured every other day starting from the sixth day after tumor inoculation (n = 5). (J) WT or Ythdf2-KO B16F10 tumor growth in Rag1−/− mice that were adoptively transferred with gp100-stimulated pmel-1 splenocytes. The mice were subcutaneously injected with either 1 × 10⁶ WT or Ythdf2-KO tumor cells. Tumor sizes were measured every other day starting from the sixth day after tumor inoculation (n = 5). Data are represented as means ± SD. Statistical analysis was performed using two-way ANOVA with a mixed-effects model with P values adjusted by a Holm-Šídák method for multiple comparisons (A, B, G, H, I, and J), unpaired two-tailed t test (E and F), or Kaplan-Meier survival analysis and log-rank test (C and D). The data presented represent one of two or three independent experiments. *P < 0.05, **P < 0.01, and ****P < 0.001.
Fig. 2.
Fig. 2.. YTHDF2 deficiency in tumor cells reprograms the immunosuppressive TME.
(A) A UMAP plot from scRNA-seq data showing seven cell clusters of CD45+ tumor-infiltrated immune cells sorted from WT and Ythdf2-KO B16-OVA–bearing mice that were euthanized 14 days after B16-OVA tumor inoculation. (B and C) A UMAP plot (B) and the proportions (C) of M1 (antitumoral) and M2 (protumoral) TAMs from scRNA-seq data, as in (A). (D) Representative GO clusters of up-regulated genes in antitumoral macrophages from scRNA-seq data. (E to G) Representative plots (E), the percentage (F), and absolute number (G) of iNOS+F4/80+ TAMs from WT and Ythdf2-KO B16-OVA tumors. The mice were subcutaneously injected with either 1.5 × 10⁶ WT or Ythdf2-KO tumor cells and were euthanized 14 days after tumor inoculation to harvest the tumor tissues (n = 4). APC, allophycocyanin. (H and I) A UMAP plot (H) and the proportions (I) of T cell subpopulations from scRNA-seq data, as in (A). Teff cells, effector T cells; TN, naïve T cells. (J) Representative GO clusters of up-regulated genes in effector CD8+ T cells and Ki67+CD8+ T cell subpopulations from scRNA-seq data. (K to M) Representative plots (K), percentage (L), and absolute number (M) of CD8+CD3+ T cells from WT and Ythdf2-KO B16-OVA tumors. The mice were subcutaneously injected with either 1.5 × 10⁶ WT or Ythdf2-KO tumor cells and were euthanized 14 days after tumor inoculation to harvest the tumor issues (n = 4). (N and O) Representative plots (N) and absolute number (O) of IFN-γ+CD8+ T cells from WT and Ythdf2-KO B16-OVA tumors. The mice were subcutaneously injected with either 1.5 × 10⁶ WT or Ythdf2-KO tumor cells and were euthanized 14 days after tumor inoculation to harvest the tumor tissues (n = 4). Data are represented as means ± SD. Statistical analysis was performed using an unpaired two-tailed t test (F, G, L, M, and O). The data presented represent one of two or three independent experiments.
Fig. 3.
Fig. 3.. Loss of YTHDF2 in tumor cells promotes the recruitment of CX3CR1+ macrophages via CX3CL1.
(A) Volcano plot showing the DEGs between WT and Ythdf2-KO MC38 tumors. FDR, false discovery rate. (B) Top 10 GO clusters of up-regulated genes in RNA-seq data. (C) Heatmap of DEGs in the leukocyte migration pathway between WT and Ythdf2-KO MC38 tumor cells. (D) Overlapping analysis of genes identified by RNA-seq (up-regulated genes), m6A-seq, and RIP-seq. Eighty-one up-regulated DEGs bound by YTHDF2 and marked with m6A are listed on the right. (E and F) The absolute number of CX3CR1+CD86+ TAMs from WT and Ythdf2-KO B16-OVA tumor cells (E), as well as WT and Ythdf2-KO MC38 tumor cells (F). The mice were subcutaneously injected with either 1.5 × 10⁶ WT or Ythdf2-KO tumor cells and were euthanized 14 days after tumor inoculation to harvest the tumor tissues (n = 3 or 4). (G) The migration cell number of BMDMs induced by WT or Ythdf2-KO B16-OVA tumor cell culture supernatants, measured with a transwell assay (n = 3). (H) The migration cell number of BMDMs induced by WT or Ythdf2-KO B16-OVA tumor cell culture supernatants with or without AZD8797 was measured using a transwell assay (n = 3). DMSO, dimethyl sulfoxide. (I) WT C57BL/6 mice were subcutaneously injected with 1 × 10⁶ WT or Ythdf2-KO B16-OVA tumor cells. Tumor-inoculated C57BL/6 mice received either an intraperitoneal injection of AZD8797 (1 mg/kg) or an equal amount of PBS daily for 13 days. Tumor sizes were measured every other day starting from the seventh day after tumor inoculation (n = 5). (K) WT and Ythdf2-KO B16-OVA tumor growth in Cx3cr1+/+ and Cx3cr1−/− chimeric mice. These chimeric mice were subcutaneously injected with either 1 × 10⁶ WT or Ythdf2-KO tumor cells. Tumor sizes were measured every other day starting from the sixth day after tumor inoculation (n = 3). (J and L) WT C57BL/6 mice were subcutaneously injected with 1 × 10⁶ WT or Ythdf2-KO B16-OVA tumor cells (J) or MC38 tumor cells (L). These tumor-inoculated mice received either an intraperitoneal injection of liposomal clodronate (200 μl per mouse) or an equal amount of liposomal PBS solution on days 0 and 7 after tumor inoculation. Tumor sizes were measured every other day starting from the sixth day after tumor inoculation (n = 5). Data are represented as means ± SD. Statistical analysis was performed using two-way ANOVA with a mixed-effects model (I to L), one-way ANOVA model (H), or unpaired two-tailed t test (E to G). P values were adjusted for multiple comparisons using the Holm-Šídák method. The presented data represent one of two or three independent experiments. **P < 0.01 and ****P < 0.001. ns, not significant.
Fig. 4.
Fig. 4.. YTHDF2 decreases the stability of Cx3cl1 mRNA in tumor cells.
(A) Distribution of m6A peaks and YTHDF2-binding peaks across Cx3cl1 by Integrative Genomics Viewer. (B and C) qPCR analysis of mRNA expression of Cx3cl1 after intrasample normalization to the reference gene Actb in WT or Ythdf2-KO MC38 (B) and B16-OVA (C) cells. (D and E) Enzyme-linked immunosorbent assay (ELISA) analysis of the expression of CX3CL1 protein secreted from WT and Ythdf2-KO MC38 (D) or B16-OVA (E) tumor cell culture supernatants. (F to I) RIP using either an antibody to m6A (F and H) or to YTHDF2 (G and I) followed by qPCR in MC38 (F and G) and B16-OVA (H and I) tumor cells revealed that the Cx3cl1 site in the 3′UTR region was m6A-methylated and enriched in YTHDF2 binding. Rabbit IgG served as a control. Enrichment of the indicated genes was normalized on the basis of the input (n = 3). (J and K) The mRNA half-life (t1/2) of Cx3cl1 transcript in WT and Ythdf2-KO MC38 tumor cells (J) and B16-OVA (K) tumor cells. The analysis involved fitting a linear regression model using log(y) versus time, followed by the transfer back to the nonlinear regression model through an exponential function. (J) y = exp−0.250t (R2 = 0.901) for WT and y = exp−0.100t (R2 = 0.901) for KO. (K) y = exp−0.516t (R2 = 0.997) for WT and y = exp−0.307t (R2 = 0.997) for KO. Two slopes (decay rate) were compared within the full linear regression model using a t test (n = 2). Data are represented as means ± SD. Statistical analysis was performed using unpaired two-tailed t test (B to I). The data presented represent one of two or three independent experiments.
Fig. 5.
Fig. 5.. YTHDF2 deficiency promotes polarization and antigen presentation of antitumoral macrophages.
(A and B) Fluorescence-activated cell sorting (FACS) analysis of CD86 expression in BMDMs cocultured with WT or Ythdf2-KO B16-OVA (A) and MC38 (B) tumor cell culture supernatants in the presence of mouse IFN-γ at 1 ng/ml (n = 3). (C and D) Representative plots (C) and percentage (D) of Ki67+CD8+ T cells from WT or Ythdf2-KO B16-OVA tumor–bearing mice on the 14th day after tumor inoculation (n = 5). (E and F) Representative plots (E) and percentage (F) of SIINFEKL-specific CD8+ T cells from WT and Ythdf2-KO B16-OVA tumors. The mice were subcutaneously injected with either 1.5 × 10⁶ WT or Ythdf2-KO tumor cells and were euthanized 14 days after tumor inoculation to harvest the tumor issues (n = 5). (G and H) FACS analysis of CD8+ T cell proliferation (G) and percentage (H) of IFN-γ–producing OT1 CD8+ T cells. Naïve CD8+ T cells isolated from OT1 mice were cocultured with the SIINFEKEL peptide–loaded CD86+F4/80+CD11b+ TAMs isolated from WT or Ythdf2-KO B16-OVA tumors on the 14th day after tumor inoculation (n = 4). (I and J) The absolute number of CD3+CD8+ (I) and IFN-γ+CD8+ (J) T cells from WT and Ythdf2-KO MC38 tumors with or without macrophage depletion on the 14th day after tumor inoculation. A total of 1.5 × 10⁶ tumor cells were subcutaneously inoculated, and tumor-bearing mice received intraperitoneal injections of either liposomal clodronate (200 μl per mouse) or an equal amount of liposomal PBS solution on days 0 and 7 (n = 3). Data are represented as means ± SD. Statistical analysis was performed using unpaired two-tailed t tests (A, B, D, and F) or one-way ANOVA models with P values adjusted for multiple comparisons by Holm-Šídák method (G to J). The data presented represent one of three to five independent experiments.
Fig. 6.
Fig. 6.. The Ythdf2-KO tumor cells directly affect CD8+ T cell effector function by suppressing the glycolysis of tumor cells.
(A) The ability of OT1 CD8+ T cells to lyse WT or Ythdf2-KO B16-OVA tumor cells, measured by real-time cell analysis. (B) ELISA analysis of the expression of IFN-γ protein secreted by OT1 CD8+ T cells when cocultured with either WT or Ythdf2-KO B16-OVA tumor cells (n = 5). (C) Cytotoxicity of OT1 CD8+ T cells against WT or Ythdf2-KO MC38-OVA tumor cells was evaluated by a standard 51Cr release assay (n = 3). E:T, effector to target ratio. (D) The proliferation of WT or Ythdf2-KO B16-OVA tumor cells when cocultured with OT1 CD8+ T cells either with or without an anti–IFN-γ antibody, measured by real-time cell analysis. (E) Ifng+/+ and Ifng−/− C57BL/6 mice were subcutaneously injected with 5 × 10⁵ WT and Ythdf2-KO B16-OVA cells. Tumor sizes were measured starting from the sixth day after tumor inoculation (n = 5). (F) The graph represents measurements of OCR upon the addition of oligomycin (oligo), carbonyl cyanide p-trifluoromethoxyphenylhydrazone (FCCP), and a combination of rotenone and antimycin A (R/A). Measurements were taken from OT1 CD8+ T cells after a 24-hour coculture with either WT or Ythdf2-KO B16-OVA tumor cells. (G and H) Quantified basal respiration (G) and maximal respiration (H) of OT1 CD8+ T cells after cocultured with WT or Ythdf2-KO B16-OVA tumor cells for 24 hours (n = 5 to 7). Data are represented as means ± SD. Statistical analysis was performed using unpaired two-tailed t tests (B, G, and H) or two-way ANOVAs with a mixed-effects model with P values adjusted for multiple comparisons by Holm-Šídák method (D). *P < 0.05, **P < 0.01, ***P < 0.001, and ****P < 0.0001. The data presented represent one of two or three independent experiments.
Fig. 7.
Fig. 7.. CD8+ T cell–derived IFN-γ induces autophagic degradation of tumoral YTHDF2.
(A) Immunoblotting showing the expression of YTHDF2 in B16-OVA tumor cells after coculture with OT1 CD8+ T cells for 24 hours. (B to D) Representative immunoblotting plot (B) and the quantification of YTHDF2 protein in B16-OVA (C) and MC38 (D) tumor cells after treatment with IFN-γ (100 ng/ml) for 24 hours. (E and F) qPCR analysis of Ythdf2 mRNA expression in WT B16-OVA (E) and MC38 (F) tumor cells after treatment with IFN-γ (100 ng/ml) for 24 hours. (G and H) WT B16-OVA tumor cells were treated with CHX for the indicated time periods, followed by the analysis of YTHDF2 expression using immunoblotting. Representative blots (G) and quantification of immunoblotting signals of YTHDF2 normalized to β-actin (H) are shown. (I and J) Representative immunoblotting plot (I) and the quantification (J) of YTHDF2 protein expression in B16-OVA tumor cells after treatment with IFN-γ (100 ng/ml) for 24 hours. MG132 or Lys05 was then added to the IFN-γ–treated tumor cells for 6 hours before collection. DMSO served as vehicle control. (K) Immunofluorescence analysis of p62 (green) and YTHDF2 (red) in HEK 293T cells, B16-OVA cells, and HeLa cells. DAPI (4′,6-diamidino-2-phenylindole) was used as a nuclear counterstain (blue). Scale bar, 20 μm (left) or 10 μm (right). (L) B16-OVA cell lysates were immunoprecipitated (IP) with rabbit anti-YTHDF2 or IgG isotype control and immunoblotted (IB) with rabbit anti-YTHDF2 or mouse anti-p62. (M and N) Representative immunoblotting plots (M) and the quantification (N) of YTHDF2 protein in WT and p62-KO B16-OVA tumor cells after treatment with IFN-γ (100 ng/ml) for 24 hours. The data are represented as means ± SD. Statistical analysis was performed using unpaired two-tailed t test (C to F), two-way ANOVA with a mixed-effects model (H), or one-way ANOVA model (J and N) with P values adjusted for multiple comparisons by Holm-Šídák method (H). **P < 0.01 and ****P < 0.0001. The data presented represent one of three independent experiments.
Fig. 8.
Fig. 8.. Inhibition of YTHDF2 by a screened small-molecule degrader suppresses tumor growth.
(A) Immunoblotting showing the expression of YTHDF1, YTHDF2, and YTHDF3 in HEK 293T cells after treatment with indicated doses of DF-A7 for 24 hours. PBS served as vehicle control. (B) The structural complex of YTHDF2 bound with DF-A7. YTHDF2 is colored gray; DF-A7 is colored orange. Hydrogen bonds are indicated with red dotted lines. (C) In vitro quantification of IC50 was performed to assess the impact of DF-A7 on YTHDF2 degradation using an immunoblotting assay (n = 3). The dose-response inhibition under the nonlinear regression model frame was used to fit the IC50. (D and E) The effect of DF-A7 on tumor growth of MC38 (D) and B16-OVA (E) cells in C57BL/6 mice. Tumor cells were subcutaneously inoculated, and tumor-bearing mice received intraperitoneal injections of either PBS or DF-A7 (12.5 mg/kg) on days 1 and 8 (n = 5). (F) WT C57BL/6 mice were subcutaneously injected with 1 × 10⁶ MC38 cells. Tumor-bearing mice received intraperitoneal injections of either PBS or DF-A7 (12.5 mg/kg) on days 1 and 8. The survival of the animals was monitored (n = 5 or 6). (G and H) Representative plots (G) and the percentages (H) of iNOS+F4/80+ TAMs from MC38 tumors on the 15th day after tumor inoculation. Tumor-bearing mice received intraperitoneal injections of either PBS or DF-A7 (12.5 mg/kg) on days 1 and 8 (n = 4). FITC, fluorescein isothiocyanate. (I) The effect of DF-A7 on the growth of MC38 tumors in C57BL/6 mice after macrophage depletion. Tumor cells were subcutaneously inoculated, and tumor-bearing mice received intraperitoneal injections of either PBS or DF-A7 (12.5 mg/kg; days 1 and 8) with liposomal clodronate (200 μl per mouse) or an equal amount of liposomal PBS solution on days 0 and 7 (n = 4). (J and K) Representative plots (J) and the percentage (K) of CD8+CD3+ T cells from MC38 tumors on the 15th day after tumor inoculation. Tumor-bearing mice received intraperitoneal injections of either PBS or DF-A7 (12.5 mg/kg) on days 1 and 8 (n = 4). (L) The absolute number of IFN-γ+CD8+ T cells from MC38 tumors on the 15th day after tumor inoculation. Tumor-bearing mice received intraperitoneal injections of PBS or DF-A7 (12.5 mg/kg) on days 1 and 8 (n = 4). (M and N) The expression of YTHDF2 was negatively correlated with ICB response in patients with melanoma (M) and NSCLC (N). Box plots: The horizontal lines indicate the first quartiles, second (median), and third quartiles; the whiskers extend to ±1.5× the interquartile range. (O and P) Therapeutic effect of DF-A7 in combination with ICBs on tumor growth of MC38 cells in C57BL/6 mice. Mice were subcutaneously inoculated with 1 × 10⁶ MC38 cells and received intraperitoneal injections of 200 μg per mouse of anti–PD-L1 antibody (O) and anti–PD-1 antibody (P) and/or DF-A7 (3.125 mg/kg) on days 1 and 8 (n = 5). Data are represented as means ± SD. Statistical analysis was performed using unpaired, two-tailed t tests by GraphPad Prism (H, K, and L); unpaired, two-tailed t tests by geom_signif function in R package ggsignif (M and N); two-way ANOVAs with a mixed-effects model with P values adjusted for multiple comparisons by Holm-Šídák method (D, E, I, and O); or Kaplan-Meier survival analysis and log-rank test (F). For statistical analysis in (P), the tumor volume was transformed into log2, and then the Holm-Šídák method was used for P value adjustment for multiple comparisons. *P < 0.05, **P < 0.01, ***P < 0.001, and ****P < 0.0001. The data presented represent one of two or three independent experiments.

Similar articles

Cited by

References

    1. Sanmamed MF, Chen L, A paradigm shift in cancer immunotherapy: From enhancement to normalization. Cell 175, 313–326 (2018). - PMC - PubMed
    1. Tormoen GW, Crittenden MR, Gough MJ, Role of the immunosuppressive microenvironment in immunotherapy. Adv. Radiat. Oncol 3, 520–526 (2018). - PMC - PubMed
    1. Said SS, Ibrahim WN, Cancer resistance to immunotherapy: Comprehensive insights with future perspectives. Pharmaceutics 15, 1143 (2023). - PMC - PubMed
    1. Beatty GL, Gladney WL, Immune escape mechanisms as a guide for cancer immunotherapy. Clin. Cancer Res 21, 687–692 (2015). - PMC - PubMed
    1. Hanahan D, Hallmarks of cancer: New dimensions. Cancer Discov. 12, 31–46 (2022). - PubMed

Publication types