. 2024 May 31;10(22):eadk9681.
doi: 10.1126/sciadv.adk9681. Epub 2024 May 31.

HSDL2 links nutritional cues to bile acid and cholesterol homeostasis

Affiliations

HSDL2 links nutritional cues to bile acid and cholesterol homeostasis

Nolwenn Samson et al. Sci Adv. .

Abstract

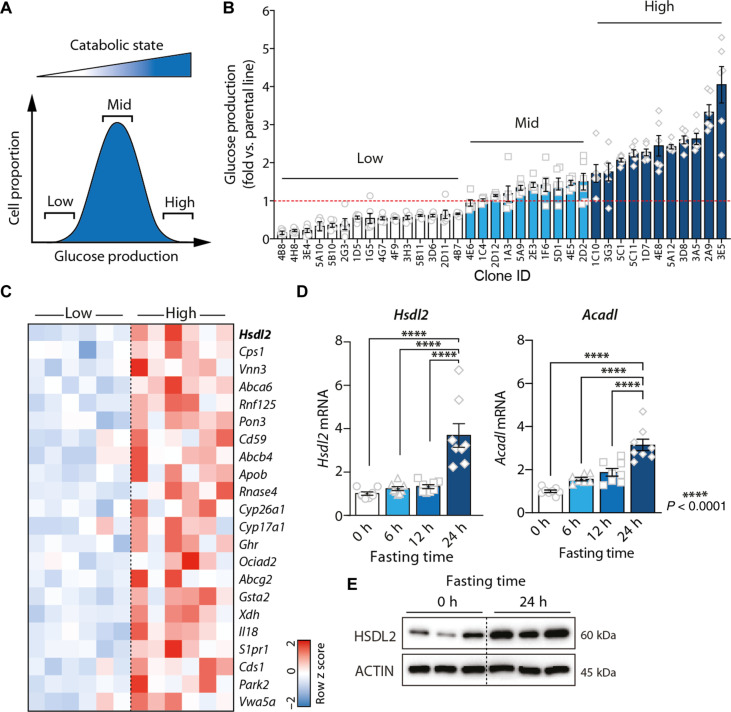
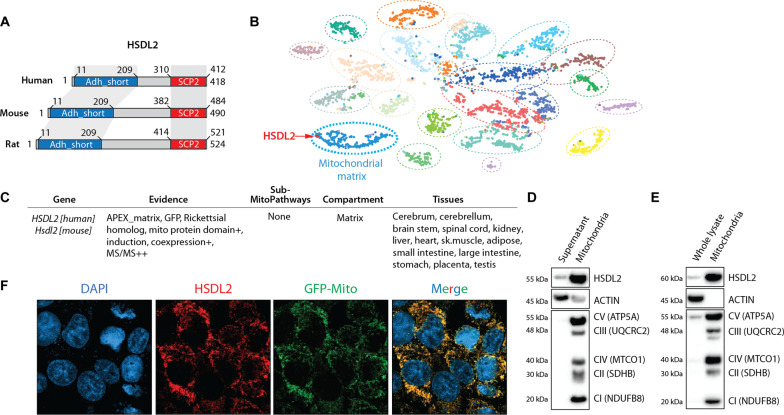
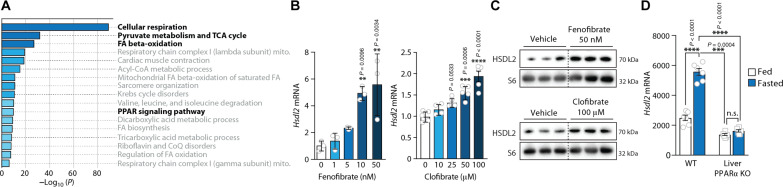
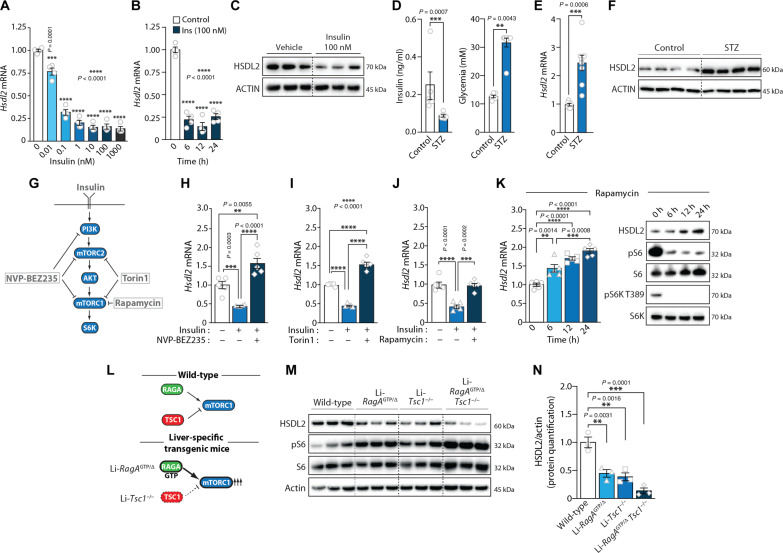
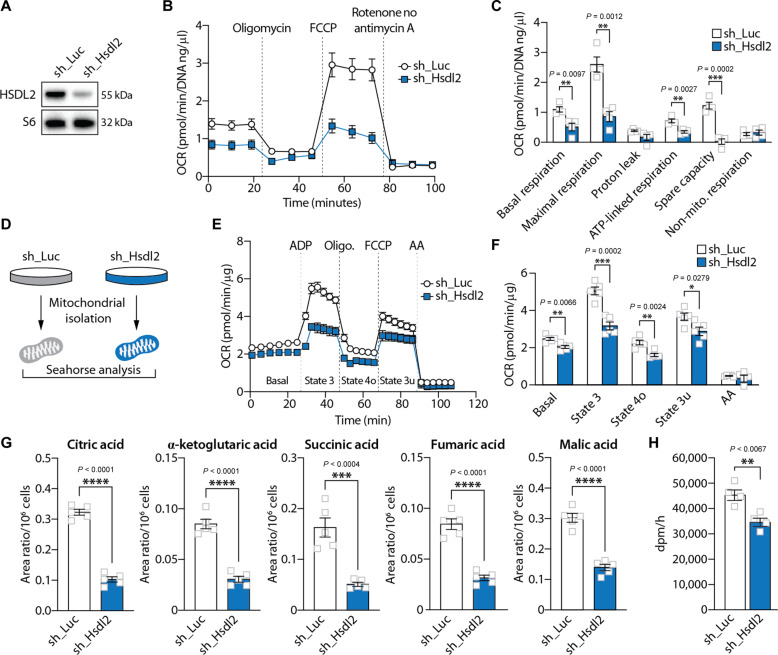
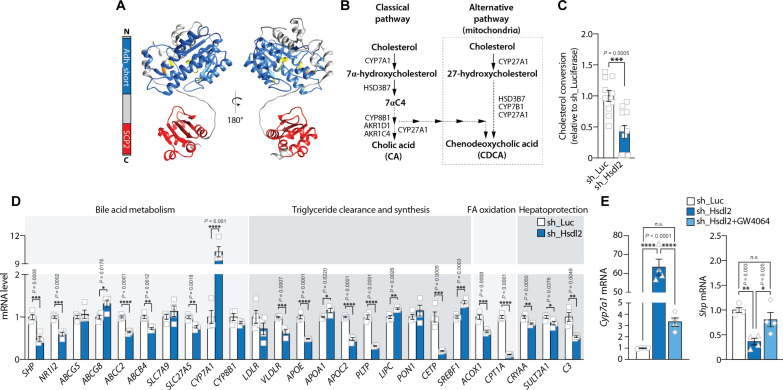
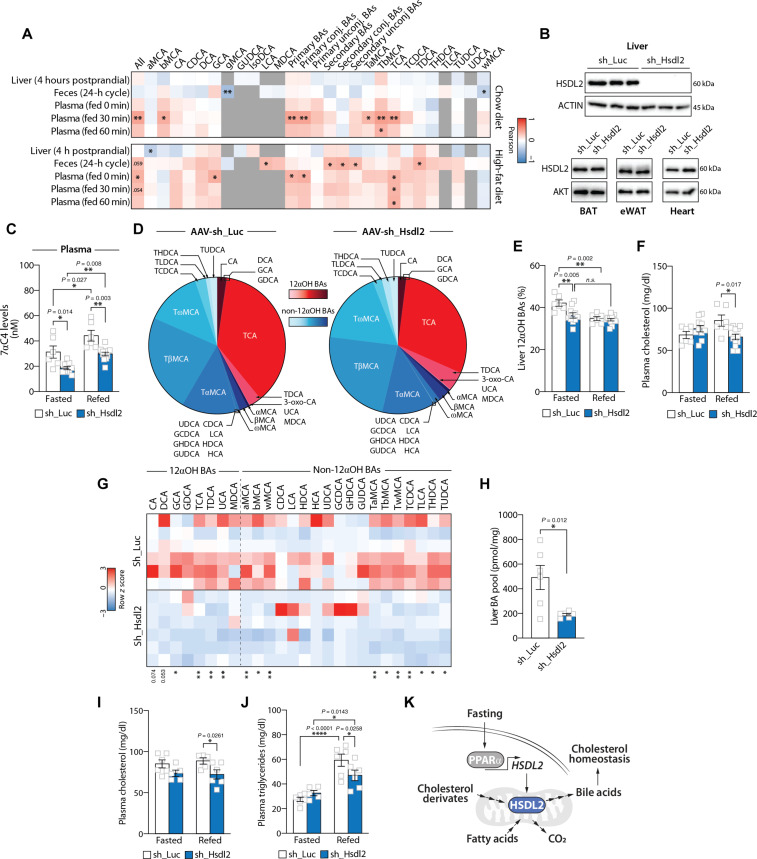
In response to energy and nutrient shortage, the liver triggers several catabolic processes to promote survival. Despite recent progress, the precise molecular mechanisms regulating the hepatic adaptation to fasting remain incompletely characterized. Here, we report the identification of hydroxysteroid dehydrogenase-like 2 (HSDL2) as a mitochondrial protein highly induced by fasting. We show that the activation of PGC1α-PPARα and the inhibition of the PI3K-mTORC1 axis stimulate HSDL2 expression in hepatocytes. We found that HSDL2 depletion decreases cholesterol conversion to bile acids (BAs) and impairs FXR activity. HSDL2 knockdown also reduces mitochondrial respiration, fatty acid oxidation, and TCA cycle activity. Bioinformatics analyses revealed that hepatic Hsdl2 expression positively associates with the postprandial excursion of various BA species in mice. We show that liver-specific HSDL2 depletion affects BA metabolism and decreases circulating cholesterol levels upon refeeding. Overall, our report identifies HSDL2 as a fasting-induced mitochondrial protein that links nutritional signals to BAs and cholesterol homeostasis.


Figures

Fig. 1.
Fig. 1.. HSDL2 is a protein highly expressed in catabolic hepatocytes.
(A) Glucose production is a catabolic process that is normally distributed in cultured hepatocytes. This characteristic was exploited to identify genes controlling catabolism in hepatocytes. (B) Glucose production was measured in 36 clonal lines isolated from a parental culture of FAO cells. Glucose was measured in six independent wells per clone, and results were corrected by protein content. (C) Heatmap showing the expression levels of selected genes measured by microarray in Low (n = 6) and High (n = 6) catabolic cell lines. The genes presented are the 22 high-priority candidate genes identified using the decision matrix presented in fig. S1E. (D) Male C57BL/6J mice were euthanized after either 0, 6, 12, or 24 hours (n = 8 per group) of fasting, and liver samples were collected. RNA was extracted, and gene expression was measured by quantitative real-time polymerase chain reaction (RT-qPCR). (E) Protein lysates were prepared from liver samples collected from mice fasted for 0 or 24 hours, and Western blots were performed for the indicated proteins. Representative samples are shown (n = 3 per group). In all panels, data are presented as means ± SEM. In (D), significance was determined by one-way analysis of variance (ANOVA) with Tukey’s multiple-comparisons test.
Fig. 2.
Fig. 2.. HSDL2 is a mitochondrial protein.
(A) Schematic presentation of human, mouse, and rat HSDL2 protein. The conserved domains are presented in red and blue. (B) Visual presentation of subcellular HSDL2 localization in HEK293 cells using the Cell Map Resource. In this graph, each dot represents a protein, and each dashed circle represents a cell compartment. (C) Presentation of the results of HSDL2 localization using the MitoCarta 3.0 resource. Results are presented for both human and mouse HSDL2. A complete description of the “evidence” sections follows. APEX_matrix, detected in the mitochondrial matrix in HEK293 cells based on APEX labeling. GFP, mitochondrial localization observed by green fluorescent protein (GFP)–tagging and low-resolution microscopy in this study (95). Rickettsial homolog, gene has a homolog to Rickettsia prowazekii based on BLASTP (with expected <1 × 10⁻³) or jackHMMER reciprocal hit. Mito protein domain, protein has a mitochondrial-specific Pfam domain. Coexpression, mouse transcript is coexpressed with known mitochondrial genes across mouse tissues (+ and ++ indicate higher levels of coexpression). MS/MS, mouse protein detected with high confidence in mitochondrial samples from 14 tissues (+ and ++ indicate higher confidence of detection). (D) HepG2 cells were fractionated to separate mitochondria from the other organelles. Protein lysates were prepared from mitochondrial pellet and the supernatant containing nonmitochondrial organelles. Western blots were next performed for the indicated proteins. (E) Mitochondria were isolated from mouse liver samples, and Western blots were performed, as described in (D). (F) HepG2 cells expressing a GFP-tagged mitochondrial protein (green) were fixed, and immunofluorescence assay was performed against endogenous HSDL2 (red). Nuclei were stained with 4′,6-diamidino-2-phenylindole (DAPI; blue). The scale presented is 101.41 by 101.41 μm. Representative pictures are shown.
Fig. 3.
Fig. 3.. The expression of Hsdl2 is induced by PPARα.
(A) Gene ontology analysis performed with Metascape on the 159 unique genes coexpressed with Hsdl2 in mouse tissues. A correlation coefficient equal or above 0.7 was fixed to select these genes, which are listed in table S5. Details about the Metascape results are presented in table S6. (B) FAO cells were treated for 6 hours with the indicated doses of fenofibrate or clofibrate. RNA was extracted, and Hsdl2 expression was quantified by RT-qPCR (n = 3 per dose of fenofibrate; n = 4 to 5 per dose of clofibrate). (C) Protein lysates were prepared from the experiment described in (B), and Western blots were performed for the indicated proteins (n = 3 per group). (D) The publicly available National Center for Biotechnology Information’s Gene Expression Omnibus dataset GSE96559 was used for this analysis (41). Briefly, wild-type (WT) and liver-specific PPARα knockout (KO) mice (males and 8 weeks old) were fed ad libitum or fasted for 24 hours (n = 6 per genotype per group). Liver samples were collected from each mouse, and microarray analyses were performed. In all panels, data are presented as means ± SEM. In (B), significance was determined by one-way ANOVA with Tukey’s multiple-comparisons test. In (B), only the significant effects versus dose 0 are presented. In (D), significance was determined by two-way ANOVA with Tukey’s multiple-comparisons test. n.s., not significant.
Fig. 4.
Fig. 4.. The expression of Hsdl2 is repressed by insulin downstream of mTORC1.
(A) FAO cells were serum-deprived for 12 hours and exposed to the indicated doses of insulin for 12 hours. RT-qPCR was performed after treatment (n = 4 per condition). (B) FAO cells were serum-deprived for 12 hours and were next treated with insulin for the indicated times. RT-qPCR was performed (n = 4 per condition). (C) FAO cells were serum-deprived for 12 hours and next treated with insulin for 12 hours. Proteins were extracted, and Western blots were performed. (D) Mice were injected with saline (n = 6) or STZ (n = 8). Seven days after injection, blood glucose and insulin were measured. (E) The mice used in (D) were euthanized, and liver samples were collected. RT-qPCR was performed. (F) Liver proteins were extracted from mice described in (D), and Western blots were performed. (G) Simplified overview of the insulin signaling pathway. The inhibitors used in this study are presented. (H to J) FAO cells were serum-starved for 12 hours. A group of cells was next treated with insulin (10 nM) with or without a pretreatment of 6 hours with (H) NVP-BEZ235, (I) Torin1, or (J) rapamycin. RT-qPCR was performed (n = 5 per condition). (K) FAO cells were treated with rapamycin for the indicated times. Left: Hsdl2 mRNA expression was measured by RT-qPCR (n = 5 per condition). Right: Proteins were extracted, and Western blots were performed. (L) Presentation of the genetic models used to study the impact of hyperactive mTORC1 signaling in mouse liver. (M) Mice were fasted for 24 hours. Liver proteins were extracted, and Western blots were performed. (N) HSDL2 protein quantification in the experiment presented in (M). In all panels, data are presented as means ± SEM. In (D) and (E), significance was determined by two-tailed, unpaired t test. In (A), (B), (H) to (K), and (N), significance was determined by one-way ANOVA with Tukey’s multiple-comparisons test.
Fig. 5.
Fig. 5.. HSDL2 depletion impairs mitochondrial respiration and metabolism.
(A) HepG2 cells were infected with a control shRNA (sh_Luciferase) or a shRNA targeting HSDL2 (sh_Hsdl2) and then selected with puromycin. Proteins were extracted 7 days after selection, and Western blot was performed. (B) OCR measurement in HepG2 cells during the Seahorse Mito Stress protocol (n = 5 per condition). (C) Respiration parameters calculated from the graph presented in (B). (D) HepG2 cells were transduced to express sh_Luciferase or sh_Hsdl2 and then selected with puromycin. Cells were then amplified, and mitochondria were isolated for further experiments. (E) OCR measurement in mitochondria extracted from HepG2 cells, following the mitochondria coupling assay protocol (n = 5 per condition). (F) Respiration parameters calculated form the graph presented in (E). (G) Levels of TCA intermediates measured by metabolomics in control and HSDL2-knockdown HepG2 cells (n = 5 per condition). (H) Measurement of palmitic acid oxidation in control and HSDL2-knockdown HepG2 cells (n = 4 per condition). In all panels, data are presented as means ± SEM. In (C) and (F) to (H), significance was determined by two-tailed, unpaired t test.
Fig. 6.
Fig. 6.. HSDL2 controls cholesterol conversion to BAs and FXR activation.
(A) HSDL2 structure modeled with AlphaFold. The ADH domain and SCP2 domains of HSDL2 are represented in blue and red, respectively. (B) Schematic description of the BA synthesis pathway in hepatocytes. (C) Levels of cholesterol conversion to BAs in control and HSDL2-depleted cells. HepG2 cells were exposed to radioactive cholesterol for 24 hours, and cholesterol derivates were extracted using Folch extraction. (D) HepG2 cells were infected, selected, and amplified. RNA was extracted, and the expression of genes involved in BA metabolism, triglyceride clearance and synthesis, fatty acid oxidation, and hepatoprotection was measured by RT-qPCR (n = 4 per condition). (E) HepG2 cells were exposed to vehicle (dimethyl sulfoxide) or GW4064 (20 μM) for 24 hours. Gene expression was then measured by RT-qPCR (n = 4 per condition). In all panels, data are presented as means ± SEM. In (C) and (D), significance was determined by two-tailed, unpaired t test. In (E), significance was determined by one-way ANOVA with Tukey’s multiple-comparisons test.
Fig. 7.
Fig. 7.. Liver-specific HSDL2 depletion affects hepatic BA metabolism and circulating cholesterol in mice.
(A) Heatmap showing the association between hepatic Hsdl2 expression and BA species in the liver, feces, and plasma from chow- or high-fat diet–fed mice. (B) Protein lysates were prepared from tissues collected from control and liver-specific HSDL2-knockdown mice, and Western blots were performed. (C) Mice were euthanized following either a fasting or a refeeding period (Fasted: sh_Luc, n = 6, and sh_Hsdl2, n = 10; Refed: sh_Luc, n = 6, and sh_Hsdl2, n = 12). 7α-Hydroxy-4-cholesten-3-one (7αC4) levels were measured in the plasma. (D) Hepatic BA profiling from control and liver-specific HSDL2-knockdown mice after 24 hours of fasting. Values of individual BAs are normalized to total BA pool. (E) Proportion of 12αOH BAs in the liver of mice described in (C). (F) Plasma cholesterol levels measured in mice described in (C). (G) Heatmap showing the liver BA composition of control and liver-specific HSDL2-knockdown mice after a 2-hour refeeding period with a high-cholesterol diet (sh_Luc, n = 6; sh_Hsdl2, n = 6). Values of BAs were log-transformed to produce the heatmap. (H) Total hepatic BA pool of control and liver-specific HSDL2-knockdown mice after a 2-hour refeeding period with a high-cholesterol diet (sh_Luc, n = 6; sh_Hsdl2, n = 6). (I) Plasma cholesterol levels measured in mice described in (G) (Fasted: sh_Luc, n = 6, and sh_Hsdl2, n = 5; Refed: sh_Luc, n = 5, and sh_Hsdl2, n = 6). (J) Plasma triglyceride levels measured in mice described in (G) (Fasted: sh_Luc, n = 6, and sh_Hsdl2, n = 5; Refed: sh_Luc, n = 6, and sh_Hsdl2, n = 6). (K) Schematic presentation of the proposed functions of hepatic HSDL2. In all panels, data are presented as means ± SEM. In (C), (E), (F), (I), and (J), significance was determined by two-way ANOVA with Tukey’s multiple-comparisons test. In (H), significance was determined by two-tailed, unpaired t test.

References

    1. Trefts E., Gannon M., Wasserman D. H., The liver. Curr. Biol. 27, R1147–R1151 (2017). - PMC - PubMed
    1. Duwaerts C. C., Maher J. J., Macronutrients and the adipose-liver axis in obesity and fatty liver. Cell. Mol. Gastroenterol. Hepatol. 7, 749–761 (2019). - PMC - PubMed
    1. Saltiel A. R., You are what you secrete. Nat. Med. 7, 887–888 (2001). - PubMed
    1. Laplante M., Sabatini D. M., mTOR signaling in growth control and disease. Cell 149, 274–293 (2012). - PMC - PubMed
    1. Saxton R. A., Sabatini D. M., mTOR signaling in growth, metabolism, and disease. Cell 168, 960–976 (2017). - PMC - PubMed