. 2024 May 31;10(22):eadk3229.
doi: 10.1126/sciadv.adk3229. Epub 2024 May 31.

Spinal inhibitory neurons degenerate before motor neurons and excitatory neurons in a mouse model of ALS

Affiliations

Spinal inhibitory neurons degenerate before motor neurons and excitatory neurons in a mouse model of ALS

Roser Montañana-Rosell et al. Sci Adv. .

Abstract

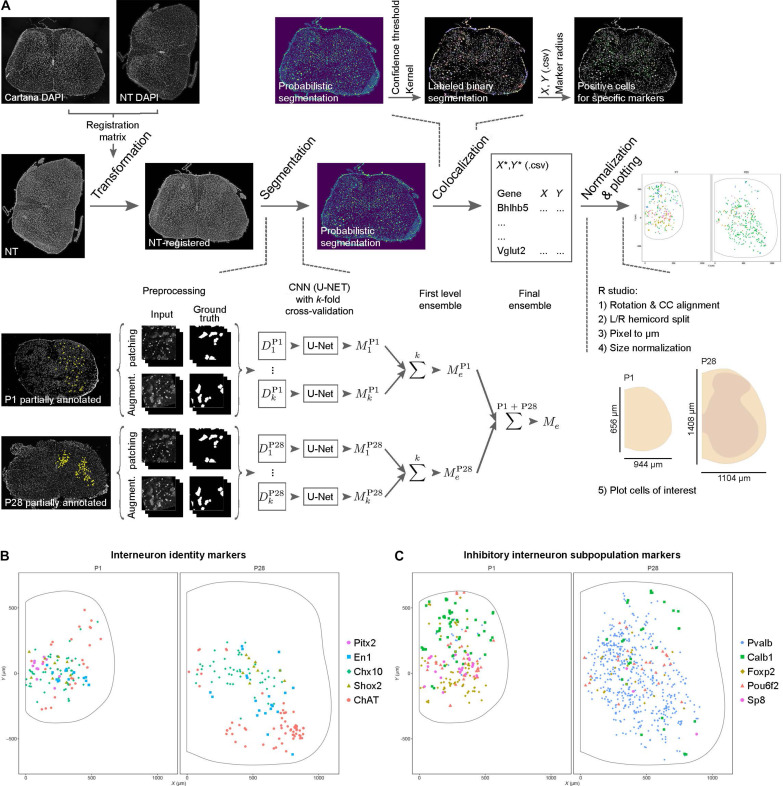
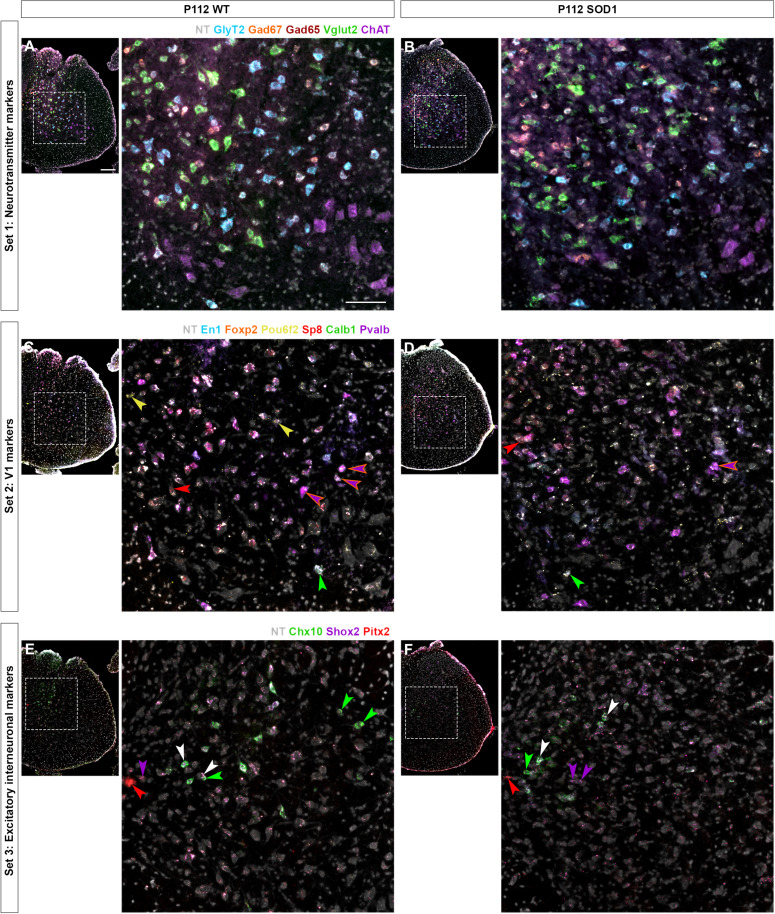
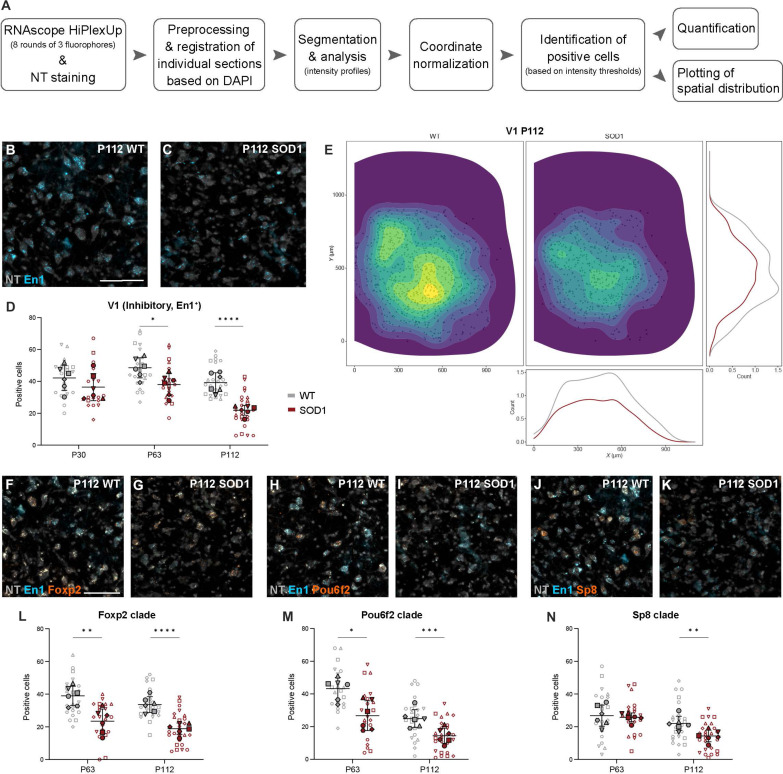
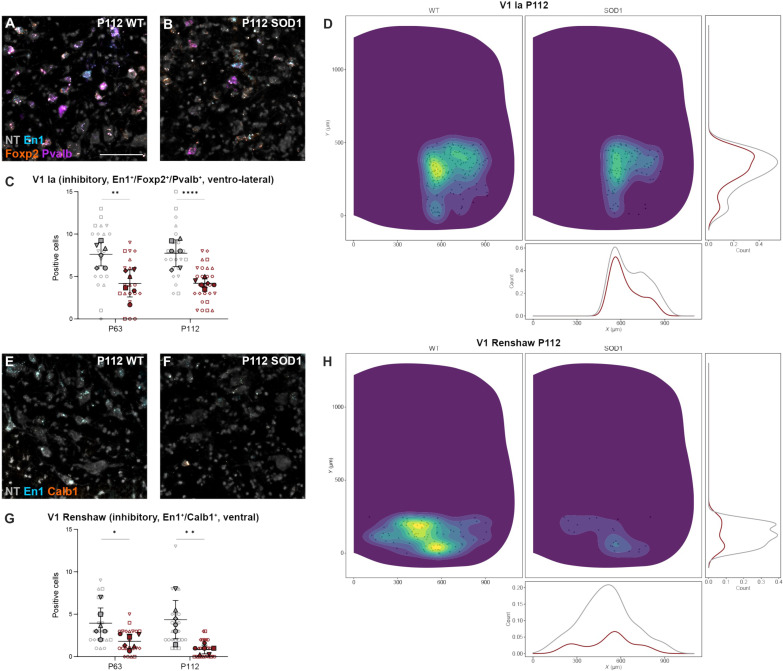
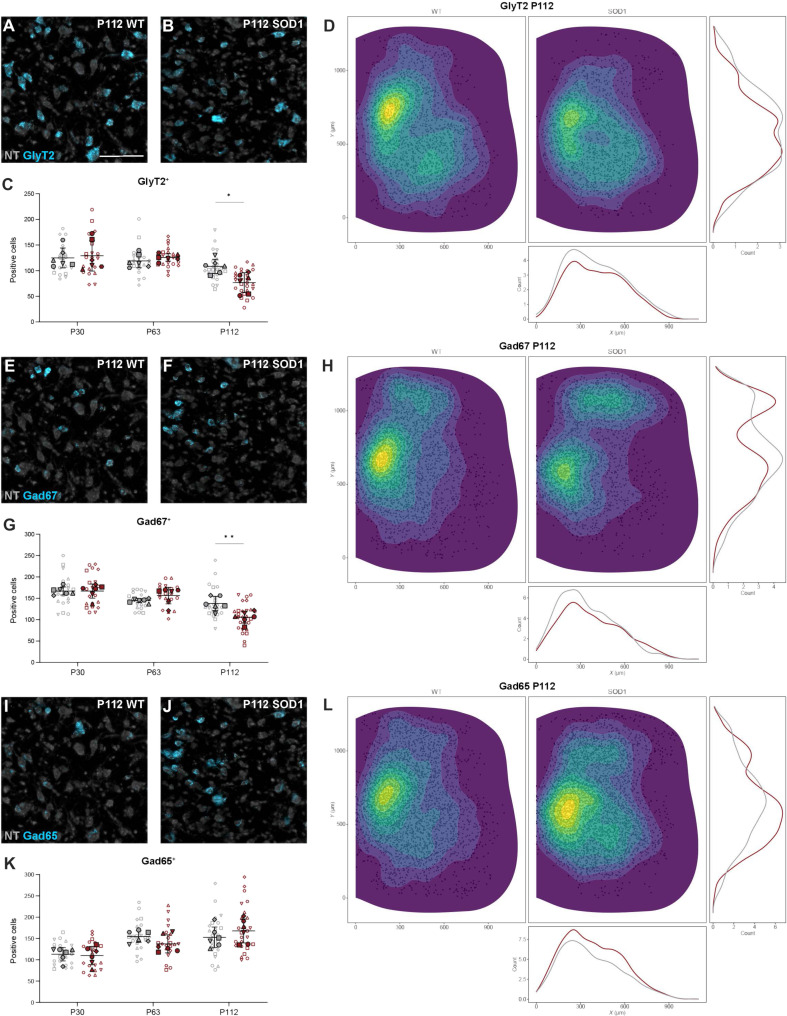
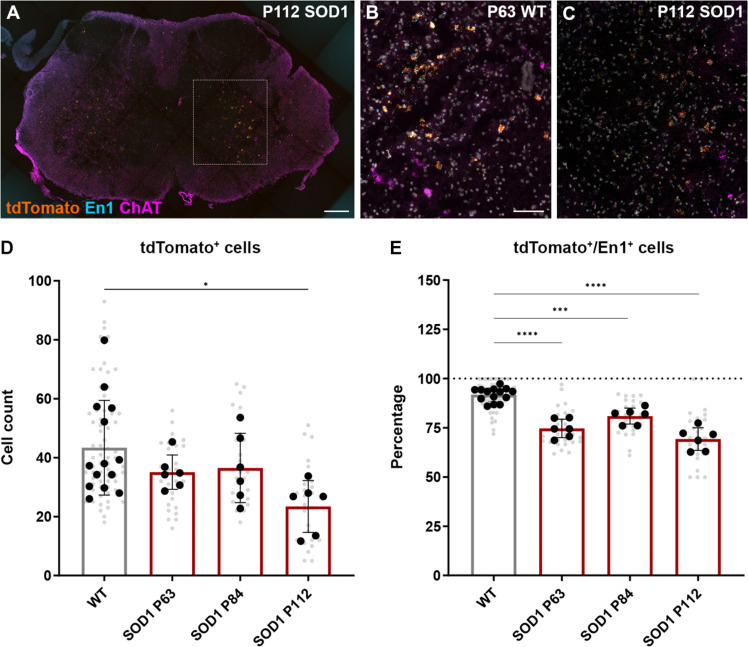
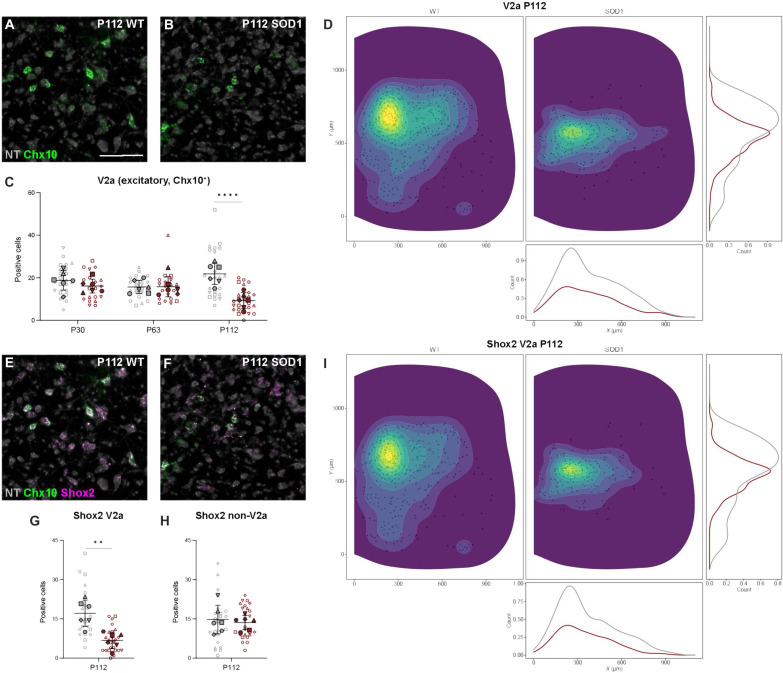
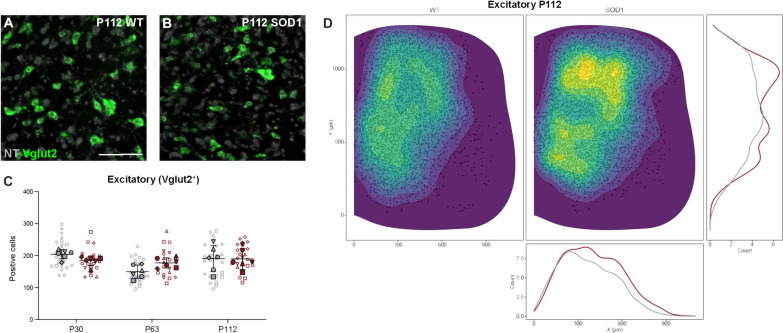
Amyotrophic lateral sclerosis (ALS) is characterized by the progressive loss of somatic motor neurons. A major focus has been directed to motor neuron intrinsic properties as a cause for degeneration, while less attention has been given to the contribution of spinal interneurons. In the present work, we applied multiplexing detection of transcripts and machine learning-based image analysis to investigate the fate of multiple spinal interneuron populations during ALS progression in the SOD1G93A mouse model. The analysis showed that spinal inhibitory interneurons are affected early in the disease, before motor neuron death, and are characterized by a slow progressive degeneration, while excitatory interneurons are affected later with a steep progression. Moreover, we report differential vulnerability within inhibitory and excitatory subpopulations. Our study reveals a strong interneuron involvement in ALS development with interneuron specific degeneration. These observations point to differential involvement of diverse spinal neuronal circuits that eventually may be determining motor neuron degeneration.


Figures

Fig. 1.
Fig. 1.. Interneuronal markers investigated in the present study and their circuitry.
(A) Schematic of the locomotor circuits in the mammalian lumbar spinal cord. Shown are the cardinal ventral interneuron subpopulations (V0D, V0V, V0C, V1, V1 RCs, V1 Ia interneurons, V2a, V2b, and V3) as well as Shox2 and Hb9 interneurons, and their main ipsilateral (solid) or contralateral (dashed) projections. Inhibitory inputs are shown as triangles, and excitatory are shown as circles. (B) Panel of markers detected throughout the study representing the different interneuron populations of interest. Transcript expression of underlined markers was quantified for characterization of interneuron dysregulation in ALS progression.
Fig. 2.
Fig. 2.. Fate-defining markers are present in adult mouse tissue.
(A) Pipeline used for processing and analysis of in situ sequencing data. NeuroTrace (NT) images were acquired and registered to in situ sequencing data based on 4′,6-diamidino-2-phenylindole (DAPI) staining. These were then used for segmentation of neuronal cells using a machine learning deep ensemble model based on the use of U-Net convolutional neural network with k-fold cross-validation, which was applied separately to patches (512 × 512 pixels) of annotated data from P1 (52 annotated patches) and P28 (20 annotated patches) and merged through two ensemble steps to obtain probabilistic segmentation. A confidence threshold and structural kernel were applied to obtain final segmentation, to which in situ sequencing coordinates were registered. Only transcripts that localized to segmented cells were used for final processing in R, where coordinates were normalized and plotted for visualization and qualitative analysis. (B) Validation of identity markers by in situ sequencing technique in wild-type (wt) young adult mouse lumbar spinal cord (P28, right) compared to early postnatal (P1, left), for the interneuron populations included in the study: Pitx2 (pink circle) for V0C/G, En1 (blue square) for V1, Chx10 (green diamond) for V2a, Shox2 (khaki triangle), and choline acetyltransferase (ChAT; salmon circle) for V0C and motor neurons. (C) Validation of markers for inhibitory interneuron subpopulations in adult mouse tissue including parvalbumin (Pvalb; blue circle), Calb1 (green square), Foxp2 (khaki diamond), Pou6f2 (salmon triangle), and Sp8 (pink circle). Data in (B) and (C) are pooled from n = 2 sections from N = 1 mouse for P1, and N = 2 mice for P28.
Fig. 3.
Fig. 3.. Interneuron marker transcript detected by RNAscope HiPlexUp.
Microscopy images obtained by RNAscope HiPlexUp multiplexed in situ hybridization in wt (left) and SOD1G93A mice (right) at P112, including all markers used for characterization of interneuron dysregulation. To facilitate visualization, markers have been divided into three subsets. For each subset and condition, an overview of a full hemisection is shown, together with an inset with higher magnification. (A and B) Subset 1 includes neurotransmitter markers: GlyT2 (blue), Gad67 (orange), Gad65 (deep red), Vglut2 (green), and ChAT (purple). (C and D) Subset 2 includes markers for inhibitory and V1 population: En1 (blue), Foxp2 (orange), Pou6f2 (yellow), Sp8 (red), Calb1 (green), and Pvalb (purple). Arrows point to neurons that are En1+/Pou6f2+ (yellow), En1+/Sp8+ (red), En1+/Calb1+ (green, putative for Renshaw cells), En1+/Foxp2+/Pvalb+ (purple with orange stroke, putative for V1 Ia interneurons). (E and F) Subset 3 includes markers for some excitatory populations: Chx10 (green, for V2a), Shox2 (purple), and Pitx2 (red, for V0C/G). Arrows point to neurons that are Chx10+ (green), Shox2+ (purple), Chx10+/Shox2+ (white), and Pitx2+ (red).
Fig. 4.
Fig. 4.. The V1 interneuron populations are dysregulated in the SOD1G93A mouse.
(A) Analysis workflow. (B and C) Images of HiPlexUp assay showing detection of En1 (blue) and NT (gray) in control (B) and SOD1G93A (C) lumbar spinal cord at P112. (D) Significant reduction in inhibitory (GlyT2+, Gad67+, and/or Gad65+) En1+ neurons in SOD1G93A mice (red) compared to controls (gray) at P63 and P112 (nested unpaired two-tailed t tests; P30 P = 0.2210, P63 P = 0.0318, P112 P < 0.0001). (E) Loss of En1+ neurons in the SOD1G93A mouse (right/red) compared to healthy controls (left/gray), especially in the ventral-most region, at P112. Data were pooled from all P112 sections and shown as individual cells (black dots) with count-based kernel density estimations in two dimensions (main panel), and in X (bottom) and Y dimensions (right). (F to K) HiPlexUp images of En1 (blue) colocalized with V1 subpopulation markers (orange) Foxp2 (E and F), Pou6f2 [(G) and (H)], and Sp8 [(I) and (J)] with NT (gray), in controls and SOD1G93A mice at P112. (L to N) Quantification in SOD1G93A mice versus controls shows significant decrease in Foxp2+ neurons at P63 and P112 (L) (nested unpaired two-tailed t tests; P63 P = 0.0036, P112 P < 0.0001), Pou6f2+ neurons at P63 and P112 (M) (nested unpaired two-tailed t tests; P63 P = 0.0100, P112 P = 0.0007), and Sp8+ neurons at P112 (N) (nested unpaired two-tailed t tests; P63 P = 0.7444, P112 P = 0.0083). Scale bars, 100 μm. 2D kernel densities in (E) were plotted with 10 bins using viridis scale. N = 6 hemicords from three mice (filled shapes, representing biological replicates). Number of hemisections (empty shapes, technical replicates for biological replicate): P30 n(wt) = 22, n(SOD1) = 20; P63 n(wt) = 22, n(SOD1) = 21; P112 n(wt) = 23, n(SOD1) = 26. Data are shown as means ± SD.
Fig. 5.
Fig. 5.. Putative V1 Ia interneurons and Renshaw cells show dysregulation in the SOD1G93A mouse.
(A and B) Colocalization of En1 (blue), Foxp2 (orange), and Pvalb (purple) transcript detected by RNAscope HiPlexUp in situ hybridization in wt (A) and SOD1G93A mice (B) at P112. (C) Significant reduction in inhibitory En1+/Foxp2+/Pvalb+ neurons within the ventrolateral region of the spinal cord, where V1 Ia interneurons are located, in SOD1G93A mice (gray) versus wt (red) at P63 and P112 (nested unpaired two-tailed t tests; P63 P = 0.0498, P112 P = 0.0016). (D) Spatial distribution with count-based kernel density estimations of putative Ia interneurons from pooled P112 spinal cord sections. Data show a decrease in En1+/ Foxp2+/Pvalb+ neurons in the SOD1G93A mouse (right/red) compared to healthy controls (left/gray). (E and F) Colocalization of En1 (blue) and Calb1 (orange) transcript in wt (E) and SOD1G93A spinal cord (F) at P112. (G) Marked loss of inhibitory En1+/Calb1+ neurons located within the ventral spinal cord, where RCs are found, in the SOD1G93A mouse at P63, with exacerbation at P112 (nested unpaired two-tailed t tests; P63 P = 0.0271, P112 P = 0.0046). (H) Spatial distribution of putative RCs (En1+/Calb1+) at P112 with very few cells in the ventral spinal cord of SOD1G93A mice compared to healthy control mice, evidencing the marked reduction in En1+/Calb1+ neurons. Scale bars, 100 μm. NT counterstaining in gray. 2D kernel densities in (D) and (H) were plotted with 10 bins using viridis scale. N = 6 hemicords from three mice (filled). Number of hemisections (empty): P30 n(wt) = 22, n(SOD1) = 20; P63 n(wt) = 22, n(SOD1) = 21; P112 n(wt) = 23, n(SOD1) = 26. Data are shown as means ± SD.
Fig. 6.
Fig. 6.. Inhibitory neurotransmitter markers show late affection in the SOD1G93A mouse.
(A, B, E, F, I, and J) Microscopy images showing detection of transcript (blue) by RNAscope HiPlexUp in situ hybridization in healthy control mice and SOD1G93A mice at P112 for GlyT2 [(A) and (B)], Gad67 [(E) and (F)], and Gad65 [(I) and (J)], with NT counterstaining (gray). (C, G, and K) Quantification of positive cells for the different neurotransmitter markers in SOD1G93A mice (red) versus healthy controls (gray). Data show significant decrease in GlyT2+ neurons at P112 (C) (nested unpaired two-tailed t tests; P30 P = 0.7469, P63 P = 0.3836, P112 P = 0.0121), as well as Gad67+ cells at P112 (G) (nested unpaired two-tailed t tests; P30 P = 0.9172, P63 P = 0.1398, P112 P = 0.0014), but no changes in Gad65+ cells (K) (nested unpaired two-tailed t tests; P30 P = 0.6879, P63 P = 0.2101, P112 P = 0.3431). (D, H, and L) Spatial distribution showing the location and count-based kernel density estimations for GlyT2+ (D), Gad67+ (H), and Gad65+ (L) cells within the spinal cord of healthy control (left/red) and SOD1G93A (right/gray) mice at P112. Scale bars, 100 μm. 2D kernel densities in (D), (H), and (L) were plotted with 10 bins using viridis scale. N = 6 hemicords from three mice (filled). Number of hemisections (empty): P30 n(wt) = 22, n(SOD1) = 20; P63 n(wt) = 22, n(SOD1) = 21; P112 n(wt) = 23, n(SOD1) = 26. Data are shown as means ± SD.
Fig. 7.
Fig. 7.. V1 interneuron fate in the SOD1G93A mouse.
(A) Microscopy image of a P112 SOD1G93A;En1Cre;R26RtdTomato mouse lumbar spinal cord after RNAscope in situ hybridization, showing tdTomato (orange), En1 (blue), and ChAT (violet) transcript. (B and C) Magnification of tdTomato, En1, and ChAT transcript, with DAPI counterstaining (gray), in the intermediate area of the spinal cord of P63 En1Cre;R26RtdTomato healthy control mice (wt) (B) and P112 SOD1G93A;En1Cre;R26RtdTomato (SOD1) (C). (D) Quantification of tdTomato+ cells in healthy controls En1Cre;R26RtdTomato (gray) and SOD1G93A;En1Cre;R26RtdTomato at different time points (red). A significant reduction of tdTomato+ cells is observed in the SOD1G93A group at P112 (nested one-way ANOVA with Dunnett’s post hoc; wt control group, SOD1 P63 P = 0.4608, SOD1 P84 P = 0.6398, SOD1 P112 P = 0.0115). (E) Percentage of tdTomato+ cells that are also positive for the En1 transcript in healthy controls versus the SOD1G93A groups. Expression of En1 transcript is reduced in neurons in the SOD1G93A mice at all time points compared to wt control (nested one-way ANOVA with Dunnett’s post hoc; wt control group, SOD1 P63 P < 0.0001, SOD1 P83 P = 0.0001, SOD1 P112 P < 0.0001). Scale bars, 200 μm (A) and 100 μm [(B) and (C)]. Biological replicates (hemicords) are shown in black, and technical replicates (hemisections) are shown in gray. Sample sizes: wt N = 14 hemicords (from 7 mice), n = 65 hemisections; SOD1 P63 N = 6 hemicords (from three mice), n = 26 hemisections; SOD1 P84 N = 6 hemicords (from three mice), n = 25 hemisections; SOD1 P112 N = 6 hemicords (from three mice), n = 27 hemisections. Data are shown as means ± SD.
Fig. 8.
Fig. 8.. V2a and Shox2+-V2a interneurons are dysregulated at later stages of disease in the SOD1G93A mouse.
(A and B) RNAscope HiPlexUp in situ hybridization microscopy images showing detection of Chx10 transcript (green) in the lumbar spinal cord of healthy control (wt) (A) and SOD1G93A mice (B) at P112. (C) Significant reduction in the number of excitatory (Vglut2+) Chx10+ neurons in SOD1G93A mice (red) compared to healthy control mice (gray) only at P112 (nested unpaired two-tailed t tests; P30 P = 0.1941, P63 P = 0.9150, P112 P < 0.0001). (D) Spatial distribution of excitatory Chx10+ neurons with count-based kernel density estimations in SOD1G93A mice (right/gray) versus healthy control mice (left/red) from pooled P112 sections show the loss of positive cells in the intermediate region of the spinal cord. (E and F) Colocalization of Chx10 (green) and Shox2 (violet) transcript by RNAscope HiPlexUp in wt (E) and SOD1G93A spinal cord (F) at P112. (G and H) Quantification of excitatory Shox2+ neurons in combination with Chx10+ in SOD1G93A mice versus healthy control mice at P112 reveals a steep decrease in Shox2+/Chx10+ neurons (G) but no changes in Shox2+/Chx10 (H) (nested unpaired two-tailed t tests; Shox2+ P = 0.0137, Shox2+/Chx10 P = 0.8914, Shox2+/Chx10+ P = 0013). (I) Spatial distribution of Shox2+/Chx10+ neurons within the spinal cord at P112 in SOD1G93A mice versus healthy control mice shows a similar pattern to that observed for Chx10+ neurons. Scale bars, 100 μm. NT counterstaining in gray. 2D kernel densities in (D) and (I) were plotted with 10 bins using viridis scale. N = 6 hemicords from three mice (filled). Number of hemisections (empty): P30 n(wt) = 22, n(SOD1) = 20; P63 n(wt) = 22, n(SOD1) = 21; P112 n(wt) = 23, n(SOD1) = 26. Data are shown as means ± SD.
Fig. 9.
Fig. 9.. Expression of Vglut2 excitatory transcript shows no changes in the SOD1G93A mouse.
(A and B) Microscopy images after RNAscope HiPlexUp in situ hybridization showing Vglut2 transcript (green) within the lumbar spinal cord of wt (A) and SOD1G93A mice (B) at P112, NT in gray. (C) Quantification of Vglut2+ neurons in SOD1G93A mice versus healthy control mice reveals no changes at any of the tested time points (nested unpaired two-tailed t tests; P30 P = 0.1273, P63 P = 0.0742, P112 P = 0.9225). (D) Spatial distribution of Vglut2+ neurons within the spinal cord in healthy control mice (right/gray) and SOD1G93A mice (left/red) at P112, including count-based kernel density estimations. The apparent higher density observed in the SOD1G93A mouse is an effect of the higher number of sections used in this group. Scale bar, 100 μm. 2D kernel densities in (D) were plotted with 10 bins using viridis scale. N = 6 hemicords from three mice (filled). Number of hemisections (empty): P30 n(wt) = 22, n(SOD1) = 20; P63 n(wt) = 22, n(SOD1) = 21; P112 n(wt) = 23, n(SOD1) = 26. Data are shown as means ± SD.

Similar articles

Cited by

References

    1. Nijssen J., Comley L. H., Hedlund E., Motor neuron vulnerability and resistance in amyotrophic lateral sclerosis. Acta Neuropathol. 133, 863–885 (2017). - PMC - PubMed
    1. Kiehn O., Locomotor circuits in the mammalian spinal cord. Annu. Rev. Neurosci. 29, 279–306 (2006). - PubMed
    1. Kiehn O., Decoding the organization of spinal circuits that control locomotion. Nat. Rev. Neurosci. 17, 224–238 (2016). - PMC - PubMed
    1. Briscoe J., Pierani A., Jessell T. M., Ericson J., A homeodomain protein code specifies progenitor cell identity and neuronal fate in the ventral neural tube. Cell 101, 435–445 (2000). - PubMed
    1. Grillner S., El Manira A., The intrinsic operation of the networks that make us locomote. Curr. Opin. Neurobiol. 31, 244–249 (2015). - PubMed

Substances