. 2024 May 31;10(22):eadm9449.
doi: 10.1126/sciadv.adm9449. Epub 2024 May 31.

The KAT module of the SAGA complex maintains the oncogenic gene expression program in MYCN- amplified neuroblastoma

Affiliations

The KAT module of the SAGA complex maintains the oncogenic gene expression program in MYCN- amplified neuroblastoma

Clare F Malone et al. Sci Adv. .

Abstract

Pediatric cancers are frequently driven by genomic alterations that result in aberrant transcription factor activity. Here, we used functional genomic screens to identify multiple genes within the transcriptional coactivator Spt-Ada-Gcn5-acetyltransferase (SAGA) complex as selective dependencies for MYCN-amplified neuroblastoma, a disease of dysregulated development driven by an aberrant oncogenic transcriptional program. We characterized the DNA recruitment sites of the SAGA complex in neuroblastoma and the consequences of loss of SAGA complex lysine acetyltransferase (KAT) activity on histone acetylation and gene expression. We demonstrate that loss of SAGA complex KAT activity is associated with reduced MYCN binding on chromatin, suppression of MYC/MYCN gene expression programs, and impaired cell cycle progression. Further, we showed that the SAGA complex is pharmacologically targetable in vitro and in vivo with a KAT2A/KAT2B proteolysis targeting chimeric. Our findings expand our understanding of the histone-modifying complexes that maintain the oncogenic transcriptional state in this disease and suggest therapeutic potential for inhibitors of SAGA KAT activity in MYCN-amplified neuroblastoma.


Figures
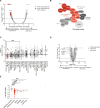
Fig. 1.
Fig. 1.. SAGA complex members are selective dependencies in MYCN-amplified neuroblastoma.
(A) Volcano plot depicting normalized enrichment scores (NESs) calculated for epigenetic complexes found in CORUM. Genetic dependencies for MYCN-amplified neuroblastoma cell lines were compared to all other non-neuroblastoma solid tumor cell lines. SAGA complex is indicated in red, and ATAC complex is indicated in black. Significance is based on −log10(P) of >1.0. (B) The SAGA complex, adapted from Helmlinger and Tora (18). The candidate MYCN-amplified neuroblastoma dependency genes in the KAT and core modules are highlighted in white text. (C) Means + SD of dot plots depicting the ssGSEA dependency z scores for the SAGA complex gene set (18) across lineages. MYCN-amplified and non–MYCN-amplified neuroblastomas are presented as individual lineages. MYCN status for two cells was not determined because of ambiguity in the amplification status and was not included in the subsets. Neuroblastoma includes both the non–MYCN- and MYCN-amplified subsets. Unpaired t test with Welch’s correction, ****P < 0.0001. ns, not significant. (D) Volcano plots depicting the 23Q2 CRISPR (DepMap + Score, Chronos) genome-wide differential dependency for MYCN-amplified neuroblastoma versus all other non-neuroblastoma solid tumor cell lines. The four SAGA genes included in the (24) in vivo validation screen are highlighted red; all other SAGA complex genes are highlighted black. Significance estimated on the basis of the two-class comparison method implemented in DepMap, limma empirical Bayes cutoff; P < 0.01. (E) Log2 fold changes showing sgRNA depletion in tumors versus input for each of the negative controls (including cutting and noncutting sgRNAs; n = 1201), positive controls (n = 85), and individual SAGA complex members (n = 5, each). Each dot represents the average log2 fold change for an individual sgRNA as compared to input. An ordinary one-way analysis of variance (ANOVA) was performed, followed by Dunnett’s multiple comparison test. ****P < 0.0001, ***P = 0.0003, and **P = 0.0088
Fig. 2.
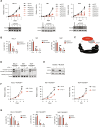
Fig. 2.. TADA2B is a dependency in MYCN-amplified neuroblastoma.
(A) Cell viability analysis showing growth for neuroblastoma cells infected with sgRNAs targeting negative controls (black), TADA2B (red), or the common essential gene POLR1C (dark red). Viability was compared to day 0 of plating. Below, Western blots showing TADA2B expression in sgChr2-2 and TADA2B KOs. GAPDH is included as a loading control. (B) Cell cycle analysis on day 7 for neuroblastoma cells infected with a sgChr2-2 or TADA2B sgRNA. Data are shown as mean with SD for three replicates. Significance was determined by multiple unpaired t tests with Welch correction for grouped analysis. (C) Diagram depicting the utilization of the TADA2B fused to HA-FKBP12K36V model (TADA2Bdeg). (D) Western blot showing HA and TADA2B expression in neuroblastoma cells that express TADA2Bdeg and treated with 500 nM dTAGV-1 for 6 hours. GAPDH serves as a loading control. Par stands for parental nonengineered cells. (E) KELLY-TADA2Bdeg cells were treated with DMSO or 500 nM dTAGV-1 for 6 or 48 hours as indicated, and then histones were extracted. H3K9ac levels are shown. Histone H3 serves as a loading control. (F) Neuroblastoma cells were plated and treated with DMSO or 500 nM dTAGV-1 (1 μM dTAGV-1 for NGP) for 3, 5, or 7 days, and viability was assessed as compared to day 0. (G) Neuroblastoma cells were plated and treated with DMSO or 500 nM dTAGV-1 (1 μM dTAGV-1 for NGP) for 72 hours, and then an EdU and PI incorporation assay was performed. The bar plot depicts the percentage of cells that were in the indicated stage of the cell cycle. Significance was determined using multiple unpaired t tests with Welch correction for grouped analysis. *P < 0.05, **P < 0.01, ***P < 0.001, and ns: P > 0.05.
Fig. 3.
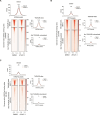
Fig. 3.. TADA2B colocalizes with MYCN, H3K9Ac, H3K27Ac, and open chromatin at promoters of actively transcribed genes.
(A) Heatmaps of ChIP-seq TADA2B peak centric signal on the “core” TADA2B binding regions identified on KELLY, NB1, and NGP cell lines. Regions are ranked on the basis of TADA2B signal on KELLY cells. Read density metaplots show average RPKM normalized signal for TADA2B across the core TADA2B peaks in each of the three cell lines. (B) Pie chart presenting the genomic distribution of the core TADA2B binding regions. (C) Bar plots depicting the percentage of expressed genes among the nearest gene targets for TADA2B core binding regions in a panel of neuroblastoma cell lines. Nearest gene targets for TADA2B core peaks were annotated for hg38 with Homer v4.11. Expressed gene status was estimated as log2(TPM + 1) expression of ≥1 based on the Cancer Cell Line Encyclopedia (CCLE) RNA-seq (DepMap 23Q2) data. (D) Bubble plot summarizing the functional categories enriched in the nearest gene targets for the TADA2B core peaks. GSEA was performed on the MSigDB v7.4 Collections Hallmarks, c2 and c5 (significance: size overlap ≥ 5 and FDR ≤ 0.05). (E) List of top 10 enriched motifs at the promoters of nearest gene targets for the TADA2B core peaks (Homer v4.11, FDR ≤ 1 × 10⁻⁵). (F) Heatmaps depicting the TADA2B, MYCN, H3K27ac, and H3K9ac ChIP-seq and ATAC-seq signal in the TADA2B binding regions identified on KELLY-TADA2Bdeg cells. Read density metaplots show average RPKM-normalized signal for TADA2B, MYCN, H3K27ac, and H3K9ac across the TADA2B peaks and average RPKM-normalized ATAC-seq signal across the TADA2B peaks. (G) Venn diagram showing the overlap of MYCN and TADA2B binding sites as determined by ChIP-seq in KELLY cells.
Fig. 4.
Fig. 4.. Loss of TADA2B results in rapid loss of H3K9ac and MYCN binding at TADA2B-bound sites.
(A) Genome-wide heatmaps of H3K9ac in KELLY-TADA2Bdeg cells treated with DMSO or 500 nM dTAGV-1 for 6 hours. Heatmaps are depicted on the universe of H3K9ac-merged binding sites across all conditions and subdivided on the basis of whether peaks are overlapping with TADA2B binding sites. Each region is ranked on the basis of the binding signal in DMSO. At top, read density metaplots showing average RPKM (reads per kilobase per million) normalized signal for H3K9ac across the universe of binding sites depicted below in DMSO-treated (black) and 500 nM dTAGV-1–treated (red) KELLY-TADA2Bdeg cells. To the right, read density metaplots showing average RPKM-normalized signal for H3K9ac for each of TADA2B-bound and nonbound regions depicted by DMSO-treated (black) and 500 nM dTAGV-1–treated (red) KELLY-TADA2Bdeg cells. Differential read density between DMSO and degrader conditions estimated on the basis of unpaired t test with Welch’s correction. (B) As in (A), for genome-wide heatmaps of MYCN binding in KELLY-TADA2Bdeg cells treated with DMSO or dTAGV-1 for 6 hours. (C) As in (A), for genome-wide heatmaps of H3K27ac in KELLY-TADA2Bdeg cells treated with DMSO or dTAGV-1 for 6 hours. ****P < 0.0001, ***P < 0.001, **P < 0.01, and *P < 0.5.
Fig. 5.
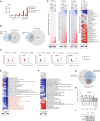
Fig. 5.. TADA2B loss leads to modest gene expression changes.
(A) Bar plots depicting the number of differentially expressed genes induced by TADA2B loss (adjusted P ≤ 0.10, fold change expression ≥ 1.5). (B) Venn diagrams depicting the overlap between differentially expressed genes associated with TADA2B loss by CRISPR KO at 12 days and by degradation at 72 hours. Overlap significance, two-tailed Fisher’s exact test. ****P < 0.0001. (C) Left: Heatmaps showing gene expression alterations induced by TADA2B loss in dTAGV-1 and TADA2B KO experiments. Genes are ranked by expression changes induced by day 12 TADA2B KO. Center and right: Heatmaps for ssGSEA NES for the MSigDB C5, C2, and Hallmarks gene set collections. Hallmark gene set names are annotated. (D) Volcano plots for GSEA enrichment scores for the genome-wide expression changes induced by TADA2B loss in KELLY cells for the MSigDB gene set collection. Gene sets in overrepresented functional categories are highlighted. (E) Heatmap for ssGSEA NESs in the functional categories associated with TADA2B loss under dTAGV-1 versus DMSO and under sgTADA2B versus sgLACZ conditions. Gene set names are annotated. Color scale bars are shown at the bottom. (F) Heatmap for ssGSEA NESs for selected compendia of MYC, MYCN, and neuroblastoma-related gene set signatures associated with TADA2B loss under dTAGV-1 versus DMSO and under sgTADA2B versus sgLACZ conditions. (G) Venn diagrams depicting the overlap between down-regulated MYCN genes and binding of either MYCN or TADA2B as determined by ChIP-seq. Overlap significance, two-tailed Fisher’s exact test, ****P < 0.0001. (H) Bar plots depicting the MYCN expression changes induced by dTAGV-1 versus DMSO and sgTADA2B versus sgLACZ. **DESeq2 adjusted P ≤ 0.01. (I) Western blot depicting HA-TADA2B and MYCN protein levels in KELLY-TADA2Bdeg. GAPDH serves as a loading control.
Fig. 6.
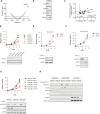
Fig. 6.. KAT2A and KAT2B are functionally redundant in neuroblastoma.
(A) Volcano plot depicting the Pearson correlation between KAT2A dependency and gene expression across all TADA2B-dependent cell lines in the 23Q2 DepMap data. Each dot represents a single gene. Significant t-distribution cutoff P value of ≤0.01. (B) Western blot showing expression of KAT2A, KAT2B, and MYCN. GAPDH is shown as a loading control. (C) Scatter dot plot depicting the linear association between the KAT2A dependency gene effect and the KAT2B gene expression in neuroblastoma. Significance was determined by F test; cutoff P ≤ 0.01. (D) Relative viability is shown on the y axis for NB1 cells infected with sgRNAs targeting control (black) or KAT2A (red). (E) Relative viability NB1-KAT2Adeg cells treated with 1 μM dTAGV-1 or DMSO. Means + SD shown. Below, Western blot depicts exogenous KAT2A protein levels 24 hours after treatment with dTAGV-1 or DMSO as indicated. GAPDH is shown as a loading control. (F) KELLY cells, as in (E). Below, exogenous KAT2A and endogenous KAT2B protein levels are shown 24 hours after treatment with dTAGV-1 as indicated. GAPDH serves as a loading control. (G) Relative viability for KELLY-KAT2Adeg cells expressing sgRNAs targeting Chr2-2 or KAT2B and treated with DMSO or dTAGV-1 as indicated. Means + SD shown. Below, Western blot depicts HA-KAT2A and KAT2B levels in KELLY-KAT2Adeg with or without KAT2B KO and treated with DMSO or 500 nM dTAGV-1 for 24 hours. GAPDH serves as a loading control. (H) KELLY-KAT2Adeg cells were infected with sgRNAs targeting Chr2-2 (cutting control) or KAT2B as indicated and then treated with DMSO or dTAGV-1. A cell fractionation was performed, and exogenous KAT2A, endogenous KAT2B, and H3K9ac levels were assessed. GAPDH, SP1, and histone H3 serve as loading controls for the cytoplasmic, nuclear, and chromatin fractions, respectively.
Fig. 7.
Fig. 7.. KAT2A and KAT2B degradation reduces neuroblastoma growth.
(A to C) Western blot showing expression of KAT2A, KAT2B, MYCN, H3K9ac, or H3K27ac in neuroblastoma cell lines treated for 24 hours with vehicle, GSK-699-1, or GSK-699-2. GAPDH and histone H3 are shown as loading controls. (D to F) Relative viability for neuroblastoma cell lines treated with vehicle, 100 nM GSK-699-1, or 100 nM GSK-699-2. Means and SD are shown. (G to I) Neuroblastoma cell lines were plated and treated with DMSO or 100 nM GSK-699-1 for 72 hours, and then an EdU and PI incorporation assay was performed. The means and SD of three biological replicates are shown. Significance was determined with multiple unpaired t tests with Welch correction for grouped analysis. **P < 0.01 and ***P < 0.001. (J) Western blot showing expression of KAT2A, KAT2B, MYCN, or H3K9ac in KELLY xenograft tumors treated for 5 days with vehicle or GSK-699-1 (5, 10, 50, or 100 mg/kg) by intraperitoneal injection daily. (K) Tumor growth curves showing means + SD of tumor volume for tumors that received at least 18 days of vehicle (n = 5) or GSK-699-1 (50 mg/kg; n = 7) treatment. A two-sided Student’s t test determined significance at each time point. P values are indicated on days 16 and 18. (L) Kaplan-Meier survival curves showing end-point survival as determined by ≥20 mm in any direction or a maximal tumor burden of ~1800 mm3. Eighteen mice were injected with KELLY cells into the subcutaneous flank and randomized into vehicle (n = 9, black) or GSK-699-1 (50 mg/kg ip daily; n = 9, red) cohorts. Mice that were euthanized before tumor end point due to ulceration are indicated with hashes on the curves (two for vehicle and three for GSK-699-1). Significance was determined by log-rank (Mantel-Cox) test.
Fig. 8.
Fig. 8.. Integrated sequencing reveals regulation of SAGA-regulated genes with GSK-699-1.
(A to C) Heatmaps of H3K9ac (A), MYCN (B), or H3K27ac (C) restricted to TADA2B-bound sites in either KELLY-TADA2Bdeg cells treated with DMSO or 500 nM dTAGV-1 for 6 hours (left) or KELLY cells treated with DMSO or 100 nM GSK-699-1 for 6 hours (right). The regions are ranked on the basis of the binding signal in DMSO. At top, read density metaplots showing average RPKM-normalized signal for antibodies across the universe of binding sites depicted below. Differential read density between conditions estimated on the basis of unpaired t test with Welch’s correction. (D) Bar plot depicting the number of differentially expressed genes induced by GSK-699-1 treatment (DESeq2 adjusted P ≤ 0.10, |fold change expression| ≥ 1.5). (E) Volcano plots for GSEA enrichment scores for the genome-wide expression changes induced by GSK-699-1 treatment in KELLY cells. (F) Heatmap for log2 fold change in gene expression across RNA-seq generated for KELLY-TADA2Bdeg and GSK-699-1 datasets. Heatmap is sorted on the basis of the GSK-699-1 72-hour time point and organized on the basis of hierarchical clustering. (G) Integrated heatmap showing RNA expression across experiments and the corresponding enrichment for MYCN by ChIP-seq in vehicle-treated, dTAGV-1–treated (left), or GSK-699-1–treated (right) cells for the MYC/MYCN-related gene signatures. Black bars indicate consensus genes for which there was down-regulation of the gene by RNA-seq and loss of MYCN binding by ChIP-seq. Above, read density metaplots showing average RPKM-normalized signal for MYCN across the universe of binding sites depicted below. Differential read density between conditions estimated on the basis of unpaired t test with Welch’s correction. (H) Venn diagram showing the number of unique and overlapping consensus genes as determined for each treatment in (G). Overlapping genes are indicated. Significance determined by two-tailed Fisher’s exact test, ****P < 0.0001.

References

    1. Filbin M., Monje M., Developmental origins and emerging therapeutic opportunities for childhood cancer. Nat. Med. 25, 367–376 (2019). - PMC - PubMed
    1. Lawlor E. R., Thiele C. J., Epigenetic changes in pediatric solid tumors: Promising new targets. Clin. Cancer Res. 18, 2768–2779 (2012). - PMC - PubMed
    1. Yokoyama A., Somervaille T. C. P., Smith K. S., Rozenblatt-Rosen O., Meyerson M., Cleary M. L., The Menin tumor suppressor protein is an essential oncogenic cofactor for MLL-associated leukemogenesis. Cell 123, 207–218 (2005). - PubMed
    1. Caslini C., Yang Z., El-Osta M., Milne T. A., Slany R. K., Hess J. L., Interaction of MLL amino terminal sequences with Menin is required for transformation. Cancer Res. 67, 7275–7283 (2007). - PMC - PubMed
    1. Chen Y.-X., Yan J., Keeshan K., Tubbs A. T., Wang H., Silva A., Brown E. J., Hess J. L., Pear W. S., Hua X., The tumor suppressor Menin regulates hematopoiesis and myeloid transformation by influencing Hox gene expression. Proc. Natl. Acad. Sci. U.S.A 103, 1018–1023 (2006). - PMC - PubMed

MeSH terms