

Mapping automatic social media information disorder. The role of bots and AI in spreading misleading information in society
- PMID: 38820281
- PMCID: PMC11142451
- DOI: 10.1371/journal.pone.0303183
Mapping automatic social media information disorder. The role of bots and AI in spreading misleading information in society
Abstract
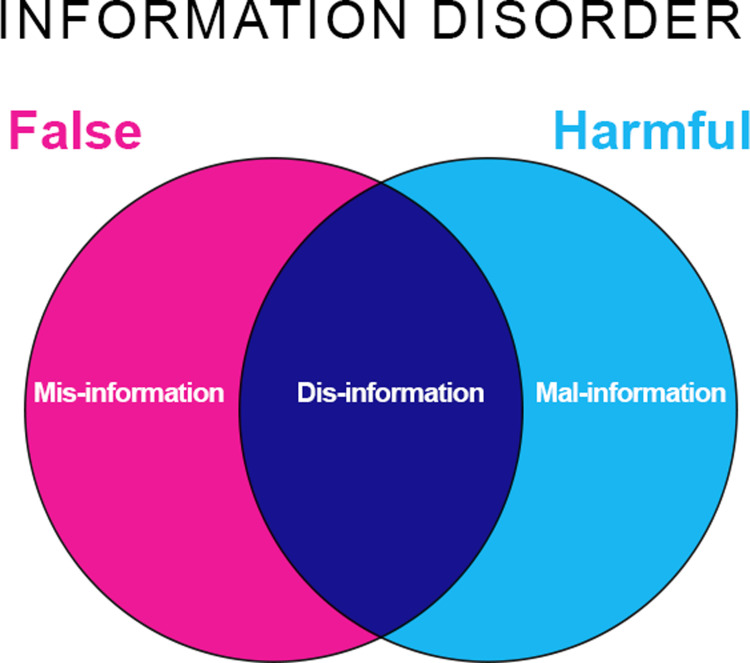
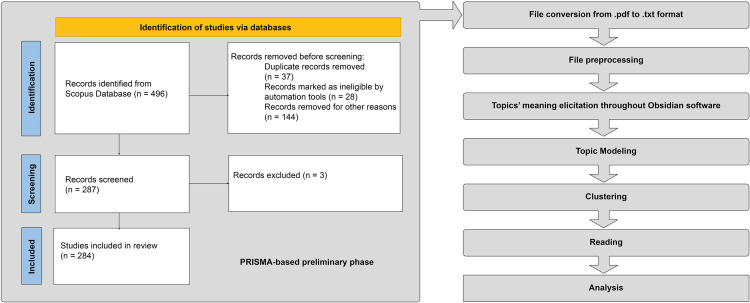
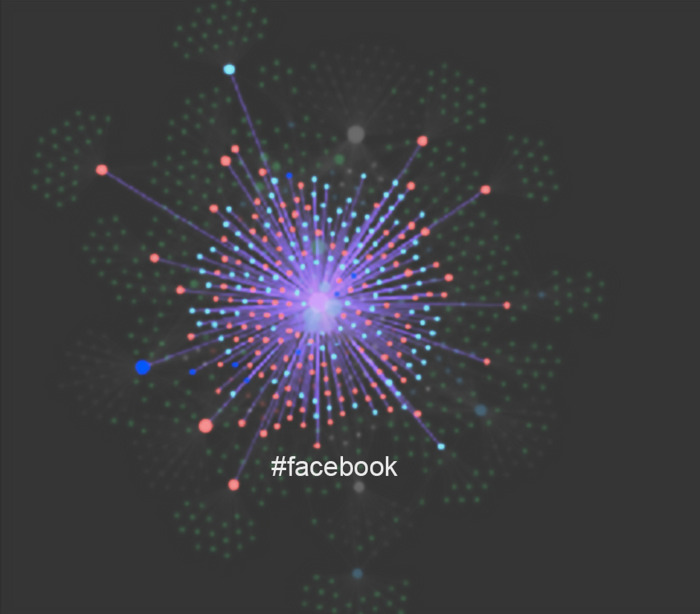
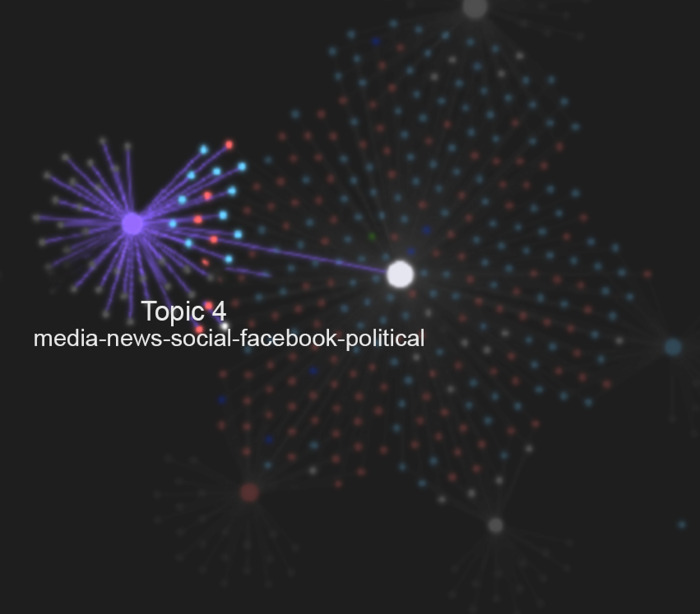
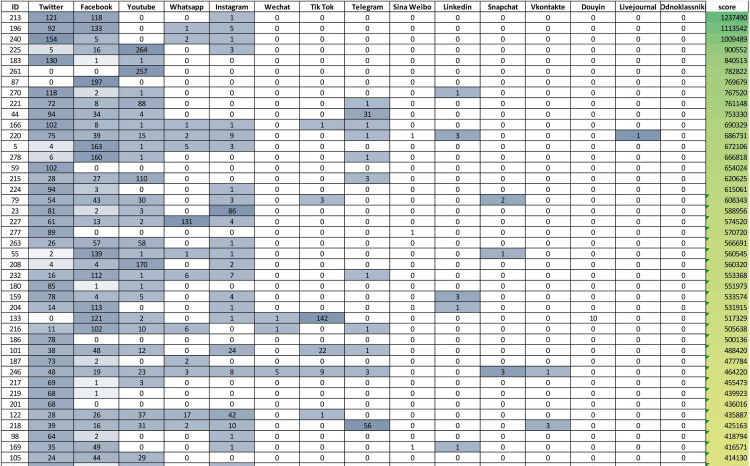
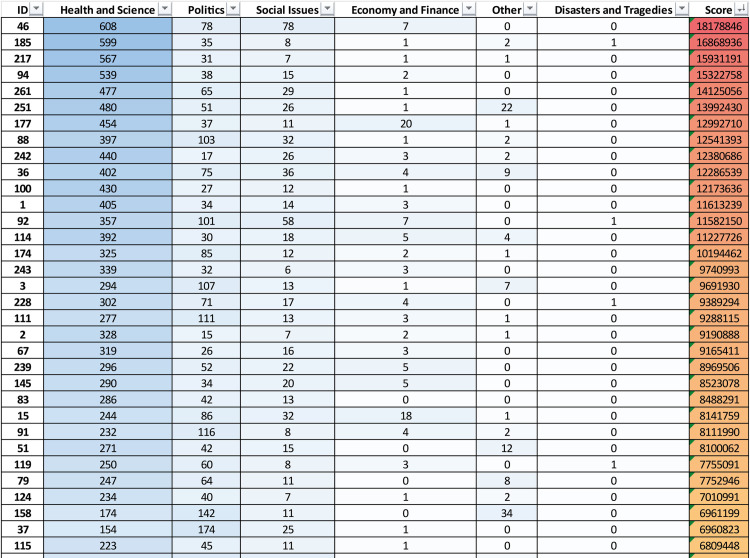
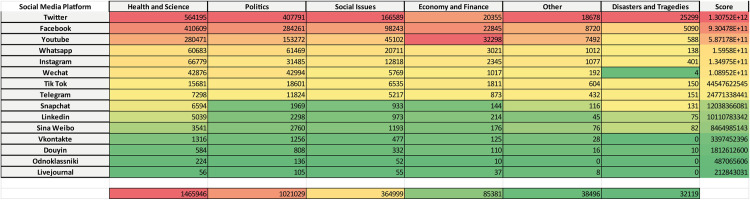
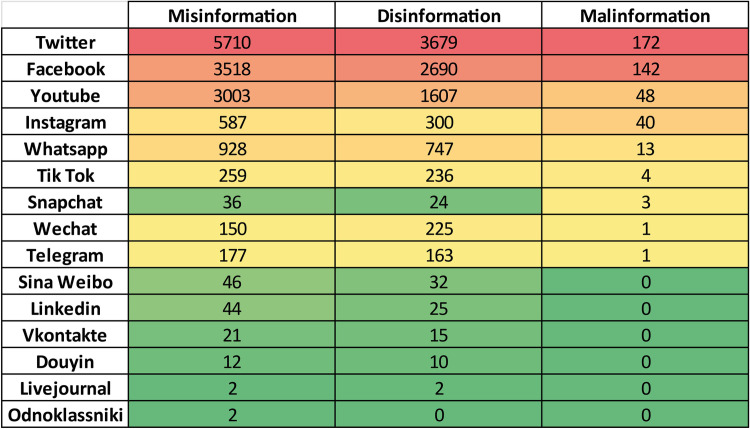
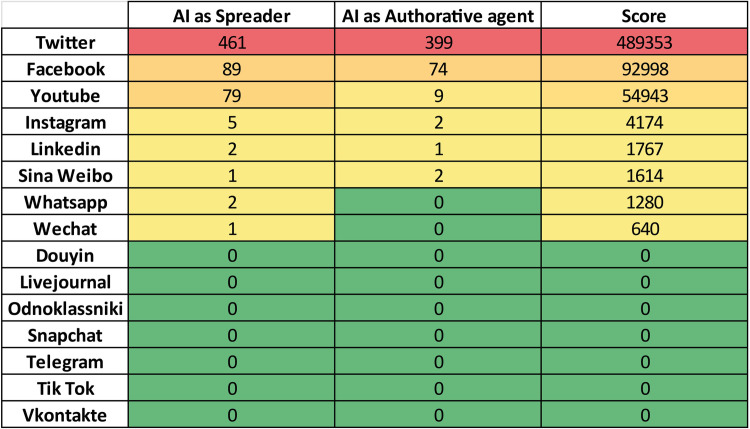
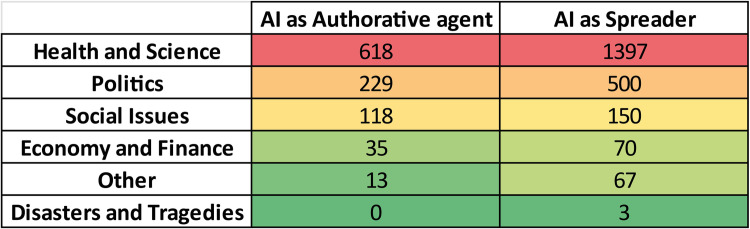
This paper presents an analysis on information disorder in social media platforms. The study employed methods such as Natural Language Processing, Topic Modeling, and Knowledge Graph building to gain new insights into the phenomenon of fake news and its impact on critical thinking and knowledge management. The analysis focused on four research questions: 1) the distribution of misinformation, disinformation, and malinformation across different platforms; 2) recurring themes in fake news and their visibility; 3) the role of artificial intelligence as an authoritative and/or spreader agent; and 4) strategies for combating information disorder. The role of AI was highlighted, both as a tool for fact-checking and building truthiness identification bots, and as a potential amplifier of false narratives. Strategies proposed for combating information disorder include improving digital literacy skills and promoting critical thinking among social media users.
Copyright: © 2024 Tomassi et al. This is an open access article distributed under the terms of the Creative Commons Attribution License, which permits unrestricted use, distribution, and reproduction in any medium, provided the original author and source are credited.
Conflict of interest statement
The authors have declared that no competing interests exist.
Figures
Similar articles
-
Fake news in the age of COVID-19: evolutional and psychobiological considerations.Psychiatriki. 2022 Sep 19;33(3):183-186. doi: 10.22365/jpsych.2022.087. Epub 2022 Jul 19. Psychiatriki. 2022. PMID: 35947862 English, Greek, Modern.
-
Social Media Fact-Checking: The Effects of News Literacy and News Trust on the Intent to Verify Health-Related Information.Healthcare (Basel). 2023 Oct 22;11(20):2796. doi: 10.3390/healthcare11202796. Healthcare (Basel). 2023. PMID: 37893870 Free PMC article.
-
Medical and Health-Related Misinformation on Social Media: Bibliometric Study of the Scientific Literature.J Med Internet Res. 2022 Jan 25;24(1):e28152. doi: 10.2196/28152. J Med Internet Res. 2022. PMID: 34951864 Free PMC article.
-
Psychological factors contributing to the creation and dissemination of fake news among social media users: a systematic review.BMC Psychol. 2024 Nov 18;12(1):673. doi: 10.1186/s40359-024-02129-2. BMC Psychol. 2024. PMID: 39558439 Free PMC article.
-
Cancer misinformation on social media.CA Cancer J Clin. 2024 Sep-Oct;74(5):453-464. doi: 10.3322/caac.21857. Epub 2024 Jun 19. CA Cancer J Clin. 2024. PMID: 38896503 Free PMC article. Review.
Cited by
-
Defining conceptual artefacts to manage and design simplicities in complex adaptive systems.Heliyon. 2024 Dec 9;10(24):e41033. doi: 10.1016/j.heliyon.2024.e41033. eCollection 2024 Dec 30. Heliyon. 2024. PMID: 39759376 Free PMC article.
References
-
- Needham A. Word of mouth, youth and their brands. Young Consumers. 2008;9: 60–62. doi: 10.1108/17473610810857327 - DOI
-
- Yavetz G, Aharony N. Social media in government offices: usage and strategies. Aslib Journal of Information Management. 2020;72: 445–462. doi: 10.1108/AJIM-11-2019-0313 - DOI
-
- Zhang XS, Zhang X, Kaparthi P. Combat Information Overload Problem in Social Networks With Intelligent Information-Sharing and Response Mechanisms. IEEE Transactions on Computational Social Systems. 2020;7: 924–939. doi: 10.1109/TCSS.2020.3001093 - DOI
-
- Asamoah DA, Sharda R. What should I believe? Exploring information validity on social network platforms. Journal of Business Research. 2021;122: 567–581. doi: 10.1016/j.jbusres.2020.09.019 - DOI
-
- Zhang W, Lu J, Huang Y. Research on the Dissemination of Public Opinion on the Internet Based on the News Channels. 2021 18th International Computer Conference on Wavelet Active Media Technology and Information Processing (ICCWAMTIP). 2021. pp. 485–488. doi: 10.1109/ICCWAMTIP53232.2021.9674111 - DOI
MeSH terms
LinkOut - more resources
Full Text Sources
