

Application of a transparent artificial intelligence algorithm for US adults in the obese category of weight
- PMID: 38820332
- PMCID: PMC11142543
- DOI: 10.1371/journal.pone.0304509
Application of a transparent artificial intelligence algorithm for US adults in the obese category of weight
Abstract
Objective and aims: Identification of associations between the obese category of weight in the general US population will continue to advance our understanding of the condition and allow clinicians, providers, communities, families, and individuals make more informed decisions. This study aims to improve the prediction of the obese category of weight and investigate its relationships with factors, ultimately contributing to healthier lifestyle choices and timely management of obesity.
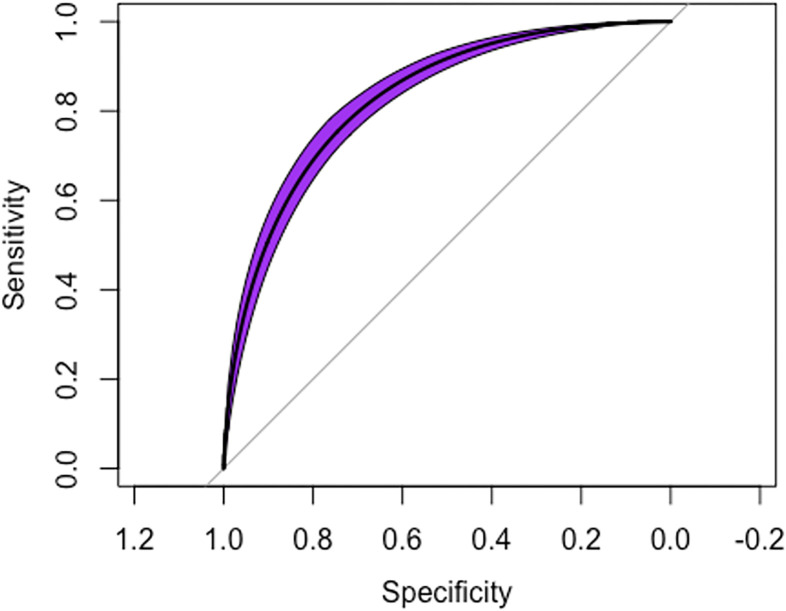
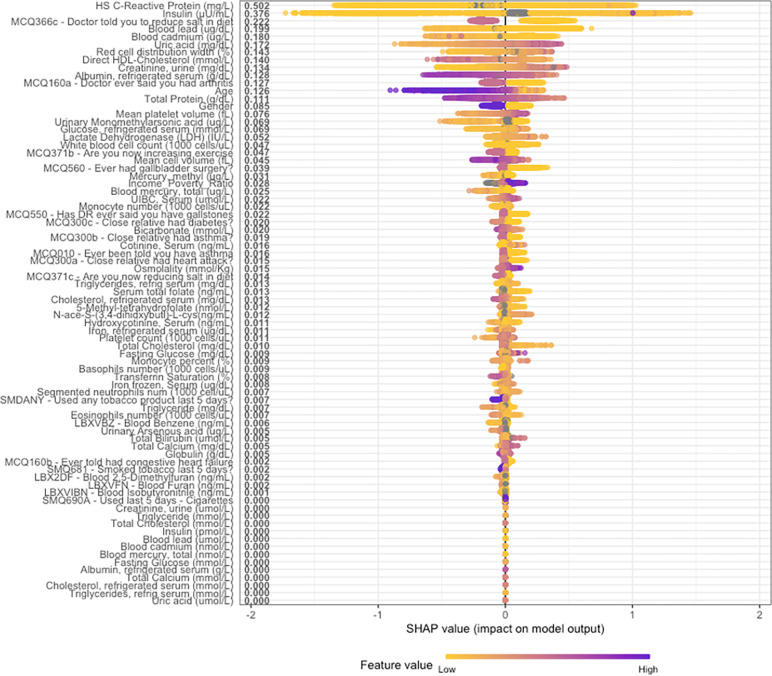
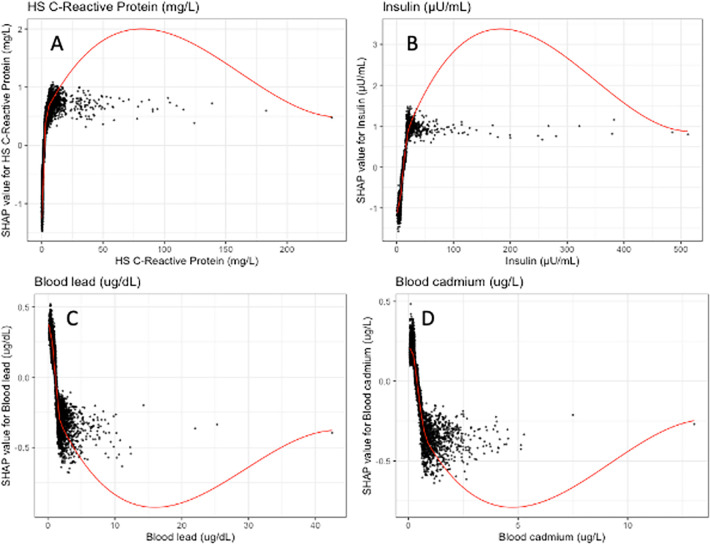
Methods: Questionnaires that included demographic, dietary, exercise and health information from the US National Health and Nutrition Examination Survey (NHANES 2017-2020) were utilized with BMI 30 or higher defined as obesity. A machine learning model, XGBoost predicted the obese category of weight and Shapely Additive Explanations (SHAP) visualized the various covariates and their feature importance. Model statistics including Area under the receiver operator curve (AUROC), sensitivity, specificity, positive predictive value, negative predictive value and feature properties such as gain, cover, and frequency were measured. SHAP explanations were created for transparent and interpretable analysis.
Results: There were 6,146 adults (age > 18) that were included in the study with average age 58.39 (SD = 12.94) and 3122 (51%) females. The machine learning model had an Area under the receiver operator curve of 0.8295. The top four covariates include waist circumference (gain = 0.185), GGT (gain = 0.101), platelet count (gain = 0.059), AST (gain = 0.057), weight (gain = 0.049), HDL cholesterol (gain = 0.032), and ferritin (gain = 0.034).
Conclusion: In conclusion, the utilization of machine learning models proves to be highly effective in accurately predicting the obese category of weight. By considering various factors such as demographic information, laboratory results, physical examination findings, and lifestyle factors, these models successfully identify crucial risk factors associated with the obese category of weight.
Copyright: © 2024 Huang, Huang. This is an open access article distributed under the terms of the Creative Commons Attribution License, which permits unrestricted use, distribution, and reproduction in any medium, provided the original author and source are credited.
Conflict of interest statement
The authors have declared that no competing interests exist.
Figures
Similar articles
-
The Visualization of the Importance of Covariance Importance in a Machine Learning Model for Advanced Liver Fibrosis in a Nationally Representative Sample.JGH Open. 2025 Jul 14;9(7):e70200. doi: 10.1002/jgh3.70200. eCollection 2025 Jul. JGH Open. 2025. PMID: 40666191 Free PMC article.
-
Use of machine learning to identify risk factors for insomnia.PLoS One. 2023 Apr 12;18(4):e0282622. doi: 10.1371/journal.pone.0282622. eCollection 2023. PLoS One. 2023. PMID: 37043435 Free PMC article.
-
Use of machine learning to identify risk factors for coronary artery disease.PLoS One. 2023 Apr 14;18(4):e0284103. doi: 10.1371/journal.pone.0284103. eCollection 2023. PLoS One. 2023. PMID: 37058460 Free PMC article.
-
Identifying individuals at risk for weight gain using machine learning in electronic medical records from the United States.Diabetes Obes Metab. 2025 Jun;27(6):3061-3071. doi: 10.1111/dom.16311. Epub 2025 Mar 11. Diabetes Obes Metab. 2025. PMID: 40069847 Free PMC article.
-
Offspring body size and metabolic profile - effects of lifestyle intervention in obese pregnant women.Dan Med J. 2014 Jul;61(7):B4893. Dan Med J. 2014. PMID: 25123127 Review.
Cited by
-
Artificial intelligence to improve cardiovascular population health.Eur Heart J. 2025 May 21;46(20):1907-1916. doi: 10.1093/eurheartj/ehaf125. Eur Heart J. 2025. PMID: 40106837 Free PMC article. Review.
References
-
- Jordan K, Fawsitt CG, Carty PG, Clyne B, Teljeur C, Harrington P, et al.. Cost-effectiveness of metabolic surgery for the treatment of type 2 diabetes and obesity: a systematic review of economic evaluations. Eur J Health Econ. 2023;24(4):575–90. Epub 20220722. doi: 10.1007/s10198-022-01494-2 ; PubMed Central PMCID: PMC10175448. - DOI - PMC - PubMed
MeSH terms
LinkOut - more resources
Full Text Sources
Medical
Miscellaneous
