. 2024 May 31;20(5):e1011453.
doi: 10.1371/journal.ppat.1011453. eCollection 2024 May.

Pseudomonas aeruginosa senses and responds to epithelial potassium flux via Kdp operon to promote biofilm

Affiliations

Pseudomonas aeruginosa senses and responds to epithelial potassium flux via Kdp operon to promote biofilm

Glenn J Rapsinski et al. PLoS Pathog. .

Abstract

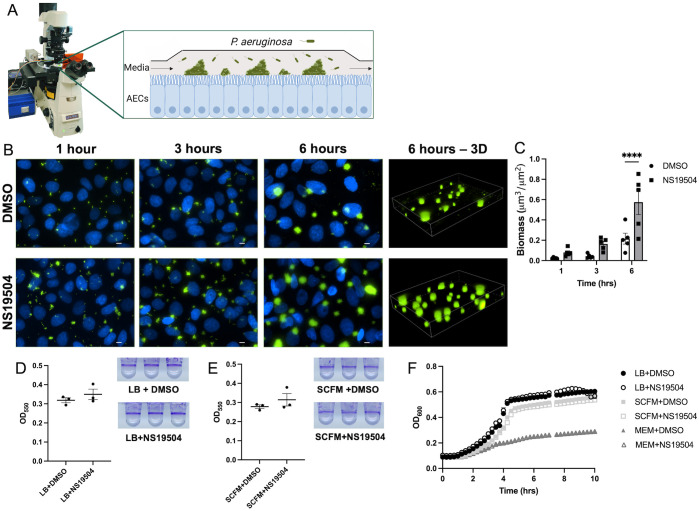
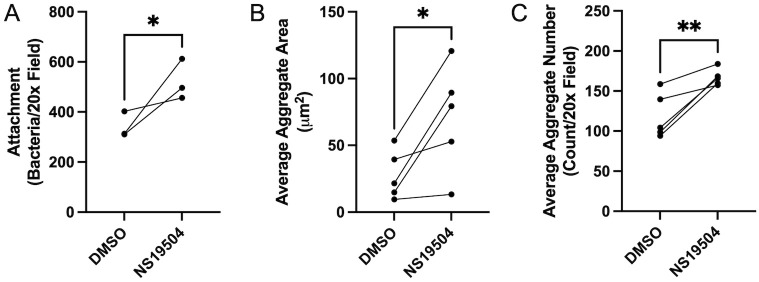
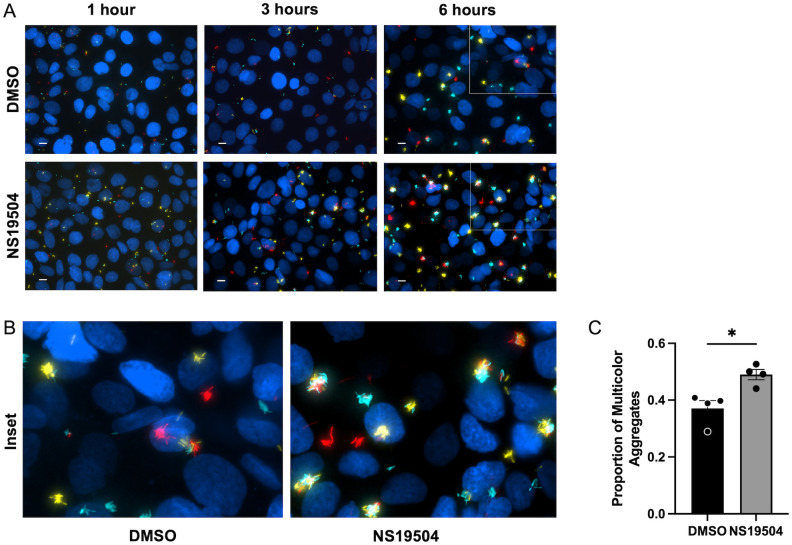
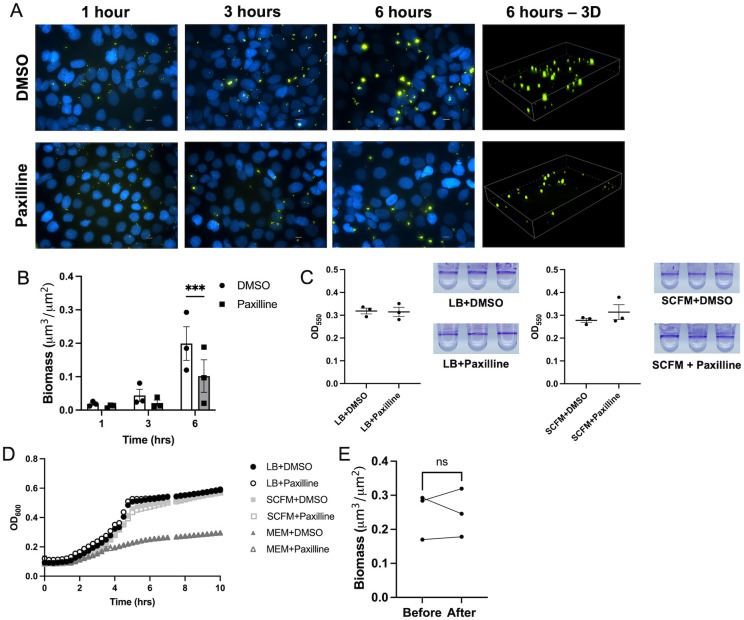
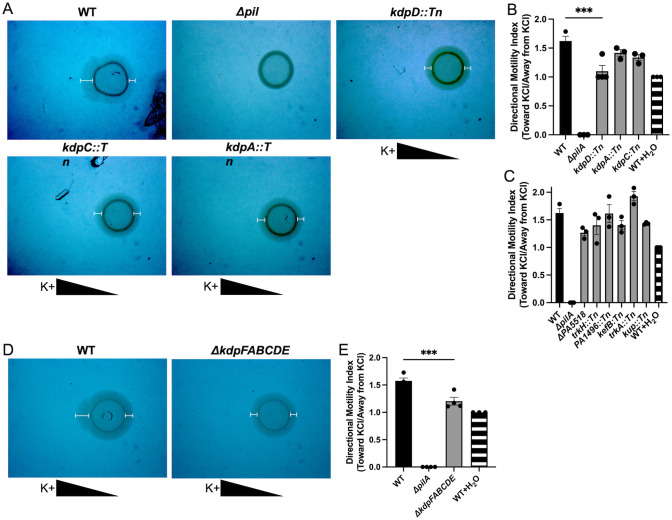
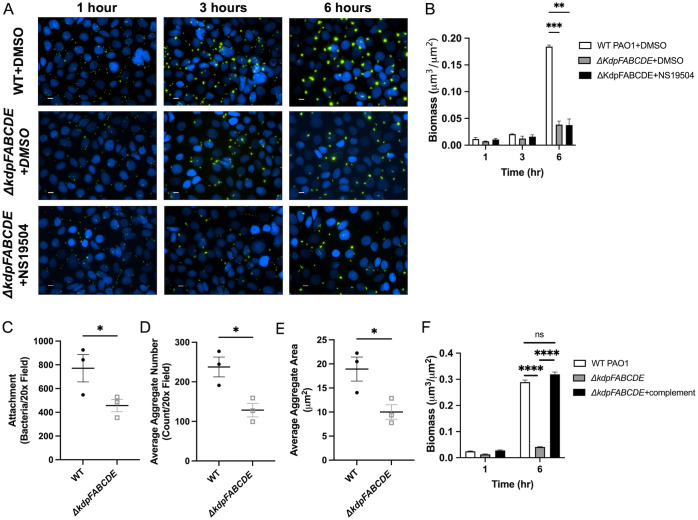
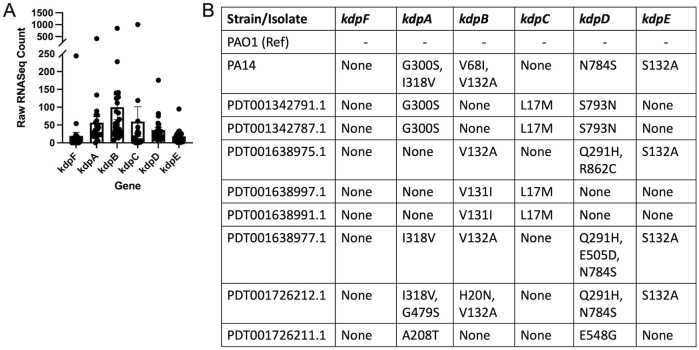
Mucosa-associated biofilms are associated with many human disease states, but the host mechanisms promoting biofilm remain unclear. In chronic respiratory diseases like cystic fibrosis (CF), Pseudomonas aeruginosa establishes chronic infection through biofilm formation. P. aeruginosa can be attracted to interspecies biofilms through potassium currents emanating from the biofilms. We hypothesized that P. aeruginosa could, similarly, sense and respond to the potassium efflux from human airway epithelial cells (AECs) to promote biofilm. Using respiratory epithelial co-culture biofilm imaging assays of P. aeruginosa grown in association with CF bronchial epithelial cells (CFBE41o-), we found that P. aeruginosa biofilm was increased by potassium efflux from AECs, as examined by potentiating large conductance potassium channel, BKCa (NS19504) potassium efflux. This phenotype is driven by increased bacterial attachment and increased coalescence of bacteria into aggregates. Conversely, biofilm formation was reduced when AECs were treated with a BKCa blocker (paxilline). Using an agar-based macroscopic chemotaxis assay, we determined that P. aeruginosa chemotaxes toward potassium and screened transposon mutants to discover that disruption of the high-sensitivity potassium transporter, KdpFABC, and the two-component potassium sensing system, KdpDE, reduces P. aeruginosa potassium chemotaxis. In respiratory epithelial co-culture biofilm imaging assays, a KdpFABCDE deficient P. aeruginosa strain demonstrated reduced biofilm growth in association with AECs while maintaining biofilm formation on abiotic surfaces. Furthermore, we determined that the Kdp operon is expressed in vivo in people with CF and the genes are conserved in CF isolates. Collectively, these data suggest that P. aeruginosa biofilm formation can be increased by attracting bacteria to the mucosal surface and enhancing coalescence into microcolonies through aberrant AEC potassium efflux sensed by the KdpFABCDE system. These findings suggest host electrochemical signaling can enhance biofilm, a novel host-pathogen interaction, and potassium flux could be a therapeutic target to prevent chronic infections in diseases with mucosa-associated biofilms, like CF.


Conflict of interest statement

The authors have declared that no competing interests exist.

Figures

Fig 1
Fig 1. P. aeruginosa biofilm formation is enhanced by increased potassium efflux from airway epithelial cells by opening of BKCa channels.
(A) Graphical representation of respiratory epithelial co-culture biofilm assay utilized for all imaging studies. Created with biorender.com. (B) CFBE41o- cells on glass coverslips were infected with GFP-producing P. aeruginosa (green) while stimulated with NS19504 (25 μM), a BKCa channel potentiator, or 0.05% DMSO in MEM without phenol red and imaged by fluorescent microscopy at 1-, 3-, and 6-hours. CFBE41o- cell nuclei are stained with Hoescht33342 (blue). Scale bar represents 10 μm. (C) Biomass (μm3/μm2) measurements at 1-, 3-, and 6-hours post-inoculation from five independent experiments. Line in bar represents mean value and error bars represent standard error of the mean. Statistical significance was tested by two-way ANOVA with multiple comparisons (**** p<0.0001). (D) P. aeruginosa biofilms grown in 96-well plates in LB and (E) SCFM with or without NS19504 measured using crystal violet absorbance at 550 nm. (F) Planktonic growth kinetics of P. aeruginosa grown in LB Lennox broth (LB), minimal essential media (MEM), and synthetic cystic fibrosis sputum media (SCFM) with or without NS19504.
Fig 2
Fig 2. Bacterial attachment, final biofilm size, and final biofilm number are increased by increased potassium efflux.
(A, B, C) Bacterial attachment at 1 hour and average aggregate area and number at 6 hours grown on CFBE41o- cells in co-culture experiments were measured using Nikon Elements. (A) Number of bacteria attached per 20x field for epithelial cells treated with 0.05% DMSO or NS19504 (25 μM) during respiratory epithelial co-culture biofilm experiments at 1 hour. Measurements were completed on three biologic replicates. (B) Average aggregate area per 20x field measured at 6-hour time point for epithelial cells treated with 0.05% DMSO or NS19504 (25 μM) during live-cell co-culture experiments. Measurements were completed on five biologic replicates. (C) Average aggregate number per 20x field measured at 6-hour time point for epithelial cells treated with 0.05% DMSO or NS19504 (25 μM) during live-cell co-culture experiments. Measurements were completed on five biologic replicates. Line connecting data points indicates data points from same biologic replicate. Statistical significance was tested by unpaired t-test (* p<0.05, ** p<0.01) for all panels.
Fig 3
Fig 3. Bacterial coalescence into biofilms is increased by epithelial potassium efflux.
(A and B) CFBE41o- cells on glass coverslips are infected with a 1:1:1 mixture of TFP-, YFP-, and tdTomato-producing P. aeruginosa while treated with NS19504 (25 μM) or 0.05% DMSO in respiratory epithelial co-culture biofilm assay and imaged by fluorescent microscopy at 1-, 3-, and 6-hours post-infection. (A) Representative images of bacterial coalescence at 1-, 3-, and 6-hours growth. Scale bar represents 10 μm. White box indicates area of magnification in panel B. (B) Magnification of one quarter of panel A images demonstrating multicolor aggregates (polyclonal) compared to single color aggregates (monoclonal). (C) Proportion of colocalized bacteria at 6 hours measured with Nikon Elements Software. Bar represents mean with dots representing each of the four biologic replicates and error bars represent standard error of the mean. Statistical significance was determined by unpaired t-test (* p<0.05).
Fig 4
Fig 4. P. aeruginosa biofilm formation is decreased by reducing potassium efflux from airway epithelial cells through inhibition of BKCa channels.
(A) CFBE41o- cells on glass coverslips were infected with GFP-producing P. aeruginosa (green) while treated with paxilline (10 μM), a BKCa channel inhibitor, or DMSO at 0.05% in MEM without phenol red and imaged by fluorescent microscopy at 1, 3, and 6 hours. CFBE41o- cell nuclei are stained with Hoescht33342 (blue). Scale bar represents 10 μm. (B) Biomass (μm3/μm2) measurements (measured with Nikon Elements Software) at 1-, 3-, and 6-hours post-inoculation from three independent experiments. Line in bar represents mean value and error bars represent standard error of the mean. Statistical significance was tested by two-way ANOVA with multiple comparisons (*** p<0.001). (C) P. aeruginosa biofilms grown in 96-well plates in LB and SCFM with or without paxilline measured using crystal violet absorbance at 550 nm. (D) Planktonic growth kinetics of P. aeruginosa grown in LB Lennox broth (LB), minimal essential media (MEM), and synthetic cystic fibrosis sputum media (SCFM) with or without paxilline. (E) Biomass (μm3/μm2) measurements before and after paxilline treatment. After biofilms were formed and measured on DMSO treated cells for 6 hours, paxilline containing media was introduced for 30 minutes and biofilms were measured. Line represents mean and error bars represent standard error of the mean. Line connecting data points indicates data points from same biologic replicate.
Fig 5
Fig 5. P. aeruginosa chemotaxis toward a potassium gradient is reduced by deletion of kdp genes.
(A) Stereomicroscopy images of macroscopic twitching chemotaxis assay demonstrated WT MPAO1 P. aeruginosa has directional motility towards potassium chloride (KCl) gradient. Transposon mutants in the kdp genes (kdpD, kdpC, kdpA) have reduced directional chemotaxis toward potassium. ΔpilA mutant served as negative control for twitching motility. Triangles below images represent the KCl gradient and white I-lines on images were applied to enhance visualization of twitching motility. (B) Directional motility index measured by the ratio of motility toward the potassium gradient over the motility away from the potassium gradient for the kdp gene transposon mutants tested. WT with water served as negative control for directional chemotaxis. Statistical significance tested by ANOVA (** p<0.01). (C) Directional motility index measured for other potassium related genes in the transposon mutant library and a markerless, in-frame deletion of PA5518. (D) Stereomicroscopy images of macroscopic twitching chemotaxis assay demonstrated WT PAO1 P. aeruginosa has directional motility toward potassium gradient while a strain with a markerless, in-frame deletion of kdpFABCDE has reduced directional motility. Triangles below images represent the KCl gradient and I-lines on images were applied to enhance visualization of twitching motility. (E) Directional motility index of WT PAO1 compared to ΔkdpFABCDE strain. Statistical significance was tested by unpaired t-test (** p<0.01).
Fig 6
Fig 6. KdpFABCDE deficient P. aeruginosa has reduced biofilm formation on AECs.
(A) CFBE41o- cells on glass coverslips were infected with wild type (WT) PAO1 or ΔkdpFABCDE GFP-producing P. aeruginosa, grown with continuous flow of MEM with either DMSO or NS19504 and imaged by fluorescent microscopy at 1-, 3-, and 6-hours. CFBE41o- cell nuclei are stained with Hoescht33342 (blue). Scale bar represents 10 μm. (B) Biomass (μm3/μm2) (measured with Nikon Elements) at 1-, 3-, and 6-hours post-inoculation from four independent experiments. Statistical significance was tested by two-way ANOVA with multiple comparisons (** p<0.01, *** p<0.001). (C-E) Bacterial attachment at 1 hour and average aggregate area and number at 6 hours grown on CFBE41o- cells in live-cell co-culture experiments were measured using Nikon Elements. (C) Number of bacteria attached per 20x field with WT or ΔkdpFABCDE GFP-producing P. aeruginosa during live-cell co-culture experiments at 1 hour. Line represents mean and error bars represent standard error of the mean. (D) Average aggregate area per 20x field measured at 6-hour time point when infected WT or ΔkdpFABCDE GFP-producing P. aeruginosa. Line represents mean and error bars represent standard error of the mean. (E) Average aggregate number per 20x field measured at 6-hour time point with WT or ΔkdpFABCDE GFP-producing P. aeruginosa. Line represents mean of four biologic replicates and error bars represent standard error of the mean. Statistical significance was tested by unpaired t-test (* p<0.05). (F) CFBE41o- cells on glass coverslips were infected with wild type (WT) PAO1, ΔkdpFABCDE, and ΔkdpFABCDE, attTn7::GFP, pJM220-kdpFA, pBBR5pemIK-kdpBC, pJM253-kdpDE (ΔkdpFABCDE+complement) GFP-producing P. aeruginosa, grown with continuous flow of MEM and imaged by fluorescent microscopy at 1- and 6-hours. Biomass (μm3/μm2) (measured with Nikon Elements) at 1- and 6-hours post-inoculation from three independent experiments. Statistical significance was tested by two-way ANOVA with multiple comparisons (**** p<0.0001).
Fig 7
Fig 7. Kdp Genes are expressed in vivo and conserved in clinical P. aeruginosa isolates.
(A) RNAseq data from recently expectorated P. aeruginosa isolates was searched the kdp gene locus tags for RNAseq raw read count measurements. (B) Multisequence alignment was performed on assembled genomes from lab strains PAO1 and PA14, and NCBI Genome database CF clinical isolates. Amino acid substitutions are indicated for each of the genes. Isolates from the NCBI Genomes Database are indicated by their assembly numbers in the database.

Similar articles

Cited by

References

    1. Flemming HC, Wingender J, Szewzyk U, Steinberg P, Rice SA, Kjelleberg S. Biofilms: an emergent form of bacterial life. Nat Rev Microbiol. 2016;14(9):563–75. Epub 2016/08/12. doi: 10.1038/nrmicro.2016.94 . - DOI - PubMed
    1. Costerton JW. Cystic fibrosis pathogenesis and the role of biofilms in persistent infection. Trends in Microbiology. 2001;9(2):50–2. doi: 10.1016/s0966-842x(00)01918-1 - DOI - PubMed
    1. Abdallah M, Benoliel C, Drider D, Dhulster P, Chihib NE. Biofilm formation and persistence on abiotic surfaces in the context of food and medical environments. Arch Microbiol. 2014;196(7):453–72. Epub 2014/04/20. doi: 10.1007/s00203-014-0983-1 . - DOI - PubMed
    1. Kolpen M, Kragh KN, Enciso JB, Faurholt-Jepsen D, Lindegaard B, Egelund GB, et al.. Bacterial biofilms predominate in both acute and chronic human lung infections. Thorax. 2022;77(10):1015–22. Epub 2022/01/13. doi: 10.1136/thoraxjnl-2021-217576 . - DOI - PMC - PubMed
    1. Roberts AE, Kragh KN, Bjarnsholt T, Diggle SP. The Limitations of In Vitro Experimentation in Understanding Biofilms and Chronic Infection. J Mol Biol. 2015;427(23):3646–61. Epub 2015/09/08. doi: 10.1016/j.jmb.2015.09.002 . - DOI - PubMed

MeSH terms