. 2024 Aug 1;144(5):552-564.
doi: 10.1182/blood.2023023528.

Heme-induced loss of renovascular endothelial protein C receptor promotes chronic kidney disease in sickle mice

Affiliations

Heme-induced loss of renovascular endothelial protein C receptor promotes chronic kidney disease in sickle mice

Qiyang Chen et al. Blood. .

Abstract

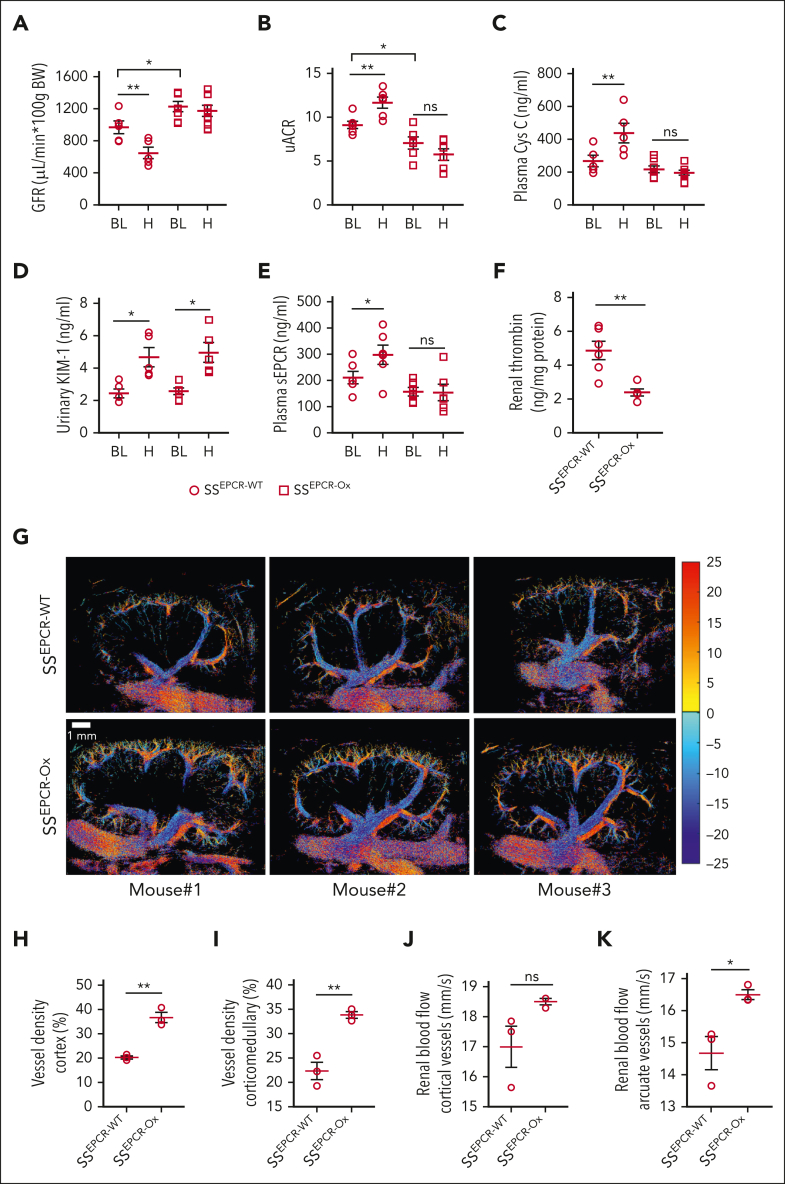
Chronic kidney disease (CKD) is a major contributor to morbidity and mortality in sickle cell disease (SCD). Anemia, induced by chronic persistent hemolysis, is associated with the progressive deterioration of renal health, resulting in CKD. Moreover, patients with SCD experience acute kidney injury (AKI), a risk factor for CKD, often during vaso-occlusive crisis associated with acute intravascular hemolysis. However, the mechanisms of hemolysis-driven pathogenesis of the AKI-to-CKD transition in SCD remain elusive. Here, we investigated the role of increased renovascular rarefaction and the resulting substantial loss of the vascular endothelial protein C receptor (EPCR) in the progressive deterioration of renal function in transgenic SCD mice. Multiple hemolytic events raised circulating levels of soluble EPCR (sEPCR), indicating loss of EPCR from the cell surface. Using bone marrow transplantation and super-resolution ultrasound imaging, we demonstrated that SCD mice overexpressing EPCR were protective against heme-induced CKD development. In a cohort of patients with SCD, plasma sEPCR was significantly higher in individuals with CKD than in those without CKD. This study concludes that multiple hemolytic events may trigger CKD in SCD through the gradual loss of renovascular EPCR. Thus, the restoration of EPCR may be a therapeutic target, and plasma sEPCR can be developed as a prognostic marker for sickle CKD.


Conflict of interest statement

Conflict-of-interest disclosure: S.G. receives research funding (not relevant to the present study) from Pfizer Inc as part of a sponsored research agreement. The remaining authors declare no competing financial interests.

Figures

None
Graphical abstract
Figure 1.
Figure 1.
Progressive renal damage and development of CKD in sickle mice. (A) Townes sickle (SS) mice from different age groups (1-10 months; n = 9; M, 5; F, 4) and older (10 months; n = 9; M, 3; F, 6) control (AA) mice were used to assess GFR noninvasively using a transcutaneous device. An age-dependent decline in GFR was evident with hyperfiltration in younger (1-month) SS mice. (B) Urinary albumin and creatinine were measured in the urine collected from the same cohort of mice as in (A) before GFR measurement, and the ratio (uACR) indicated a significant increase in albuminuria. (C) Plasma Cys C, measured using enzyme-linked immunosorbent assay in the same cohort of mice, was higher in SS mice of all ages than in AA mice. (D) Elevated urinary KIM-1 in the SS mice, with no difference between older AA and 1-month-old SS mice. (E) Representative hematoxylin and eosin images showing an age-dependent increase in renal microvascular congestion (arrows) in SS mice (scale bar = 20 μm). (F) SRU images of the kidneys in a separate cohort of AA (10-month; n = 3; M, 2; F, 1) and SS (1-month [n = 3; M, 2; F, 1] and 10-month [n = 3; M, 2; F, 1]) mice, showing representative overlaid B-mode images. Quantitation of vessel density in the (G) cortex and (H) corticomedullary regions of interest, as described in the supplemental Methods, showing a loss of renal microvasculature in older SS mice (n = 3). (I) Reduced renal blood volume (rBV) in older SS mice compared with age-matched AA mice (n = 3). ∗P < .05; ∗∗P < .01; ∗∗∗P < .001 (1-way analysis of variance (ANOVA) between differentially aged SS mice and unpaired Student t test between 10-month-old AA and SS mice). F, female mice; M, male mice; ns, nonsignificant.
Figure 2.
Figure 2.
Age-dependent loss of EPCR from the renal vascular endothelium in SS mice. (A) Plasma and (B) urine collected from older (10-month) AA mice (n = 5-6; M, 2; F, 3-4) and differentially aged (1-10 months) SS mice (n = 5-6; M, 2; F, 3-4) showing a gradual age-dependent increase in plasma and urinary sEPCR in SS mice. (C) Representative immunofluorescence images showing the loss of EPCR from the renal microvascular endothelium in older SS mice (6 months or 10 months) compared with younger mice (1 or 3 months). CD31 is an endothelial marker (scale bar = 50 μm). (D) The ratio of the staining intensity of EPCR and CD31 was calculated from the older AA mice (10 months; n = 5; M, 2; F, 3) and SS mice of the indicated age (n = 5; M, 2; F, 3 in each age group) using ImageJ software. The EPCR staining intensity gradually diminished with age in the SS mice. ∗P < .05; ∗∗P < .01; ∗∗∗P < .001 (1-way ANOVA between differentially aged SS mice and unpaired Student t test between 10-month-old AA and SS mice).
Figure 3.
Figure 3.
CKD development in sickle mice after repeated hemolytic events. (A) Experimental scheme showing the regimen of repeated low-dose hemin injections, mimicking multiple hemolytic events in SS mice. (B) Kidney function represented by GFR, 1 week after the last hemin challenge in the younger SS mice (4-6 weeks) compared with the vehicle-injected mice (n = 8; M, 4; F, 4). (C-E) Increased albuminuria (represented by uACR), plasma Cys C, and urinary KIM-1 in multiheme-challenged SS mice showing CKD development in younger SS mice. (F) Evans blue extravasation data showing elevated renal endothelial barrier disruption in younger SS mice injected with the multiheme regimen (n = 5-6; M, 2-3; F, 3). (G) Vehicle- and heme-injected SS mice were subjected to SRU imaging 1 week after the last hemin challenge. The reconstructed 2-dimensional, cross-sectional, SRU images of the long-axis mouse kidney showing vessel distribution and the velocity map for the vehicle and hemin-challenged mice (n = 3; M, 2; F, 1). The velocity values were separated into positive (displayed as red in the color map) and negative values (displayed as blue in the color map), representing the blood flow direction toward and away from the US probe to separate the arteries and veins, respectively. Quantitation of (H-I) vessel densities and (J-K) renal blood flow calculated from the SRU data showing loss of vessels and reduced blood flow in the SS mouse kidney after multiheme-induced CKD development. ∗P < .05; ∗∗∗P < .001 (unpaired Student t test).
Figure 4.
Figure 4.
Alterations in the renal microvascular EPCR distribution in SS mice after multiheme-induced CKD. (A) Representative images from immunofluorescence staining indicating a lack of EPCR in the renal endothelium marked with CD31-positive staining. (B) Quantitation of staining intensity (EPCR/CD31 ratio), indicating significant deterioration of renal endothelial EPCR in heme-challenged mice (n = 6; M, 3; F, 3). (C-D) Higher concentrations of EPCR in the plasma (C) and urine (D) detected in the heme-challenged SS mice compared with those challenged with vehicle (n = 8; M, 4; F, 4). (E) Quantitation of thrombin accumulation in SS mouse kidneys after a multiheme challenge (n = 6; M, 3; F, 3). ∗P < .05; ∗∗P < .01 (unpaired Student t test).
Figure 5.
Figure 5.
Preservation of renal health after heme-induced CKD in SCD mice with EPCR overexpression. (A-D) EPCR-WT and EPCR-Ox mice underwent transplantation with SS bone marrow to create sickle chimera mice with normal (SSEPCR-WT) and overexpression (SSEPCR-Ox) of EPCR on the vascular endothelium. The mice were then subjected to a multiheme challenge. GFR was measured, and plasma and urine samples were collected at baseline (BL) and 7 days after the last heme injection (H). Worsening renal function showing (A) reduced GFR and increased (B) uACR, (C) plasma Cys C, and (D) urinary KIM-1 in SSEPCR-WT compared with SSEPCR-Ox mice (n = 5-7; M, 2-3; F, 3-4). (E) Plasma sEPCR at BL and after the multiheme challenge in SSEPCR-WT and SSEPCR-Ox mice (n = 6; M, 3; F, 3). (F) Total thrombin in the kidney tissues harvested from SSEPCR-WT and SSEPCR-Ox mice (n = 5-6; M, 2-3; F, 3). (G) Representative restructured SRU images showing the scarcity of renal vasculature in SSEPCR-WT mice (n = 3; M, 1; F, 2). (H-I) Quantitation of vessel density in SSEPCR-WT and SSEPCR-Ox mice (n = 3). (J-K) Calculated renal blood flow in the indicated sickle bone marrow chimera mice after multiheme challenge (n = 3). (L) Representative stitched images (scale bar = 500 μm) of the whole kidney from the multiheme-challenged SSEPCR-WT and SSEPCR-Ox mice. The indicated areas are digitally enlarged to show corticomedullary congestion (arrowhead). Serial tissue sections stained for smooth muscle actin showing microvessel distribution in the indicated area (scale bar = 100 μm). (M-N) Representative immunofluorescence images (scale bar = 50 μm) and quantitation of the EPCR/CD31 intensity ratio in renal tissue sections from SSEPCR-WT and SSEPCR-Ox mice (n = 3) after heme challenge. ∗P < .05; ∗∗P < .001 (paired and unpaired Student t test).
Figure 5.
Figure 5.
Preservation of renal health after heme-induced CKD in SCD mice with EPCR overexpression. (A-D) EPCR-WT and EPCR-Ox mice underwent transplantation with SS bone marrow to create sickle chimera mice with normal (SSEPCR-WT) and overexpression (SSEPCR-Ox) of EPCR on the vascular endothelium. The mice were then subjected to a multiheme challenge. GFR was measured, and plasma and urine samples were collected at baseline (BL) and 7 days after the last heme injection (H). Worsening renal function showing (A) reduced GFR and increased (B) uACR, (C) plasma Cys C, and (D) urinary KIM-1 in SSEPCR-WT compared with SSEPCR-Ox mice (n = 5-7; M, 2-3; F, 3-4). (E) Plasma sEPCR at BL and after the multiheme challenge in SSEPCR-WT and SSEPCR-Ox mice (n = 6; M, 3; F, 3). (F) Total thrombin in the kidney tissues harvested from SSEPCR-WT and SSEPCR-Ox mice (n = 5-6; M, 2-3; F, 3). (G) Representative restructured SRU images showing the scarcity of renal vasculature in SSEPCR-WT mice (n = 3; M, 1; F, 2). (H-I) Quantitation of vessel density in SSEPCR-WT and SSEPCR-Ox mice (n = 3). (J-K) Calculated renal blood flow in the indicated sickle bone marrow chimera mice after multiheme challenge (n = 3). (L) Representative stitched images (scale bar = 500 μm) of the whole kidney from the multiheme-challenged SSEPCR-WT and SSEPCR-Ox mice. The indicated areas are digitally enlarged to show corticomedullary congestion (arrowhead). Serial tissue sections stained for smooth muscle actin showing microvessel distribution in the indicated area (scale bar = 100 μm). (M-N) Representative immunofluorescence images (scale bar = 50 μm) and quantitation of the EPCR/CD31 intensity ratio in renal tissue sections from SSEPCR-WT and SSEPCR-Ox mice (n = 3) after heme challenge. ∗P < .05; ∗∗P < .001 (paired and unpaired Student t test).
Figure 6.
Figure 6.
Association between plasma sEPCR and CKD in patients with SCD. A cohort of patient samples (N = 35) from the Walk-PHaSST biorepository was subdivided into 2 groups: non-CKD and CKD. eGFR (A), uACR (B), and serum creatinine (C) in the indicated groups of patients with SCD. Level of plasma sEPCR (D) and TPH (E) showing elevated circulating EPCR and heme in the CKD group of patients with SCD. ∗∗P < .01; ∗∗∗P < .001 (unpaired Student t test).

Comment in

Similar articles

Cited by

References

    1. Nath KA, Hebbel RP. Sickle cell disease: renal manifestations and mechanisms. Nat Rev Nephrol. 2015;11(3):161–171. - PMC - PubMed
    1. Saraf SL, Zhang X, Kanias T, et al. Haemoglobinuria is associated with chronic kidney disease and its progression in patients with sickle cell anaemia. Br J Haematol. 2014;164(5):729–739. - PMC - PubMed
    1. Niss O, Lane A, Asnani MR, et al. Progression of albuminuria in patients with sickle cell anemia: a multicenter, longitudinal study. Blood Adv. 2020;4(7):1501–1511. - PMC - PubMed
    1. Derebail VK, Zhou Q, Ciccone EJ, Cai J, Ataga KI. Rapid decline in estimated glomerular filtration rate is common in adults with sickle cell disease and associated with increased mortality. Br J Haematol. 2019;186(6):900–907. - PMC - PubMed
    1. Gosmanova EO, Zaidi S, Wan JY, Adams-Graves PE. Prevalence and progression of chronic kidney disease in adult patients with sickle cell disease. J Investig Med. 2014;62(5):804–807. - PubMed

Publication types

MeSH terms