

Daily variation in blood glucose levels during continuous enteral nutrition in patients on the intensive care unit: a retrospective observational study
- PMID: 38821022
- PMCID: PMC11177052
- DOI: 10.1016/j.ebiom.2024.105169
Daily variation in blood glucose levels during continuous enteral nutrition in patients on the intensive care unit: a retrospective observational study
Abstract
Background: The circadian timing system coordinates daily cycles in physiological functions, including glucose metabolism and insulin sensitivity. Here, the aim was to characterise the 24-h variation in glucose levels in critically ill patients during continuous enteral nutrition after controlling for potential sources of bias.
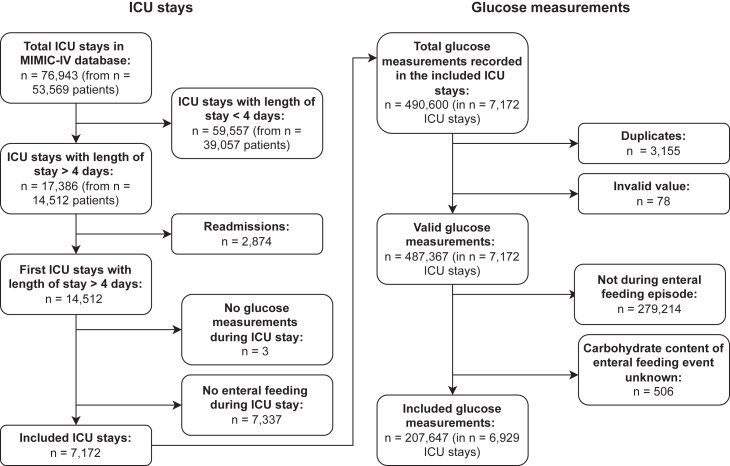
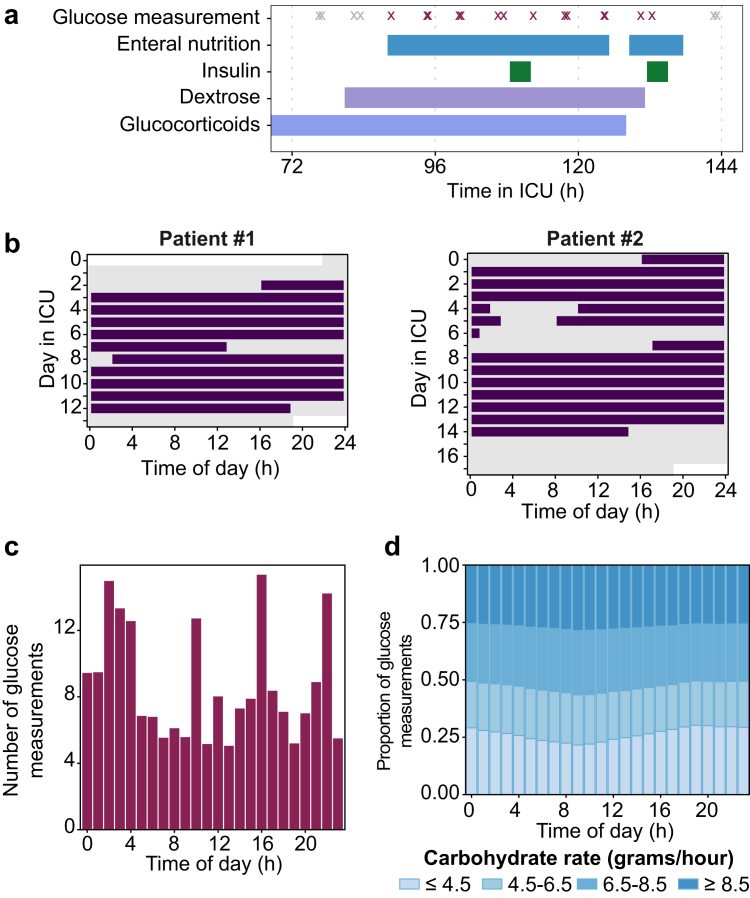
Methods: Time-stamped clinical data from adult patients who stayed in the Intensive Care Unit (ICU) for at least 4 days and received enteral nutrition were extracted from the Medical Information Mart for Intensive Care (MIMIC)-IV database. Linear mixed-effects and XGBoost modelling were used to determine the effect of time of day on blood glucose values.
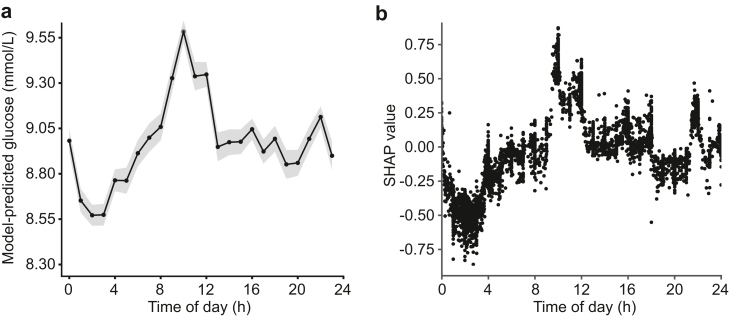
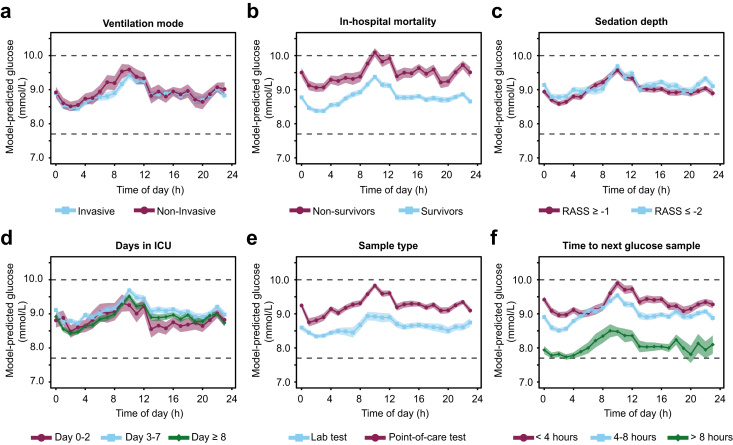
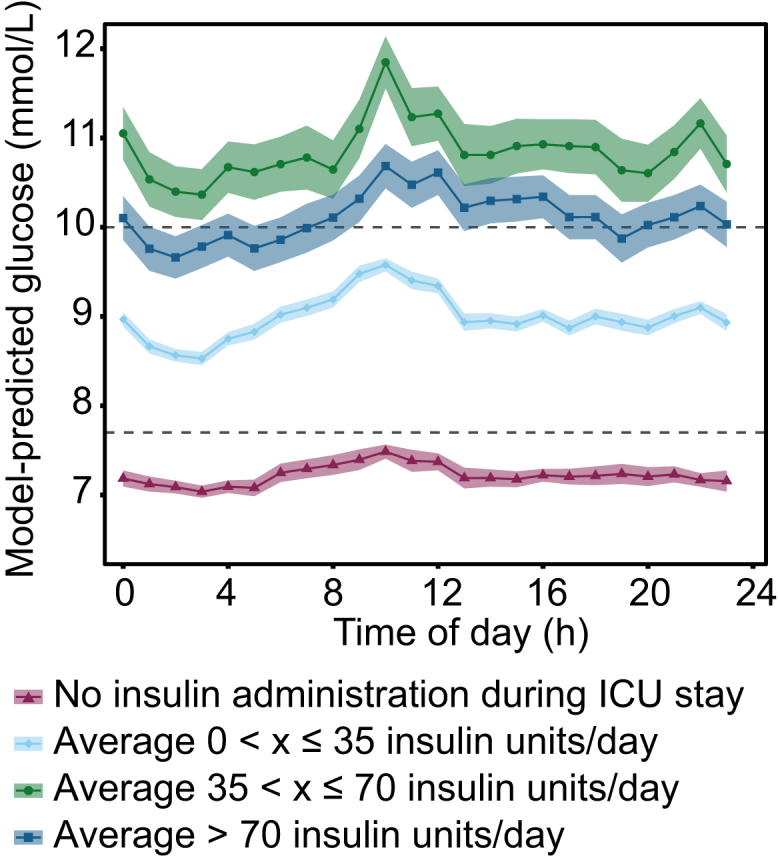
Findings: In total, 207,647 glucose measurements collected during enteral nutrition were available from 6,929 ICU patients (3,948 males and 2,981 females). Using linear mixed-effects modelling, time of day had a significant effect on blood glucose levels (p < 0.001), with a peak of 9.6 [9.5-9.6; estimated marginal means, 95% CI] mmol/L at 10:00 in the morning and a trough of 8.6 [8.5-8.6] mmol/L at 02:00 at night. A similar impact of time of day on glucose levels was found with the XGBoost regression model.
Interpretation: These results revealed marked 24-h variation in glucose levels in ICU patients even during continuous enteral nutrition. This 24-h pattern persists after adjustment for potential sources of bias, suggesting it may be the result of endogenous biological rhythmicity.
Funding: This work was supported by a VENI grant from the Netherlands Organisation for Health Research and Development (ZonMw), an institutional project grant, and by the Dutch Research Council (NWO).
Keywords: Circadian rhythm; Critical illness; Daily variation; Electronic health records; Enteral nutrition; Glucose; Intensive care.
Copyright © 2024 The Authors. Published by Elsevier B.V. All rights reserved.
Conflict of interest statement
Declaration of interests All authors declare no competing interests.
Figures
Similar articles
-
Glycaemic variability and its association with enteral and parenteral nutrition in critically ill ventilated patients.Clin Nutr. 2019 Aug;38(4):1707-1712. doi: 10.1016/j.clnu.2018.08.001. Epub 2018 Aug 16. Clin Nutr. 2019. PMID: 30170779
-
Changes of plasma acetylcholine and inflammatory markers in critically ill patients during early enteral nutrition: A prospective observational study.J Crit Care. 2019 Aug;52:219-226. doi: 10.1016/j.jcrc.2019.05.008. Epub 2019 May 10. J Crit Care. 2019. PMID: 31108325
-
Implementation and evaluation of the SPRINT protocol for tight glycaemic control in critically ill patients: a clinical practice change.Crit Care. 2008;12(2):R49. doi: 10.1186/cc6868. Epub 2008 Apr 16. Crit Care. 2008. PMID: 18412978 Free PMC article.
-
Circadian rhythms, metabolism, and nutrition support in critically ill adult patients: a narrative review.Curr Opin Clin Nutr Metab Care. 2025 Mar 1;28(2):134-139. doi: 10.1097/MCO.0000000000001104. Epub 2024 Dec 23. Curr Opin Clin Nutr Metab Care. 2025. PMID: 39787406 Review.
-
Reducing costs and patient morbidity in the enterally fed intensive care unit patient.JPEN J Parenter Enteral Nutr. 2005 Jan-Feb;29(1 Suppl):S62-9. doi: 10.1177/01486071050290S1S62. JPEN J Parenter Enteral Nutr. 2005. PMID: 15709547 Review.
Cited by
-
Associations between sepsis occurrence, hemoglobin level and mortality in patients with non-trauma hemorrhagic brain injuries: trajectory-based analysis.Eur J Med Res. 2025 Mar 6;30(1):155. doi: 10.1186/s40001-025-02417-6. Eur J Med Res. 2025. PMID: 40051005 Free PMC article.
-
Advancing Chrononutrition for Cardiometabolic Health: A 2023 National Heart, Lung, and Blood Institute Workshop Report.J Am Heart Assoc. 2025 May 6;14(9):e039373. doi: 10.1161/JAHA.124.039373. Epub 2025 Apr 23. J Am Heart Assoc. 2025. PMID: 40265587 Free PMC article. Review.
References
-
- Stenvers D.J., Scheer F., Schrauwen P., la Fleur S.E., Kalsbeek A. Circadian clocks and insulin resistance. Nat Rev Endocrinol. 2019;15(2):75–89. - PubMed
-
- Troisi R.J., Cowie C.C., Harris M.I. Diurnal variation in fasting plasma glucose: implications for diagnosis of diabetes in patients examined in the afternoon. JAMA. 2000;284(24):3157–3159. - PubMed
Publication types
MeSH terms
Substances
LinkOut - more resources
Full Text Sources
Medical
