. 2024 Jul 11;187(14):3585-3601.e22.
doi: 10.1016/j.cell.2024.04.041. Epub 2024 May 30.

A pseudoautosomal glycosylation disorder prompts the revision of dolichol biosynthesis

Affiliations

A pseudoautosomal glycosylation disorder prompts the revision of dolichol biosynthesis

Matthew P Wilson et al. Cell. .

Erratum in

  • A pseudoautosomal glycosylation disorder prompts the revision of dolichol biosynthesis.
    Wilson MP, Kentache T, Althoff CR, Schulz C, de Bettignies G, Cabrera GM, Cimbalistiene L, Burnyte B, Yoon G, Costain G, Vuillaumier-Barrot S, Cheillan D, Rymen D, Rychtarova L, Hansikova H, Bury M, Dewulf JP, Caligiore F, Jaeken J, Cantagrel V, Van Schaftingen E, Matthijs G, Foulquier F, Bommer GT. Wilson MP, et al. Cell. 2024 Jul 11;187(14):3784. doi: 10.1016/j.cell.2024.06.004. Epub 2024 Jun 12. Cell. 2024. PMID: 38870945 Free PMC article. No abstract available.

Abstract

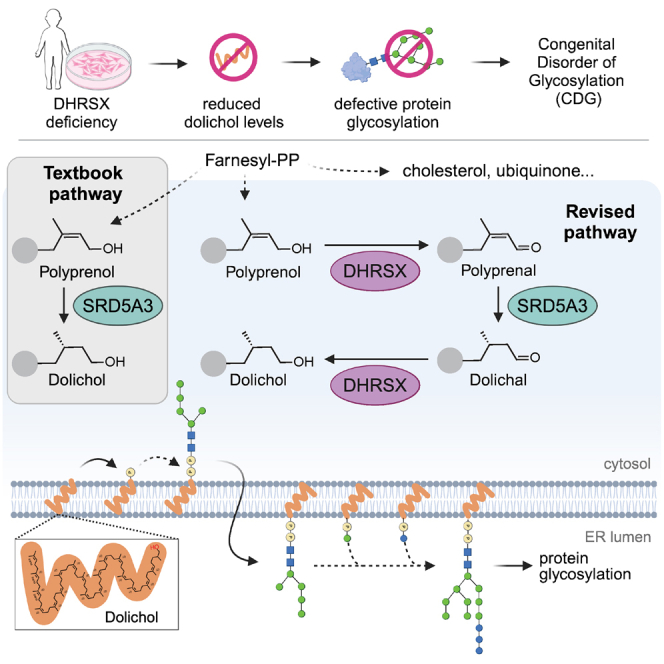
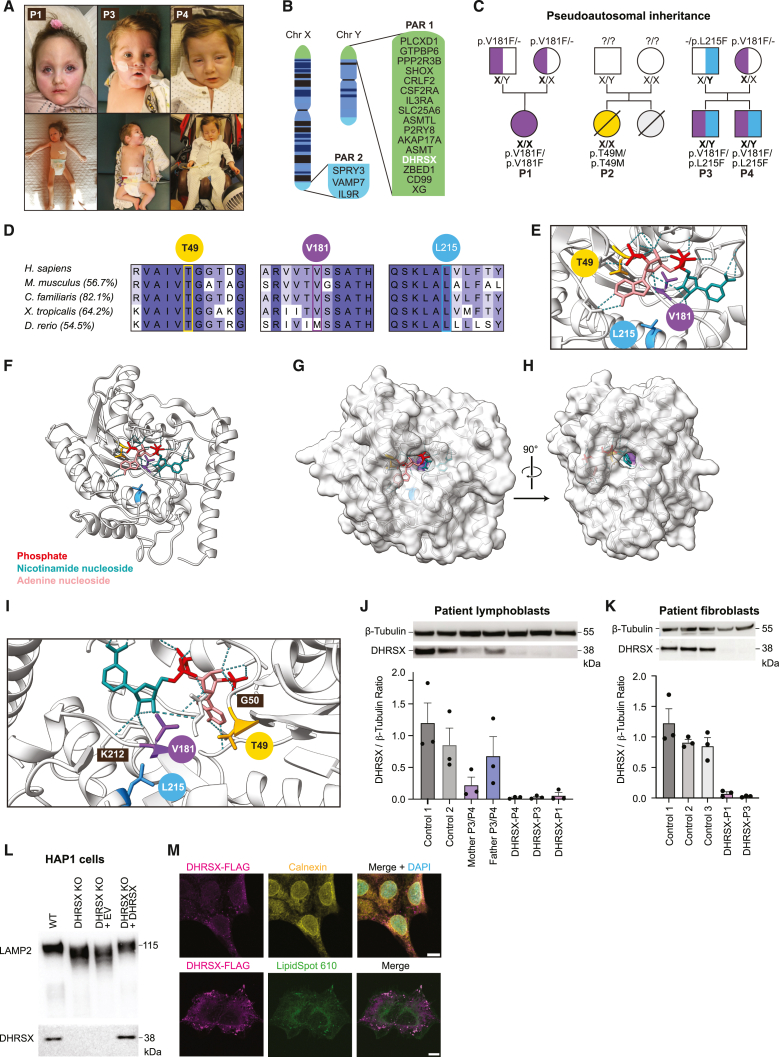
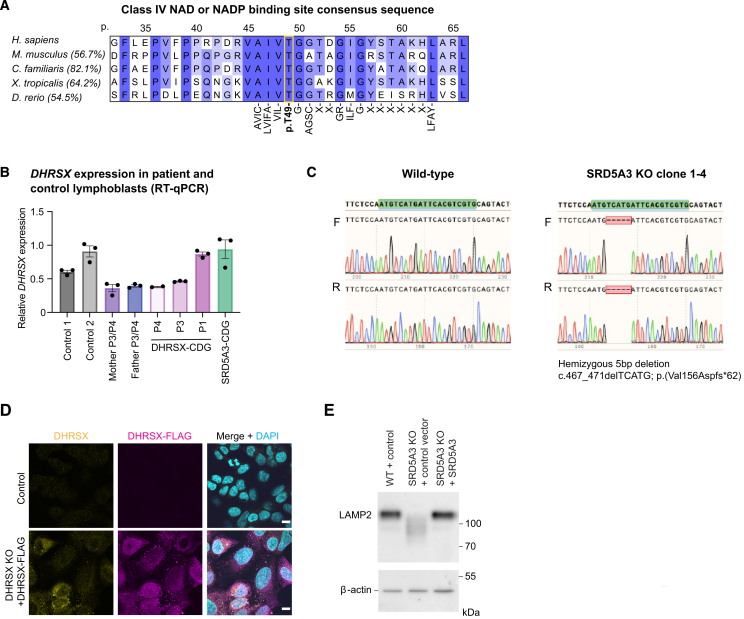
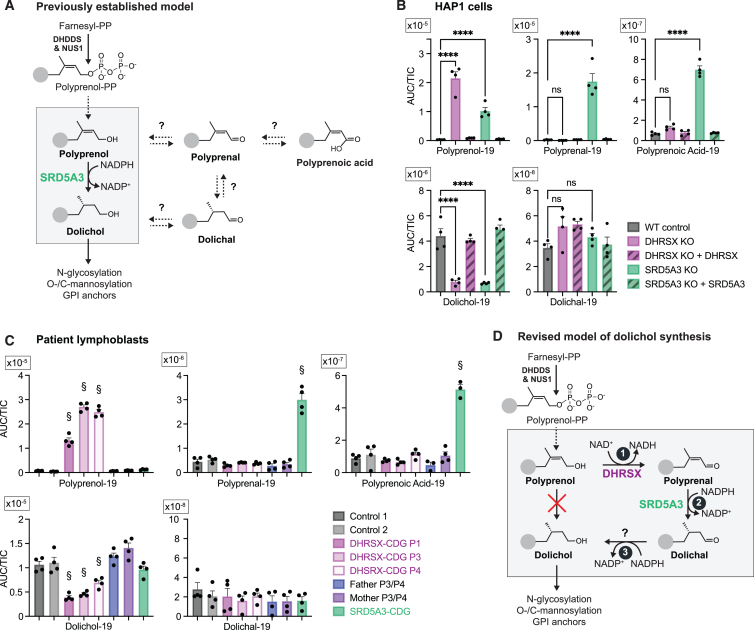
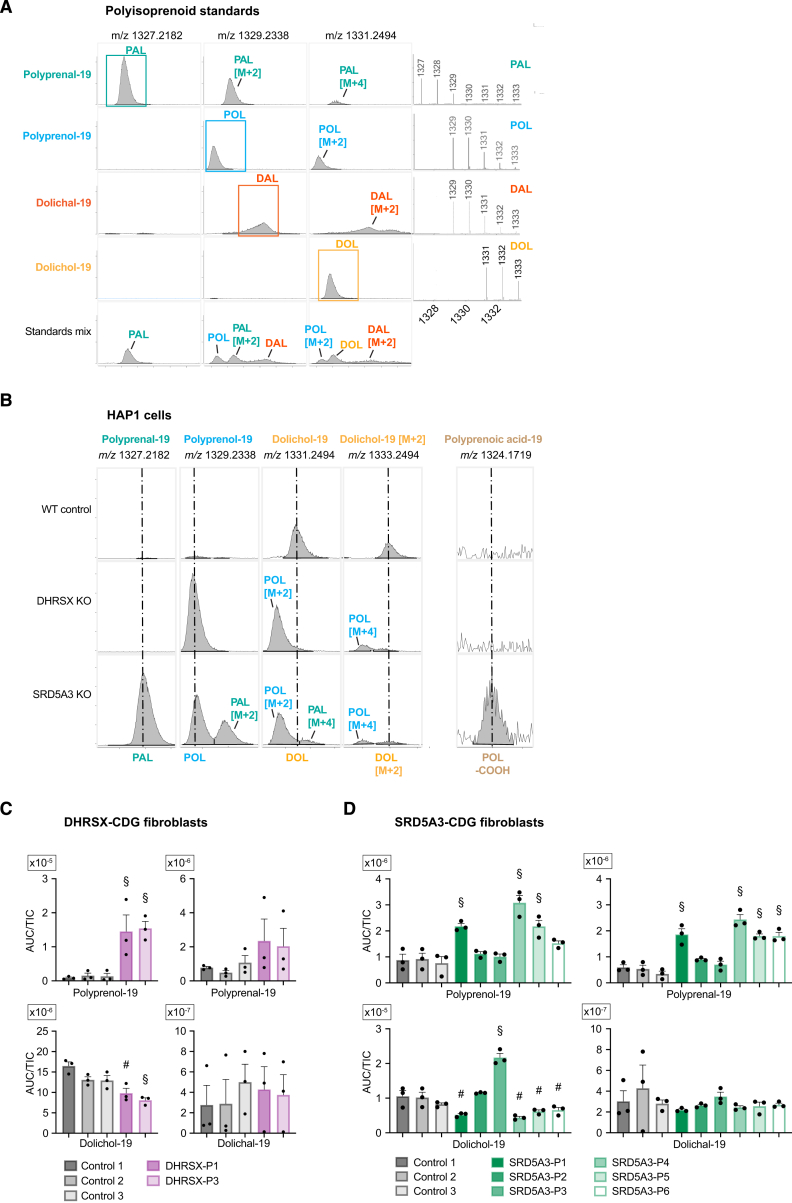
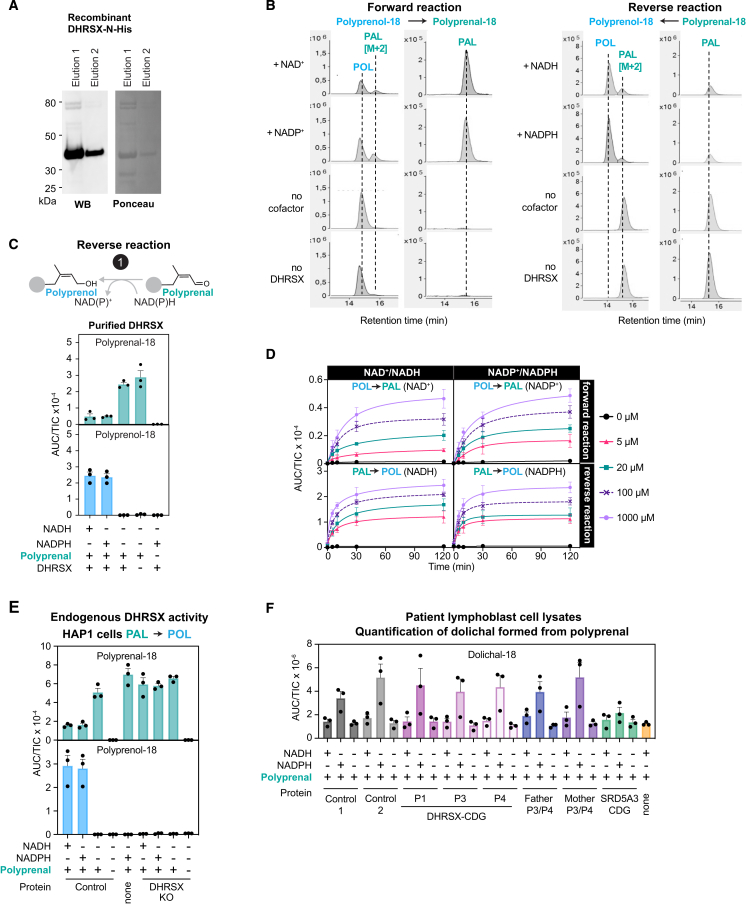
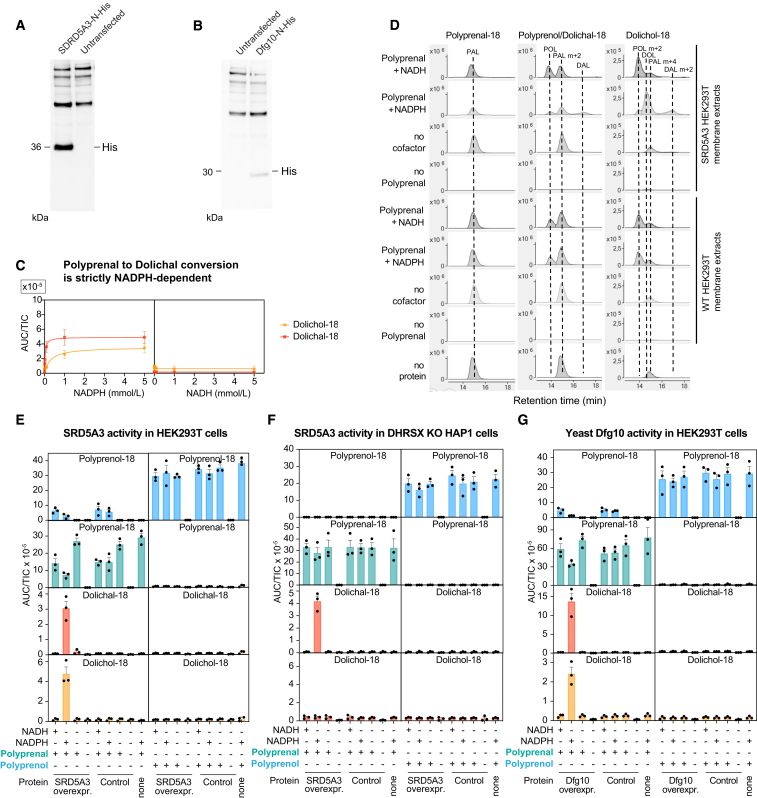
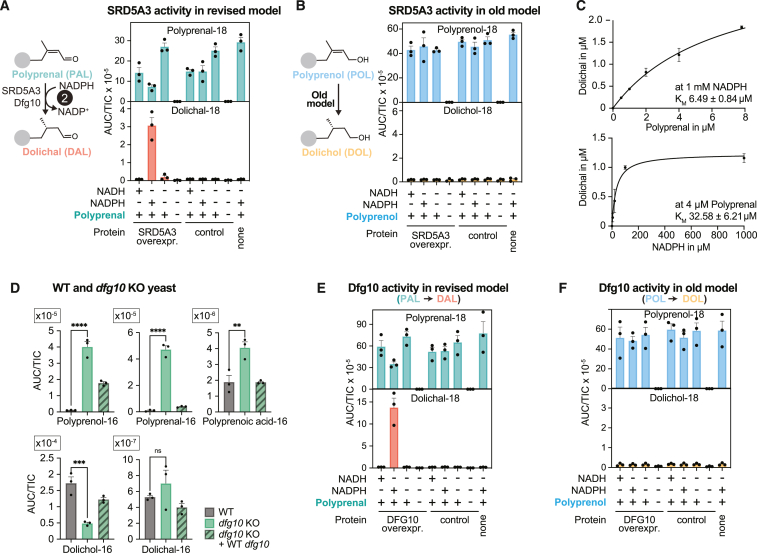
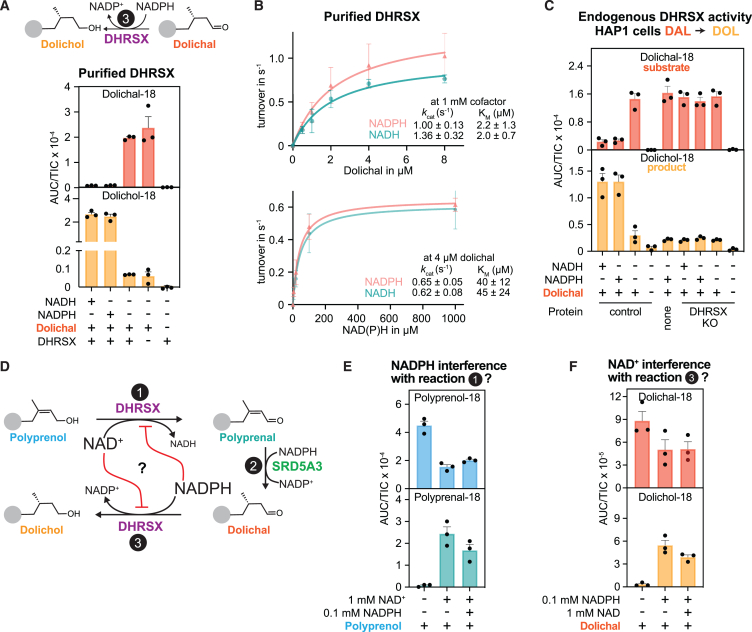
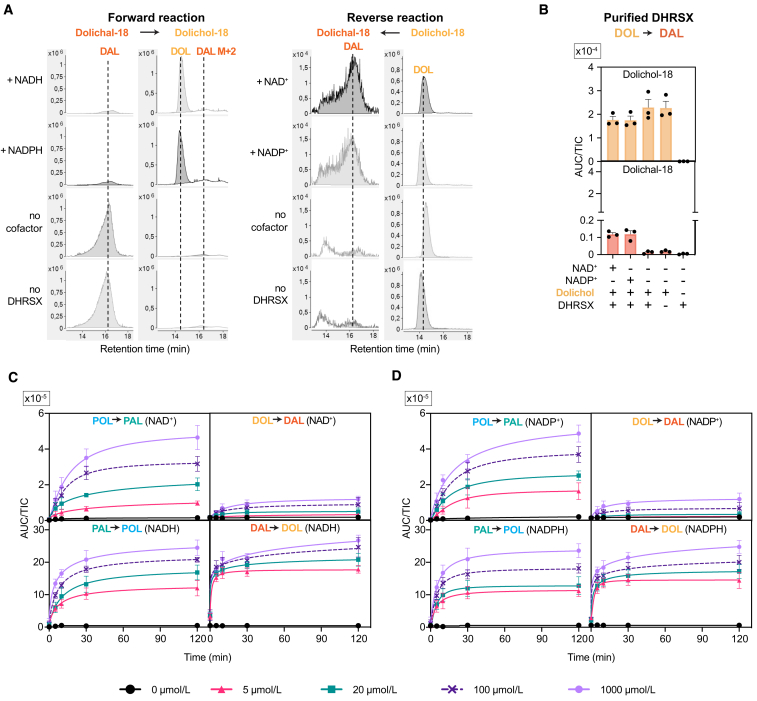
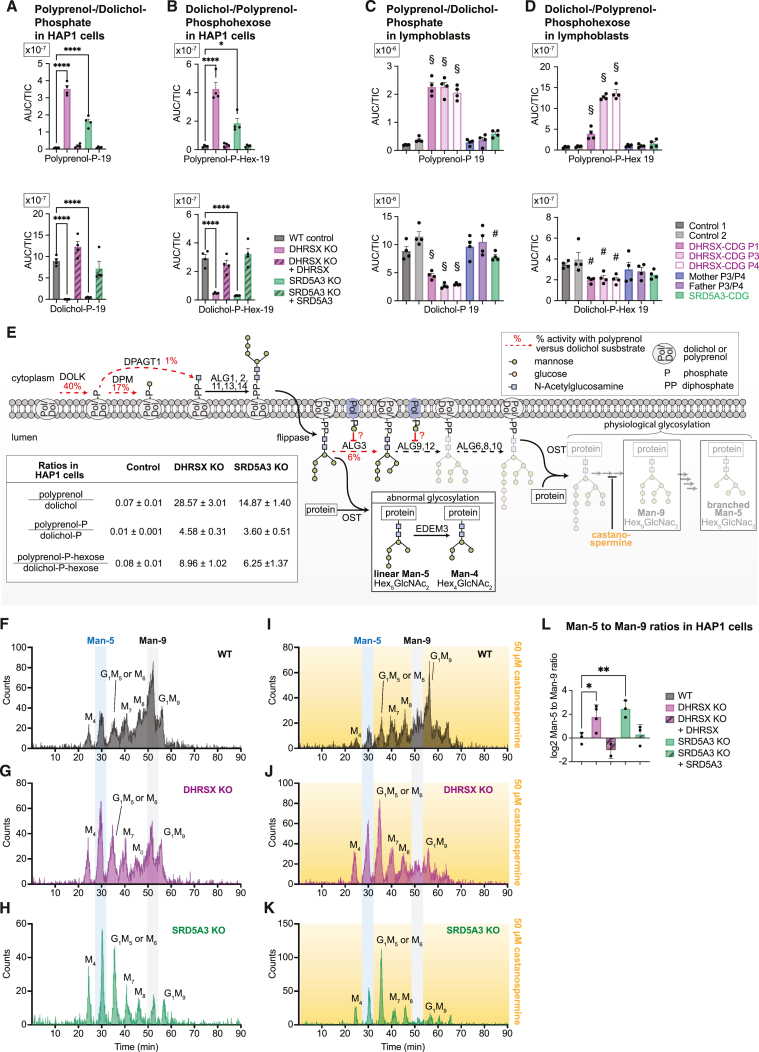
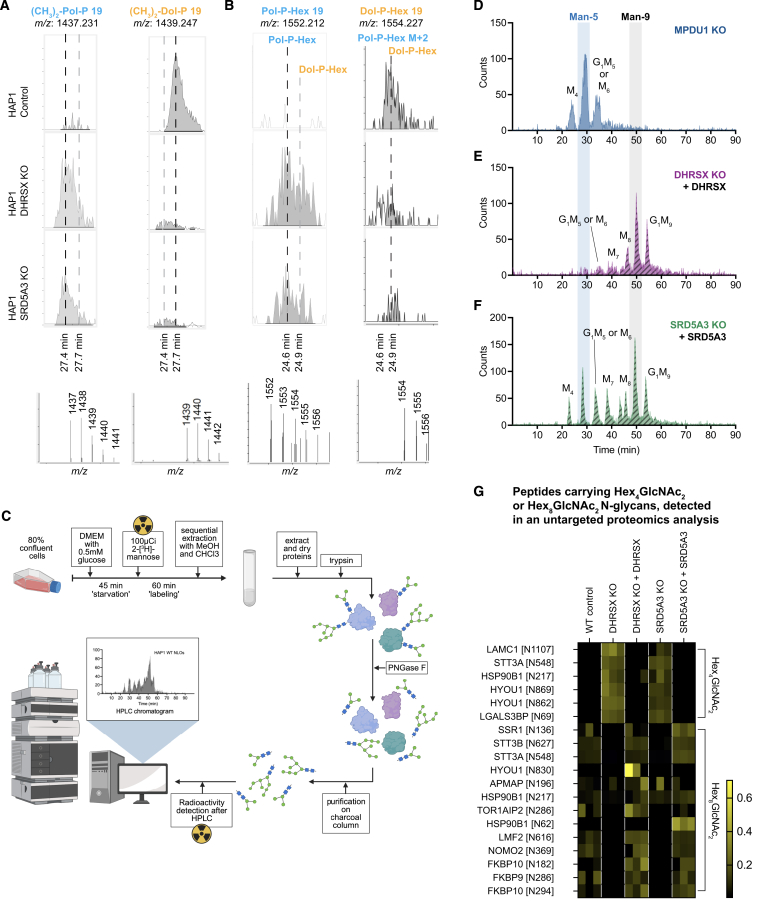
Dolichol is a lipid critical for N-glycosylation as a carrier for activated sugars and nascent oligosaccharides. It is commonly thought to be directly produced from polyprenol by the enzyme SRD5A3. Instead, we found that dolichol synthesis requires a three-step detour involving additional metabolites, where SRD5A3 catalyzes only the second reaction. The first and third steps are performed by DHRSX, whose gene resides on the pseudoautosomal regions of the X and Y chromosomes. Accordingly, we report a pseudoautosomal-recessive disease presenting as a congenital disorder of glycosylation in patients with missense variants in DHRSX (DHRSX-CDG). Of note, DHRSX has a unique dual substrate and cofactor specificity, allowing it to act as a NAD+-dependent dehydrogenase and as a NADPH-dependent reductase in two non-consecutive steps. Thus, our work reveals unexpected complexity in the terminal steps of dolichol biosynthesis. Furthermore, we provide insights into the mechanism by which dolichol metabolism defects contribute to disease.

Keywords: N-glycosylation; congenital disorders of glycosylation; dolichal; dolichol; lipid droplets; polyisoprenoids; polyprenal; polyprenol; pseudoautosomal region.


Conflict of interest statement

Declaration of interests The authors declare no competing interests.

Figures

None
Graphical abstract
Figure 1
Figure 1
DHRSX variants in a presumptive pseudoautosomal-recessive congenital disorder of glycosylation (A) Patients 1, 3, and 4 carrying DHRSX variants. (B) The pseudoautosomal regions (PAR) of the X and Y chromosomes. (C) Pedigree displaying the inheritance of DHRSX variants. Boldface indicates the location of DHRSX variants. (D) Conservation of DHRSX amino acids affected by variants, and % sequence identity of the entire protein sequences as determined by ClustalW. (E) 3D models produced by Alphafill optimization of the Alphafold Q8N5I4 model to contain NADP+ at the predicted active site. In pink the adenine nucleoside moiety, in red the phosphate groups, in turquoise the nicotinamide nucleoside moiety. (F) Alphafold/Alphafill model showing the proximity of the amino acids substituted in patients 1–4 to the predicted active site containing NADP+. Thr49, yellow; Val181, purple; Leu215, blue. (G) 3D surface model showing the position of the predicted active site with NADP+ bound. (H) Rotation of the 3D surface model showing the channel presumably allowing access of lipid substrates to the active site. (I) Localization of Thr49 (yellow), Val181 (purple), and Leu215 (blue) showing proximity to the predicted active site. (J) Western blot analysis of DHRSX protein levels in EBV-immortalized lymphoblasts from controls, parents, and patients. Bar graphs represent DHRSX protein levels normalized to β-tubulin (mean ± SEM, n = 3). (K) DHRSX protein levels in dermal fibroblasts from three controls, and patients with DHRSX variants (patients 1 and 3). Data are presented as in (J). (L) Western blot analysis of LAMP2 mobility and DHRSX in wild-type (“WT”) and DHRSX KO HAP1 cells at baseline, and upon transduction with a lentiviral vector driving expression of DHRSX (“+DHRSX”) or an empty cassette (“EV”). (M) Immunofluorescence of HAP1 cells expressing DHRSX with a C-terminal FLAG tag, using anti-FLAG for DHRSX, anti-calnexin as ER marker, lipid droplet stain LipidSpot 610, and the nuclear counterstain DAPI. Scale bars, 10 μm. See also Figure S1.
Figure S1
Figure S1
Analysis of the function of DHRSX, related to Figure 1 (A) Conservation of the predicted Class IV NAD or NADP binding site consensus sequence ([AVIC]-[LVIFA]-[VIL]-T-G-[AGSC]-X2-GR-ILF-G-X6-[LFAY]) in the indicated vertebrate species. Between brackets are the % sequence identity of the entire protein-coding sequences as determined by ClustalW alignment. Amino acids indicated under the consensus sequence are those required for either NAD or NADP binding as part of the class IV motif. T49 is obligatory. Amino acid positions indicated above the sequence relate to those in the human DHRSX sequence (Q8N5I4). (B) Expression of DHRSX mRNA in EBV-immortalized lymphoblasts from controls (C1, C2), DHRSX-CDG patients (P1, P3, P4), the parents of P3/P4, and an SRD5A3-CDG patient as measured by RT-qPCR. Results are normalized to the expression of HPRT1 and then to the mean of controls. Data are represented as the mean of three biological replicates ±SEM. (C) Sanger sequencing analysis showing a hemizygous 5bp deletion c.467_471 delTCATG; p.(Val156Aspfs62) in SRD5A3, confirming gene deletion (KO). (D) Immunofluorescence analysis of WT HAP1 cells (control), and DHRSX KO HAP1 cells stably transfected with an expression construct for human DHRSX with a C-terminal triple FLAG tag. Labeling with anti-DHRSX (yellow), anti-FLAG DHRSX-FLAG (magenta) and DAPI (cyan) confirms staining in lipid droplet-like structures, and specificity of the anti-FLAG signal. Scale bars = 10 μm. (E) Western blot analysis shows increased LAMP2 mobility indicative of hypoglycosylation in SRD5A3 KO HAP1 cells. Stable re-expression of WT SRD5A3 led to a migration of LAMP2 comparable to the one seen in WT HAP1 cells.
Figure 2
Figure 2
DHRSX or SRD5A3 deficiency leads to metabolic changes prompting a revision of the model of dolichol biosynthesis (A) Commonly accepted model of dolichol biosynthesis, where SRD5A3 directly forms dolichol from polyprenol. Additional related polyisoprenoids detected in our study are shown on the right. (B) Polyisoprenoid species in wild-type, DHRSX KO, and SRD5A3 KO HAP1 cells and respective complementations. Data represent area under the curve (AUC) normalized to total ion count (TIC) (means ± SEM; n = 4; ∗∗∗∗p < 0.0001). Here and in subsequent figures, one species is shown (“−19” means 19 isoprenoid units), but additional chain lengths and chromatograms are shown in Figures S2A and S2B, and Table S2. (C) Polyisoprenoid species in EBV-immortalized lymphoblasts from controls, parents and patients. Data are presented as in (B) (means ± SEM; n = 4; §, p < 0.05 compared to every control). See also Table S2. (D) Working hypothesis of the revised pathway of dolichol biosynthesis. Reaction 1: NAD+-dependent conversion of polyprenol to polyprenal by DHRSX; Reaction 2: NADPH-dependent reduction of polyprenal to dolichal by SRD5A3; Reaction 3: reduction of dolichal to dolichol via an as-yet unknown enzyme. See also Figure S2.
Figure S2
Figure S2
Polyisoprenoid LCMS chromatograms and changes in DHRSX- and SRD5A3-deficient fibroblasts, related to Figure 2 (A) Representative mass spectra (right) and extracted ion chromatograms (left) for the indicated m/z, obtained from standards for polyprenal (PAL), polyprenol (POL), dolichal (DAL), dolichol (DOL) and a mixture of all four species (bottom). (B) Representative extracted ion chromatograms of indicated m/z values in WT, DHRSX KO and SRD5A3 KO HAP1 cells showing accumulation of polyprenal (PAL) and polyprenoic acid (POL-COOH) only in SRD5A3 KO cells and polyprenol (POL) in both DHRSX and SRD5A3 KO cells. Dolichol (DOL) levels are reduced in both DHRSX and SRD5A3 KO cells. The [M+2] peak is shown to reduce confounding effects of increased polyprenal M+4 levels on signals for dolichol. (C) Polyisoprenoids in dermal fibroblasts collected from DHRSX-CDG patients (P1 & P3), compared to those from three controls. Data is the total ion count (TIC)-normalized area under the curve (AUC) (means ± SEM; n = 4). § p < 0.05 compared to every control; # p < 0.05 compared to one of the controls. Only the species with 19 isoprenyl units are shown for clarity. See Table S2 for all isoprenyl chain lengths. Note the up to 100-fold difference in scale between panels. (D) Polyisoprenoids in dermal fibroblasts collected from six SRD5A3-deficient individuals (SRD5A3-P1-6), compared to those from three controls. Data is TIC-normalized AUC (means ± SEM; n = 4). § p < 0.05 compared to every control; # p < 0.05 compared to one of the controls. Only the isoprenoid species with 19 isoprenyl units are shown for clarity. See Table S2 for all isoprenyl chain lengths.
Figure 3
Figure 3
DHRSX produces polyprenal from polyprenol using both NAD+ and NADP+ as cofactor (reaction 1) (A) Formation of polyprenal from polyprenol was measured after incubation of 5 μg/mL polyprenol with 1 mmol/L NADP+ or NAD+ and 0.075 μmol/L recombinant DHRSX (see Figure S3A) for 2 h at 37°C. See also Figures S3B, S3C, and S3D. (B) Kinetic parameters for DHRSX were determined by measuring polyprenal formation after incubation of the indicated concentrations of polyprenol with 1 mmol/L NADP+ or NAD+ and 0.00375 μmol/L recombinant DHRSX for 5 min at 37°C, or after an identical incubation of 4 μmol/L polyprenol with variable nucleotide concentrations. Data are turnover rates based on formation of polyprenal-18 (means ± SEM; n = 3). (C) DHRSX is responsible for the polyprenol dehydrogenase activity in HAP1 cells. Polyprenol-18 and polyprenal-18 were monitored after incubation of 1 mg/mL membrane preparations from wild-type (“WT”) and DHRSX KO HAP1 cells with or without polyprenol (5 μg/mL), and NAD+ or NADP+ (5 mmol/L) for 2 h at 37°C. See also Figure S3E. (D) Endogenous activity in membrane preparations from EBV-immortalized lymphoblast from controls, parents, and patients was assessed in the reverse direction using NADH or NADPH at 5 mmol/L and polyprenal as substrate. See also Figure S3F. (E) Correlation of polyprenal reductase activity in EBV-immortalized lymphoblast membrane preparations (Figure 3D) with ß-tubulin-normalized DHRSX protein levels (Figure 1J). Figures 3A, 3C, and 3D present TIC-normalized AUC (means ± SEM; n = 3). See also Figure S3.
Figure S3
Figure S3
Additional data supporting that DHRSX converts polyprenol to polyprenal, related to Figure 3 (A) Immunoblot using an antibody against the 6xHis epitope of recombinant DHRSX-N-His, alongside Ponceau stain of the same membrane. (B) Adjunct to Figures 3A and S3C, representative chromatograms of the forward reaction (polyprenol to polyprenal conversion; left side) and reverse reaction (polyprenal to polyprenol conversion; right side) with recombinant DHRSX. Interconversion was measured after incubation of 5 μg/mL of polyprenol or polyprenal with 1 mmol/L of the indicated cofactor, and 0.075 μmol/L recombinant DHRSX for 2 h at 37°C. (C) Polyprenol formation from polyprenal was measured after incubation of 5 μg/mL polyprenal with 1 mmol/L NADPH or NADH and 0.075 μmol/L recombinant DHRSX for 2 h at 37°C. Measurements are based on the formation of polyprenol with 18 isoprene units. (D) Time course of polyprenal/polyprenol interconversion by recombinant DHRSX and dependence on NAD(P)(H) concentration measured in both directions. Polyprenol-18 and polyprenal-18 were measured at the indicated time-points after incubation of 5 μg/mL of polyprenol with the indicated concentrations of NADP+ or NAD+, or of 5 μg/mL of polyprenal with the indicated concentrations of NADPH or NADH and 0.075 μmol/L recombinant DHRSX (see Figure S3A) at 37°C. (E) Adjunct to Figure 3C showing the reverse activity of DHRSX measured in WT and DHRSX KO HAP1 cell membrane extracts. Polyprenol-18 and polyprenal-18 were quantified after incubation of 1 mg/mL HAP1 membrane extracts with/without polyprenal (5 μg/mL) and NADH or NADPH (5 mmol/L), 2h, 37°C. (F) Measurement of dolichal-18 from the experiment presented in Figure 3D. Isoprenoid species were monitored after incubation of 1 mg/mL EBV-immortalized lymphoblast membrane extracts with/without polyprenal (5 μg/mL) and NADH or NADPH (5 mmol/L), 2h, 37°C. Figures S3C, S3D, S3E and S3F present TIC-normalized AUC (means +/− SEM; n = 3).
Figure S4
Figure S4
Additional data supporting that SRD5A3 and Dfg10 convert polyprenal to dolichal, related to Figure 4 (A) Western blot analysis of protein extract from samples used for the preparation of membrane extracts showing expression of SRD5A3-N-His in WT HEK293T cells, detected by His immunoblotting. Overexpression was achieved using pcDNA3.1(+)-N-6His plasmid vector containing H. sapiens SRD5A3 cDNA with an N-terminal 6 x His-tag. (B) Western blot analysis of protein extract from samples used for the preparation of membrane extracts showing expression of dfg10-N-His in WT HEK293T cells, detected by His immunoblotting. Overexpression was achieved using pcDNA3.1(+)-N-6His plasmid vector containing S. cerevisiae dfg10 cDNA appended to an N-terminal 6 x His-tag. (C) Polyprenal reductase activity of SRD5A3 is strictly NADPH dependent. NADPH/NADH-dependence of SRD5A3-catalyzed polyprenal reductase activity in SRD5A3-overexpressing HEK293T membrane extracts in the presence of 0.3 mg/mL of membrane protein extract. 5 μg/mL polyprenal was used in the presence of 0, 5, 20, 100, 1000, or 5000 μmol/L of NADPH or NADH, 2h, 37°C. Data are TIC-normalized AUC (mean ± SEM, n = 3). (D) Representative chromatograms, complementary to Figure 4A and (E), showing that significant dolichal-18 and dolichol-18 are only formed from polyprenal (5 μg/mL) in the presence of NADPH (5 mmol/L), but not NADH (5 mmol/L), after incubation for 2h at 37°C. PAL = polyprenal, POL = polyprenol, DAL = dolichal and DOL = dolichol. (E and F) SRD5A3-dependent polyprenal and polyprenol reductase activity was assessed in membrane extracts from HEK293T cells (E) or DHRSX KO HAP1 cells (F) overexpressing SRD5A3 or an empty vector. Measurement of polyprenol-18, polyprenal-18, dolichol-18M + 2, and dolichal-18 from 0.3 mg/mL control or SRD5A3-overexpressing cells after incubation in the presence of polyprenal or polyprenol (5 μg/mL) and NADPH or NADH (5 mmol/L), 2h, 37°C. Data are TIC-normalized AUC (mean ± SEM, n = 3). Several metabolites are already shown in Figures 4A and 4B. (G) Dfg10-dependent polyprenal reductase and polyprenol reductase activity was assessed in membrane-extract from HEK293T cells overexpressing S. cerevisiae dfg10. Measurement of polyprenol-18, polyprenal-18, dolichol-18M + 2, and dolichal-18 from 0.3 mg/mL control or Dfg10-overexpressing HAP1 cells after incubation in the presence of polyprenal or polyprenol (5 μg/mL) and NADPH or NADH (5 mmol/L), 2h, 37°C. Data are TIC-normalized AUC (mean ± SEM, n = 3). Several metabolites are already shown in Figures 4E and 4F.
Figure 4
Figure 4
SRD5A3 and its yeast orthologue Dfg10 produce dolichal from polyprenal (reaction 2) but have undetectable activity on polyprenol (A and B) SRD5A3 shows activity on polyprenal but not on polyprenol. Formation of dolichal from polyprenal (reaction 2 of revised model of dolichol synthesis) (A) and formation of dolichol from polyprenol (previously accepted function of SRD5A3 and Dfg10) (B) were assessed using membrane preparations from HEK293T cells overexpressing human SRD5A3 or an empty vector control. Polyisoprenoids were quantified after 2 h incubation at 37°C with polyprenal (A) or polyprenol (B) at 5 μg/mL and NADPH or NADH at 5 mmol/L. Data represent TIC-normalized AUC (means ± SEM, n = 3). See also Figures S4D, S4E, and S4F. (C) Activity of SRD5A3 determined by measuring dolichal formation after incubation of the indicated concentrations of polyprenal with 1 mmol/L NADPH and 1 μg/mL membrane preparations from DHRSX KO HAP1 cells overexpressing SRD5A3 for 30 min at 37°C (upper) or after an identical incubation of 4 μM of polyprenal with the indicated concentrations of NADPH (lower). Values were calculated based on the formation of dolichal-18 (means ± SEM; n = 3). (D) Isoprenoid species in WT (BY4741), dfg10 KO, and dfg10 KO + dfg10 S cerevisiae. Data are TIC-normalized AUC (means ± SEM; n = 3; p < 0.05; ∗∗p < 0.01; ∗∗∗p < 0.01; ∗∗∗∗p < 0.0001). Species with 16 isoprenyl units are shown. See also Table S2. (E and F) The SRD5A3 yeast orthologue Dfg10 also shows activity on polyprenal but not on polyprenol. Formation of dolichal from polyprenal (reaction 2 of revised model of dolichol synthesis) (E), and formation of dolichol from polyprenol (previously accepted function Dfg10) (F) are presented as described in (A), but using extracts from HEK293T cells overexpressing Dfg10. See also Figure S4G.
Figure 5
Figure 5
DHRSX also catalyzes the final step in dolichol synthesis (A) Formation of dolichol from dolichal was assessed after incubation of 5 μg/mL dolichal with 0.075 μmol/L recombinant DHRSX, and 1 mmol/L NAD(P)H, 2 h, 37°C. See also Figures S5A and S5B. (B) Activity of DHRSX was determined by measuring dolichol formation after incubation of the indicated concentrations of the dolichal mixture with 1 mmol/L NADPH or NADH and 0.00375 μmol/L recombinant DHRSX for 5 min at 37°C (upper), or after an identical incubation of 4 μmol/L of the dolichal mixture with the indicated concentrations of nucleotides (lower). Presented data are turnover rates based on formation of dolichol-18 (means ± SEM; n = 3). (C) DHRSX KO HAP1 cells lack dolichal reductase activity. Dolichol-18 and dolichal-18 were measured in reactions containing 1 mg/mL HAP1 membrane, 5 μg/mL dolichal-18, and 5 mmol/L NAD(P)H for 2 h at 37°C. (D) Potential inhibitory interferences arising from the dual lipid and cofactor specificity of DHRSX in the revised model of dolichol synthesis. Red lines indicate potential inhibition of the opposing DHRSX activity by each reciprocal cofactor (NAD+ or NADPH). The members of each cofactor pair in larger font (NAD+ and NADPH) are those proposed to be used in vivo for DHRSX-dependent polyprenol dehydrogenase and dolichal reductase activities. (E) The NAD+-dependent polyprenal formation from polyprenol is only mildly inhibited by NADPH concentrations found in vivo. Polyprenol-18 and polyprenal-18 were measured after a 15 min, 37°C incubation of 5 μg/mL polyprenol, 0.075 μmol/L recombinant DHRSX, and 1 mmol/L NAD+ with or without 0.1 mmol/L NADPH. (F) The NADPH-dependent dolichol formation from dolichal is only mildly inhibited by NAD+ concentrations found in vivo. Dolichol-18 and dolichal-18 were measured after a 3 min, 37°C incubation of 5 μg/mL of dolichal, 0.075 μmol/L recombinant DHRSX, and 0.1 mmol/L NADPH with or without 1 mmol/L NAD+. Figures 5A, 5C, 5E, and 5F present TIC-normalized AUC (means ± SEM; n = 3). See also Figure S5.
Figure S5
Figure S5
Additional data supporting that DHRSX also converts dolichal to dolichol, related to Figure 5 (A) Representative extracted ion chromatograms of the forward reaction (dolichal to dolichol conversion; left side) and reverse reaction (dolichol to dolichal conversion; right side) of DHRSX presented in Figures 5A and S5B. Metabolites were assessed after incubation of 5 μg/mL dolichal or dolichol with 1 mmol/L of the indicated nucleotides and 0.075 μmol/L recombinant DHRSX for 2 h at 37°C. (B) Formation of dolichal from dolichol was assessed after incubation of 5 μg/mL dolichol with 0.075 μmol/L recombinant DHRSX, and 1 mmol/L NAD(P)+, 2h, 37°C. Data is TIC-normalized AUC of 18 isoprenoid unit containing lipids (means ± SEM, n = 3). See Figure 5A for forward reaction. (C and D) Lack of specificity of DHRSX for NAD(H) or NADP(H) in the conversion of polyprenol to polyprenal, as well as in the conversion of dolichal to dolichol in forward and reverse direction. Polyprenol-18 (POL), polyprenal-18 (PAL), dolichol-18 (DOL) or dolichal-18 (DAL) were measured at the indicated timepoints after incubation of 0.075 μmol/L recombinant DHRSX protein with 5 μg/mL of POL, PAL, DOL or DAL and the indicated cofactor concentrations at 37°C. Data are represented as mean TIC-normalized AUC of three replicates ±SEM. Panels showing bidirectional polyprenol to polyprenal conversion have already been shown in Figure S3D and are displayed here to facilitate a comparison. Of note, the progression of these reactions with time indicates that conversion of dolichol to dolichal is much less favorable than the conversion of polyprenol to polyprenal, consistent with prior reports that the presence of a double-bond between C2 and C3 (as present in polyprenol) strongly favors the oxidation of a terminal alcohol group by increasing the equilibrium constant by a factor of more than 100)..
Figure 6
Figure 6
Accumulation of phospho- and phosphohexose-polyprenol alongside truncated N-linked oligosaccharide species in DHRSX/SRD5A3-deficient cells (A–D) Dolichol-phosphate or polyprenol-phosphate (A and C), and dolichol-phospho-hexose or polyprenol-phospho-hexose (B and D) were measured in wild-type, DHRSX KO, and SRD5A3 KO HAP1 cells and their respective complementations (A and B), as well as EBV-immortalized lymphoblasts from controls, patients, and parents (C and D). Data are TIC-normalized AUC (means ± SEM, n = 4; p < 0.05; ∗∗∗∗p < 0.0001; §p < 0.05 compared to every control; #p < 0.05 compared to one of the controls). See also Table S2, and Figures S6A and S6B. Dolichol- and polyprenol-phospho-hexose represent mixtures of mannose and glucose derivatives. (E) Mechanisms underlying the glycosylation defect in DHRSX and SRD5A3 deficient cells integrating published data and our present paper. The inset table presents the ratio of polyprenol to dolichol (see Figure 2B), as well as the ratios of the corresponding phospho and phosphohexose derivatives (A and B) (means ± SEM, n = 4). The percentages alongside red dashed lines indicate the relative activity of the indicated enzyme when using a polyprenol-instead of dolichol-derived substrate (DOLK, dolichol kinase; DPM1/2/3, Dolichol-phosphate mannosyltransferase; ALG3, Alpha-1,3-Mannosyltransferase; DPAGT1, UDP-N-acetylglucosamine—dolichyl-phosphate N-acetylglucosamine-phosphotransferase,. Erroneous transfer of an immature glycan (Man5GlcNAc2) to nascent glycoproteins leads to linear Man-5 NLOs (see “abnormal glycosylation” box), that are subsequently trimmed to Man-4 NLOs by the enzyme EDEM3. Alternatively, branched Man-5 can be formed during normal N-glycosylation as a consequence of successive glycan trimming (arrows on the right side). Castanospermine allows us to determine the origin of Man-5 glycans, since it inhibits α-glucosidases I/II required for this trimming, thereby preventing the formation of branched Man-5. (F–H) N-linked oligosaccharide (NLO) HPLC profiles obtained from wild-type (F), DHRSX KO (G), and SRD5A3 KO (H) HAP1 cells labeled with 100 μCi [2-3H]-Mannose, showing an accumulation of truncated NLOs, primarily Man-4, Man-5, and Glc1Man5/M6 species upon inactivation of DHRSX or SRD5A3. See also Figures S6D, S6E, and S6F. (I–K) N-linked oligosaccharide (NLO) HPLC profiles obtained from wild-type (I), DHRSX KO (J), and SRD5A3 KO (K) HAP1 cells labeled with 100 μCi [2-3H]-Mannose and treated with 50 μmol/L castanospermine prior to metabolic labeling. The castanospermine-resistant accumulation of Man4, Man5, and Glc1Man5/M6 species indicates that these are due to the transfer of an incomplete lipid-linked olichosaccharide, rather than trimming of mature NLOs. (L) Ratio of the abundance of Man5 N-linked to Man9 N-linked oligosaccharides (NLO) detected in metabolic labeling experiments in wild-type (WT), DHRSX KO, and SRD5A3 KO HAP1 cells and their respective complementations (shown in E–G). Data are presented normalized to WT in a log 2 scale (means ± SEM, n = 2–4; p < 0.05; ∗∗p < 0.01). See also Figure S6.
Figure S6
Figure S6
Additional data corroborating effects on polyisoprenoid adducts and glycosylation, supporting Figure 6 (A) Representative mass spectra and extracted ion chromatograms for dimethylated dolichol-phosphate and polyprenol-phosphate (NH4+ adducts in positive mode) acquired in samples from control, DHRSX KO and SRD5A3 KO HAP1 cells. (B) Representative mass spectra and extracted ion chromatograms (in negative mode) for Dolichol-phosphohexose and polyprenol-phosphohexose in control, DHRSX KO and SRD5A3 KO HAP1 cells. Dolichol-P-hexose and Polyprenol-P-Hexose represent a mixture of mannose and glucose derivatives. (C) Experimental setup of analysis of newly synthesized N-linked oligosaccharides with radioactive mannose in HAP1 cells. Cells were grown to 90% confluency in a T25 flask, then underwent a glucose deprivation step followed by 1 h of labeling with 100 μCi tritiated 23[H]Mannose. Cells then underwent sequential extraction with chloroform and methanol, then glycoproteins were purified from the resulting protein pellet. After overnight digestion steps with trypsin and PNGase F, N-linked oligosaccharide (NLO) extracts were injected and analyzed by HPLC. (D) Newly synthesized N-linked oligosaccharides (NLO) were detected by HPLC after incubation of MPDU1 KO HAP1 cells labeled with 100 μCi 23[H]Mannose, showing characteristic accumulation of Man4, Man5 and Glc1Man5/M6 species and deficiency of Man9 species. (E and F) Newly synthesized NLOs were detected by HPLC after incubation of DHRSX KO HAP1 cells complemented with WT DHRSX (E), or SRD5A3 KO HAP1 cells complemented with WT SRD5A3 (F) with 100 μCi tritiated 23[H]Mannose, showing a restoration of full-length Man9 species. (G) N-linked Hex4GlcNAc2 (corresponding to Man-4) and Hex8GlcNAc2 (corresponding to Man-8) were identified and quantified by an untargeted proteomics approach in membrane extracts of WT, DHRSX KO and SRD5A3 KO HAP1 cells and their respective complementations. The abundance of the indicated peptides was normalized to the abundance of the corresponding parent proteins. To increase visibility of differences between conditions, data are presented normalized within each modified peptide.

Similar articles

Cited by

References

    1. Aebi M. N-linked protein glycosylation in the ER. Biochim. Biophys. Acta. 2013;1833:2430–2437. doi: 10.1016/j.bbamcr.2013.04.001. - DOI - PubMed
    1. Denecke J., Kranz C. Hypoglycosylation due to dolichol metabolism defects. Biochim. Biophys. Acta. 2009;1792:888–895. doi: 10.1016/J.BBADIS.2009.01.013. - DOI - PubMed
    1. Shridas P., Rush J.S., Waechter C.J. Identification and characterization of a cDNA encoding a long-chain cis-isoprenyltranferase involved in dolichyl monophosphate biosynthesis in the ER of brain cells. Biochem. Biophys. Res. Commun. 2003;312:1349–1356. doi: 10.1016/j.bbrc.2003.11.065. - DOI - PubMed
    1. Cantagrel V., Lefeber D.J., Ng B.G., Guan Z., Silhavy J.L., Bielas S.L., Lehle L., Hombauer H., Adamowicz M., Swiezewska E., et al. SRD5A3 Is Required for Converting Polyprenol to Dolichol and Is Mutated in a Congenital Glycosylation Disorder. Cell. 2010;142:203–217. doi: 10.1016/j.cell.2010.06.001. - DOI - PMC - PubMed
    1. Cantagrel V., Lefeber D.J. From glycosylation disorders to dolichol biosynthesis defects: a new class of metabolic diseases. J. Inherit. Metab. Dis. 2011;34:859–867. doi: 10.1007/S10545-011-9301-0. - DOI - PMC - PubMed

MeSH terms