. 2024 Jun 11;19(6):839-858.
doi: 10.1016/j.stemcr.2024.05.001. Epub 2024 May 30.

Disruption of common ocular developmental pathways in patient-derived optic vesicle models of microphthalmia

Affiliations

Disruption of common ocular developmental pathways in patient-derived optic vesicle models of microphthalmia

Jonathan Eintracht et al. Stem Cell Reports. .

Abstract

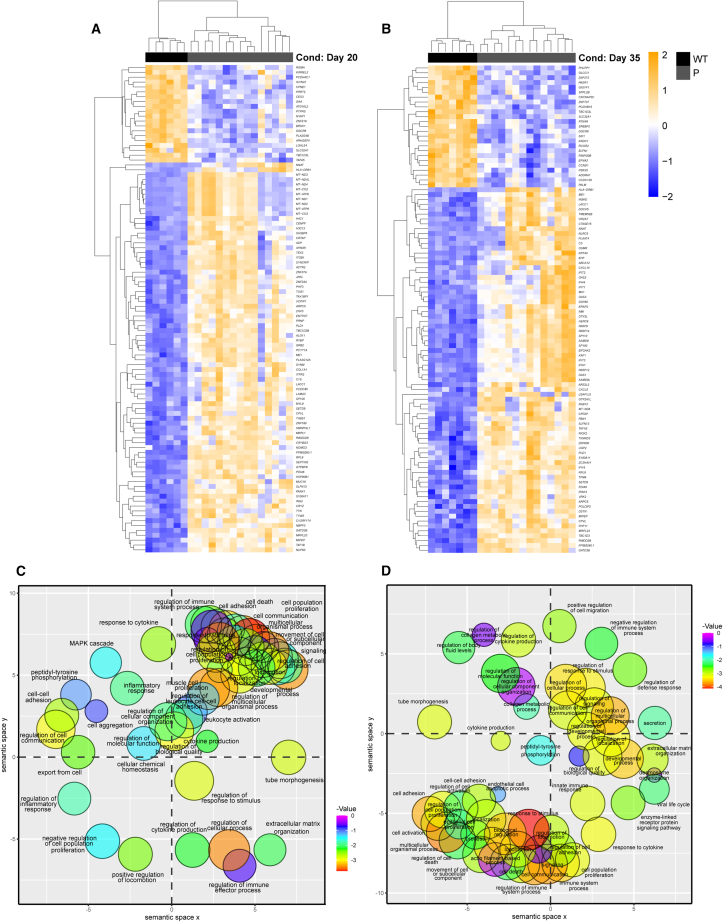
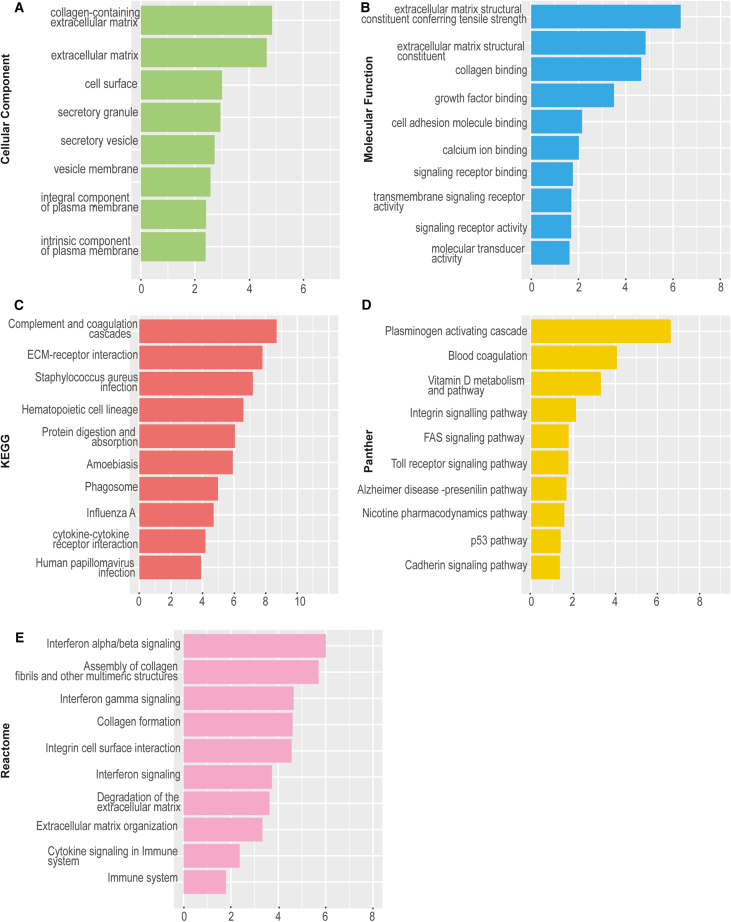
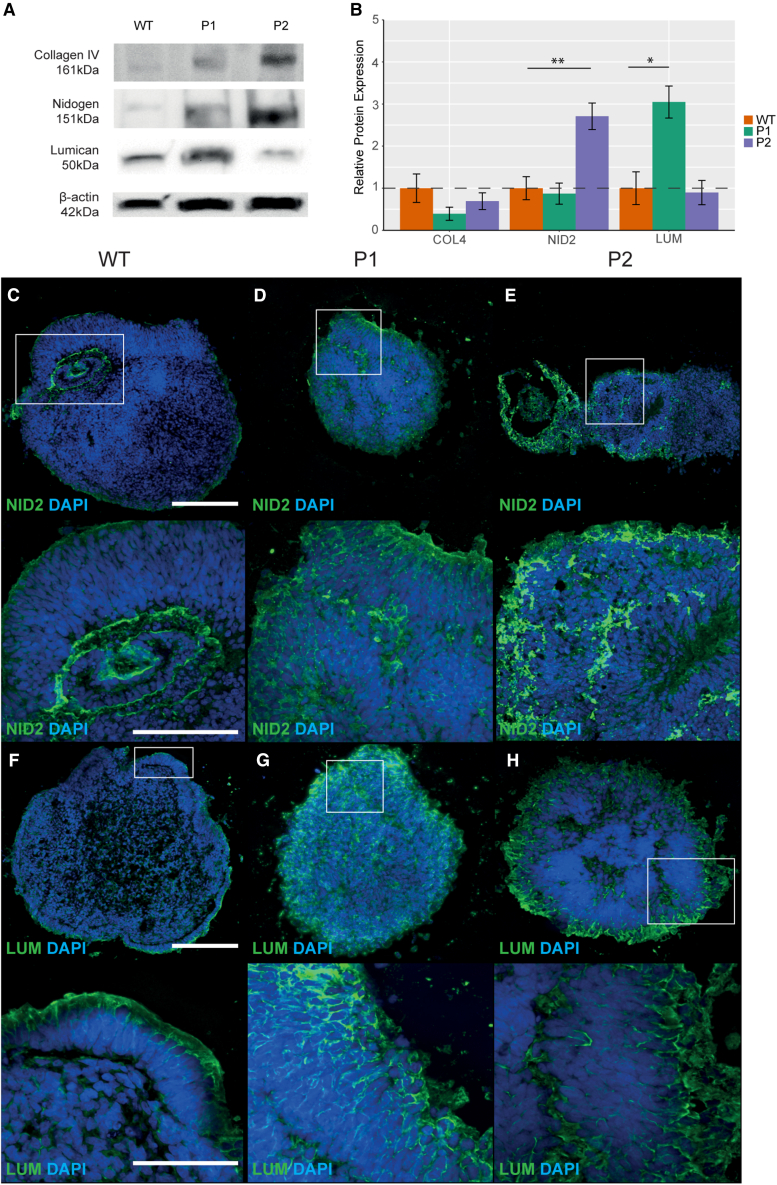
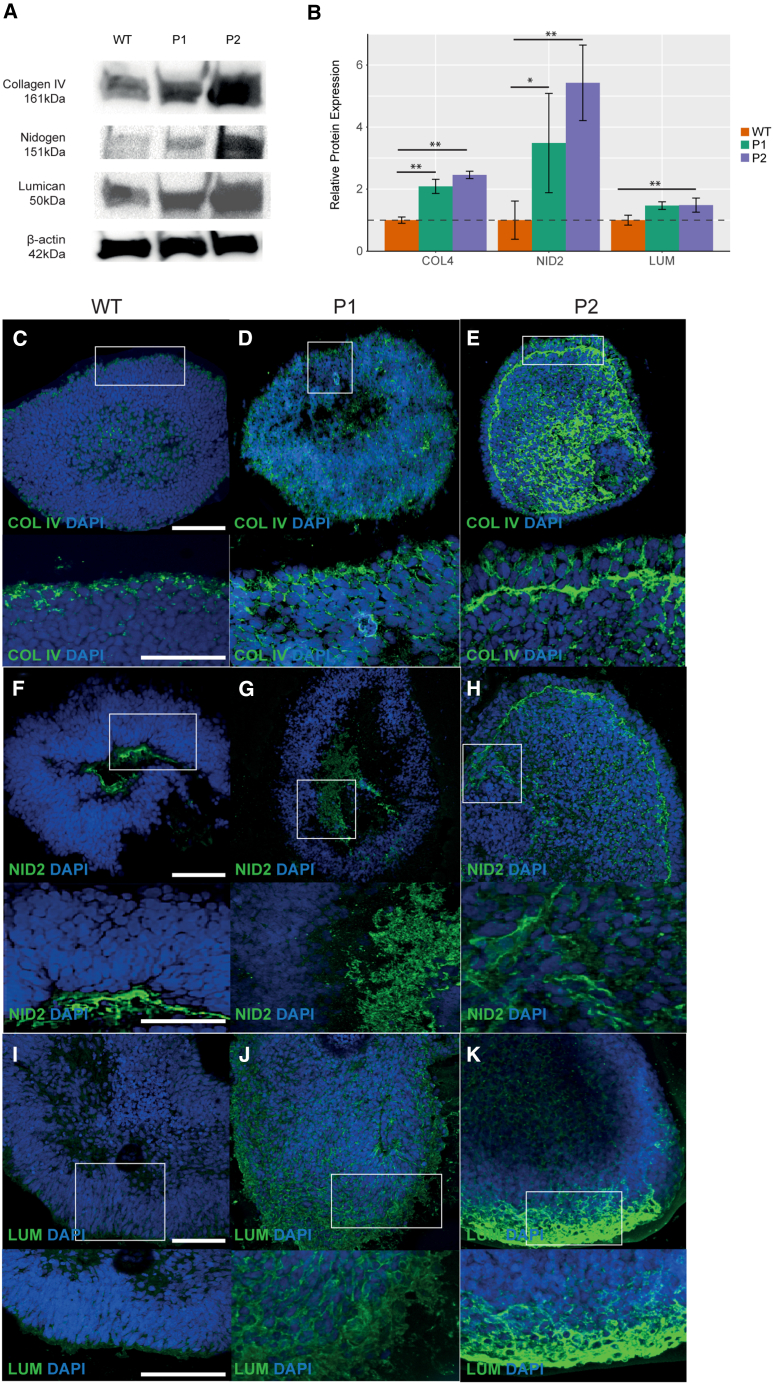
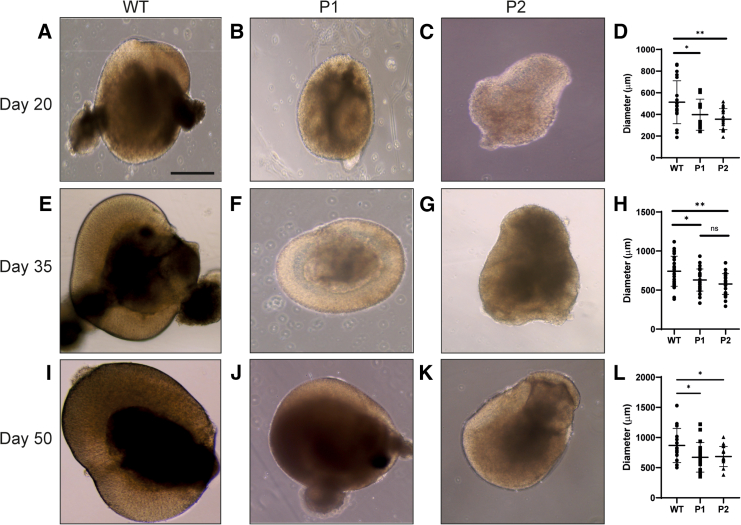
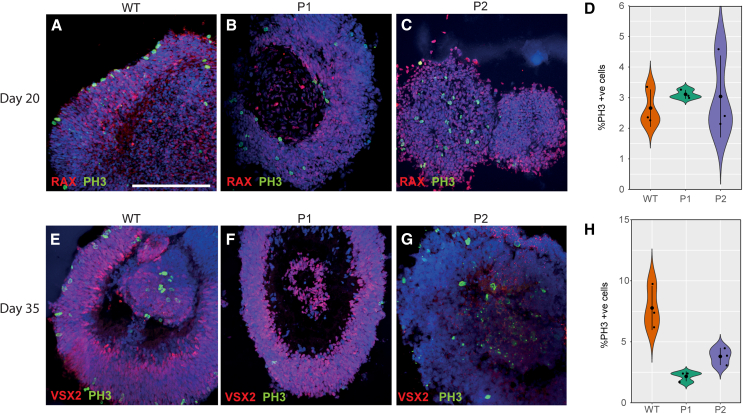
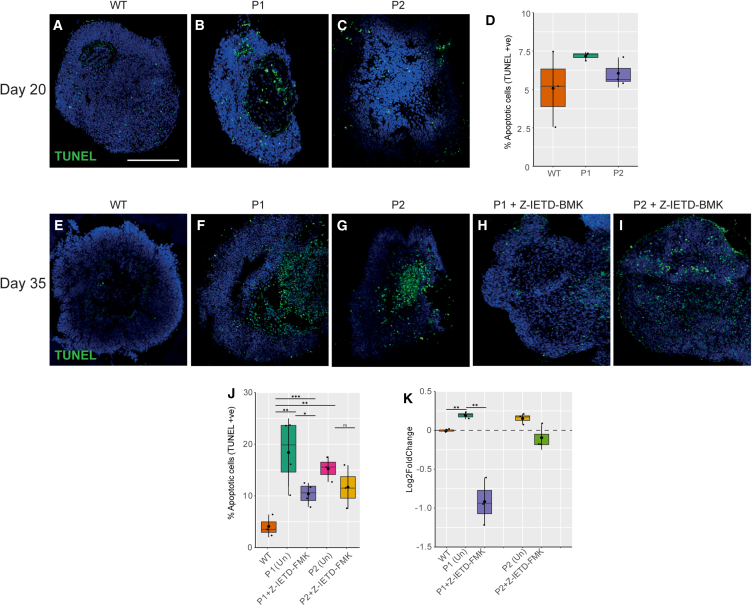
Genetic perturbations influencing early eye development can result in microphthalmia, anophthalmia, and coloboma (MAC). Over 100 genes are associated with MAC, but little is known about common disease mechanisms. In this study, we generated induced pluripotent stem cell (iPSC)-derived optic vesicles (OVs) from two unrelated microphthalmia patients and healthy controls. At day 20, 35, and 50, microphthalmia patient OV diameters were significantly smaller, recapitulating the "small eye" phenotype. RNA sequencing (RNA-seq) analysis revealed upregulation of apoptosis-initiating and extracellular matrix (ECM) genes at day 20 and 35. Western blot and immunohistochemistry revealed increased expression of lumican, nidogen, and collagen type IV, suggesting ECM overproduction. Increased apoptosis was observed in microphthalmia OVs with reduced phospho-histone 3 (pH3+) cells confirming decreased cell proliferation at day 35. Pharmacological inhibition of caspase-8 activity with Z-IETD-FMK decreased apoptosis in one patient model, highlighting a potential therapeutic approach. These data reveal shared pathophysiological mechanisms contributing to a microphthalmia phenotype.

Keywords: PAX6; Z-IETD-FMK; apoptosis; extracellular matrix; eye morphogenesis; hiPSC-derived optic vesicles; microphthalmia; ocular genetics; proliferation.


Conflict of interest statement

Declaration of interests The authors declare no competing interests.

Figures

Figure 1
Figure 1
Transcriptomic profiling of microphthalmia optic vesicles (A) Heatmap of top 100 differentially expressed genes between wild-type (WT) and patient (P) optic vesicles at day 20. (B) Heatmap of top 100 differentially expressed genes between WT and patients at day 35. (C) Enriched gene ontology (biological process) terms between WT and P at day 20. (D) Enriched gene ontology (biological process) terms between WT and P at day 35. RNA-seq analysis was performed with n = 4 from two clones each per time point per condition.
Figure 2
Figure 2
Gene Ontology (GO) term enrichment analysis of WT vs. P (patient-derived) optic vesicles at day 35 (A) The highest enriched cellular compartment GO terms in WT vs. P at day 35 generated using RNA-seq data. (B) The highest enriched molecular function GO terms in WT vs. P at day 35 generated using RNA-seq data. (C) The highest enriched KEGG GO terms in WT vs. P at day 35 generated using RNA-seq data. (D) The highest enriched Panther GO terms in WT vs. P at day 35 generated using RNA-seq data. (E) The highest enriched Reactome GO terms in WT vs. P at day 35 generated using RNA-seq data. RNA-seq analysis was performed with n = 4 from two clones each per time point per condition.
Figure 3
Figure 3
Expression of ECM proteins in day 20 optic vesicles (A) Western blot showing expression levels of COL4A1, NID2, and LUM in WT, P1 (patient 1), and P2 (patient 2) optic vesicles at day 20. β-Actin was used as a loading control for normalization of expression levels. (B) Quantification of COL4A1, NID2, and LUM expression levels from the western blot. (C–E) Expression patterns of NID2 in WT, P1, and P2 optic vesicles at day 20. (F–H) Expression patterns of LUM in WT, P1, and P2 optic vesicles at day 20. Experiments were performed with n = 3 from one clone per condition. p < 0.05 (), p < 0.01 (∗∗), p < 0.001 (∗∗∗). All results are expressed as mean ± SD.
Figure 4
Figure 4
Expression of ECM proteins in day 35 optic vesicles (A) Western blot showing expression levels of COL4A1, NID2, and LUM in WT, P1, and P2 optic vesicles at day 35. β-Actin was used as a loading control for normalization of expression levels. (B) Quantification of COL4A1, NID2, and LUM expression levels from the western blot. (C–E) Expression patterns of COL4A1 in WT, P1, and P2 optic vesicles at day 35. (F–H) Expression patterns of NID2 in WT, P1, and P2 optic vesicles at day 35. (I–K) Expression patterns of LUM in WT, P1, and P2 optic vesicles at day 35. Experiments were performed with n = 3 from one clone per condition. p < 0.05 (), p < 0.01 (∗∗), p < 0.001 (∗∗∗). All results are expressed as mean ± SD.
Figure 5
Figure 5
Diameters of WT, P1, and P2 optic vesicles (A–C) Light microscopy images of WT, P1, and P2 optic vesicles at day 20. (D) Diameters of WT, P1, and P2 optic vesicles at day 20. (E–G) Light microscopy images of WT, P1, and P2 optic vesicles at day 35. (H) Diameters of WT, P1, and P2 optic vesicles at day 35. (I–K) Light microscopy images of WT, P1, and P2 optic vesicles at day 50. (L) Diameters of WT, P1, and P2 optic vesicles at day 50. For all conditions, n = 20. p < 0.05 (), p < 0.01 (∗∗), p < 0.001 (∗∗∗). All results are expressed as mean ± SD.
Figure 6
Figure 6
Reduced proliferation in microphthalmia optic vesicles (A–C) pH3+ cells detected in WT, P1, and P2 optic vesicles at day 20. (D) Quantification of pH3+ cells in WT, P1, and P2 optic vesicles at day 20. (E–G) pH3+ cells detected in WT, P1, and P2 optic vesicles at day 35. (H) Quantification of pH3+ cells in WT, P1, and P2 optic vesicles at day 35. Experiments were performed with n = 3 from two clones per condition. p < 0.05 (), p < 0.01 (∗∗), p < 0.001 (∗∗∗). All results are expressed as mean ± SD.
Figure 7
Figure 7
Apoptosis in microphthalmia optic vesicles (A–C) TUNEL+ cells detected in WT, P1, and P2 optic vesicles at day 20. (D) Quantification of apoptosis through TUNEL+ cells in WT, P1, and P2 optic vesicles at day 20. (E–G) TUNEL+ cells detected in WT, P1, and P2 optic vesicles at day 35. (H and I) TUNEL+ cells detected in Z-IETD-FMK-treated P1 and P2 optic vesicles at day 35. (J) Quantification of apoptosis through TUNEL+ cells in WT and treated and untreated P1 and P2 optic vesicles at day 35. (K) Quantification of caspase-8 activity in WT and treated and untreated P1 and P2 optic vesicles by firefly caspase-8 assay. Experiments were performed with n = 3 from two clones per condition. p < 0.05 (), p < 0.01 (∗∗), p < 0.001 (∗∗∗). All results are expressed as mean ± SD.

Similar articles

Cited by

References

    1. Afanasyeva T.A.V., Corral-Serrano J.C., Garanto A., Roepman R., Cheetham M.E., Collin R.W.J. A look into retinal organoids: methods, analytical techniques, and applications. Cell. Mol. Life Sci. 2021;78:6505–6532. - PMC - PubMed
    1. Aldiri I., Moore K.B., Hutcheson D.A., Zhang J., Vetter M.L. Polycomb repressive complex prc2 regulates xenopus retina development downstream of wnt/β-catenin signaling. Development. 2013;140:2867–2878. - PMC - PubMed
    1. Amjadi S., Mai K., Mccluskey P., Wakefield D. The role of lumican in ocular disease. Int. Sch. Res. Notices. 2013;2013:632302. - PMC - PubMed
    1. Asaoka Y., Hata S., Namae M., Furutani-Seiki M., Nishina H. The hippo pathway controls a switch between retinal progenitor cell proliferation and photoreceptor cell differentiation in zebrafish. PLoS One. 2014;9:e97365. - PMC - PubMed
    1. Bai X., Dilworth D.J., Weng Y.-C., Gould D.B. Developmental distribution of collagen iv isoforms and relevance to ocular diseases. Matrix Biol. 2009;28:194–201. - PMC - PubMed

Publication types