. 2024 Jul:85:101963.
doi: 10.1016/j.molmet.2024.101963. Epub 2024 May 29.

Differential cell type-specific function of the aryl hydrocarbon receptor and its repressor in diet-induced obesity and fibrosis

Affiliations

Differential cell type-specific function of the aryl hydrocarbon receptor and its repressor in diet-induced obesity and fibrosis

Frederike J Graelmann et al. Mol Metab. 2024 Jul.

Abstract

Objective: The aryl hydrocarbon receptor (AhR) is a ligand-activated transcription factor regulating xenobiotic responses as well as physiological metabolism. Dietary AhR ligands activate the AhR signaling axis, whereas AhR activation is negatively regulated by the AhR repressor (AhRR). While AhR-deficient mice are known to be resistant to diet-induced obesity (DIO), the influence of the AhRR on DIO has not been assessed so far.

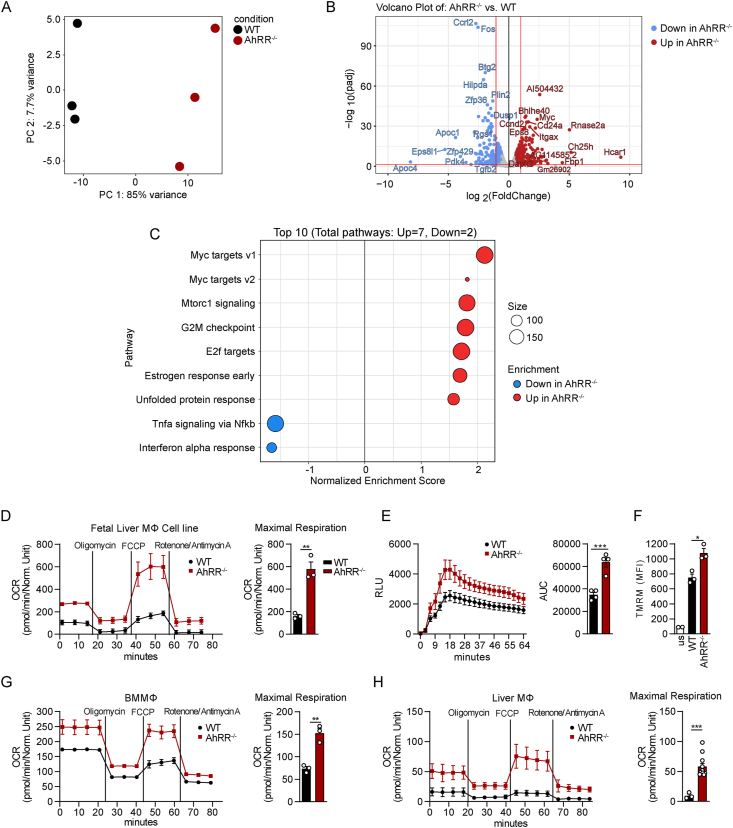
Methods: In this study, we analyzed AhRR-/- mice and mice with a conditional deletion of either AhRR or AhR in myeloid cells under conditions of DIO and after supplementation of dietary AhR ligands. Moreover, macrophage metabolism was assessed using Seahorse Mito Stress Test and ROS assays as well as transcriptomic analysis.

Results: We demonstrate that global AhRR deficiency leads to a robust, but not as profound protection from DIO and hepatosteatosis as AhR deficiency. Under conditions of DIO, AhRR-/- mice did not accumulate TCA cycle intermediates in the circulation in contrast to wild-type (WT) mice, indicating protection from metabolic dysfunction. This effect could be mimicked by dietary supplementation of AhR ligands in WT mice. Because of the predominant expression of the AhRR in myeloid cells, AhRR-deficient macrophages were analyzed for changes in metabolism and showed major metabolic alterations regarding oxidative phosphorylation and mitochondrial activity. Unbiased transcriptomic analysis revealed increased expression of genes involved in de novo lipogenesis and mitochondrial biogenesis. Mice with a genetic deficiency of the AhRR in myeloid cells did not show alterations in weight gain after high fat diet (HFD) but demonstrated ameliorated liver damage compared to control mice. Further, deficiency of the AhR in myeloid cells also did not affect weight gain but led to enhanced liver damage and adipose tissue fibrosis compared to controls.

Conclusions: AhRR-deficient mice are resistant to diet-induced metabolic syndrome. Although conditional ablation of either the AhR or AhRR in myeloid cells did not recapitulate the phenotype of the global knockout, our findings suggest that enhanced AhR signaling in myeloid cells deficient for AhRR protects from diet-induced liver damage and fibrosis, whereas myeloid cell-specific AhR deficiency is detrimental.

Keywords: Collagen deposition; Energy expenditure; Hepatic steatosis; Indole-3-carbinol; Macrophage metabolism; Metabolic dysfunction.


Conflict of interest statement

Declaration of competing interest The authors declare that they have no known competing financial interests or personal relationships that could have appeared to influence the work reported in this paper.

Figures

Image 1
Graphical abstract
Figure 1
Figure 1
AhRR-deficient mice are partially resistant to diet-induced obesity. (A) Body weight of wild-type (WT) and AhRR-deficient mice fed CD or HFD for 14 weeks; n = 8 (CD WT), n = 6 (HFD WT), n = 5 (CD, HFD AhRR−/−). (B) Blood glucose levels during a glucose tolerance test -GTT- (left panel) and insulin tolerance test -ITT- (right panel) after 12 weeks on HFD; n = 11 (GTT WT), n = 10 (GTT AhRR−/−), n = 5 (ITT WT, ITT AhRR−/−). (C) Total serum cholesterol levels after 14 weeks on HFD; n = 9 (WT), n = 7 (AhRR−/−). (D) Analysis of covariance (ANCOVA) (non-linear fit) of oxygen consumption/body weight (BW); n = 8 for both groups. (E) Total body fat mass assessed by NMR; n = 8 for both groups. (F) WATg weight; n = 8 for both groups. (G) Representative H&E staining. Scale bars, 80 μm (left panel). Right, quantification of adipocyte size of the WATg of HFD mice; n = 5 (WT), n = 4 (AhRR−/−). (H) Liver weight; n = 8 (CD WT, CD AhRR−/−, HFD AhRR−/−), n = 7 (HFD WT). (I) Representative H&E (left panel) and Sirius Red (right panel) staining of liver sections. Scale bars, 100 μm. (J) Representative Oil Red O (ORO) and Hemalaun staining of liver sections of WT and AhRR-deficient mice after HFD. Scale bars, 80 μm (left panel). Right, quantification of ORO stain, n = 3 (CD WT), n = 8 (HFD WT), n = 6 (HFD AhRR−/−). (K) Serum Alanine transaminase (ALT) concentration of WT and AhRR-deficient mice fed either CD or HFD for 14 weeks; n = 4 for all groups. (L) Body weight of WT and AhRR-deficient mice fed a HFD supplemented with or without indole-3 carbinole (I3C) for 14 weeks; n = 20 (WT HFD), n = 15 (WT HFD + I3C), n = 15 (AhRR−/− HFD), and n = 14 (AhRR−/− HFD + I3C). (M) Representative ORO and Hemalaun staining of liver sections of WT and AhRR−/− mice after HFD ± I3C. Scale bars, 100 μm (left panel). Right, ORO staining quantification of liver sections; n = 10 (WT CD, HFD), n = 7 (WT HFD + I3C), n = 5 (AhRR−/− HFD), n = 9 (AhRR−/− HFD + I3C). (N) z-scored intensity values of representative TCA-metabolites found in plasma of mice after 14 weeks of CD or HFD ± I3C; n = 3–5. ∗p < 0.05, ∗∗p ≤ 0.01, ∗∗∗p ≤ 0.001. Significance was determined using unpaired two-tailed t-tests (A, B, C, G) and one-way analysis of variance (ANOVA) with Tukey's multiple-comparison test (E, F, H, K and M) or with Dunnett's multiple comparisons test (J). Two-way analysis of variance (ANOVA) with Tukey's multiple-comparison test (L). Data are mean ± s.e.m.
Figure 2
Figure 2
AhRR-deficient macrophages display an altered metabolic and gene expression profile. (A) Principal Component Analysis (PCA) plot depicting relationship of all samples based on dynamic gene expression of all genes comparing WT and AhRR−/− Fetal Liver MΦ (FLiM) cells (n = 3) and (B) Volcano plot depicting fold changes (FC) and FDR-adjusted p values comparing WT and AhRR−/− FLiM cells. Differentially expressed up- (red) and downregulated genes (blue) are shown and selected genes are highlighted. (C) GSEA results based on the ranked gene list between AhRR−/− vs WT FLiM cells, n = 3. Only significant enriched terms are visualized by the Normalized enrichment scores (NES) and the enriched terms based on the Hallmark DB, n = 3. (D) Mitochondrial stress test analysis of FLiM cells of WT and AhRR−/− mice using a Seahorse XFe96 analyzer. Oxygen consumption rate (OCR) over time (left panel) and quantification of the maximal OCR (right panel); n = 3. (E) ROS production of FLiM cells after stimulation with zymosan over time (left panel) and quantification depicted as area under curve (AUC, right panel); n = 4. (F) Flow cytometric measurement of mitochondrial membrane potential using Tetramethylrhodamine Methyl Ester (TMRM), depicted as MFI; n = 3 (WT, AhRR−/−). us = unstained control, n = 2. (G) Mitochondrial stress test analysis in bone marrow-derived macrophages (BMMΦ) and (H) primary liver macrophages of WT and AhRR−/− mice. OCR over time (left panel) and quantification of the maximal OCR (right panel); For (G), n = 3 and for (H), n = 3 (WT), n = 10 (AhRR−/−). Seahorse and ROS data show mean ± s.e.m. of at least three technical replicates from one representative experiment. At least three biologically independent experiments were performed for all OCR and ROS measurements. ∗p < 0.05, ∗∗p ≤ 0.01, ∗∗∗p ≤ 0.001. Significance was determined using unpaired two-tailed t-tests.
Figure 3
Figure 3
Lack of AhRR in myeloid cells protects from diet-induced liver steatosis. (A-J) WT (AhRRfl/fl) mice and mice lacking AhRR in myeloid cells (AhRRfl/flLysMCre) were fed either a CD or a HFD over the course of 14 weeks. (A) Body weight; n = 16 (CD AhRRfl/fl), n = 14 (CD AhRRfl/flLysMCre) and n = 15 (HFD AhRRfl/fl, HFD AhRRfl/flLysMCre). (B) Total body fat mass assessed by NMR; n = 5. (C) Blood glucose over the course of 150 min (left) and AUC quantification (right); n = 10 (AhRRfl/fl), n = 9 (AhRRfl/flLysMCre). (D) ANCOVA of oxygen consumption rate of HFD mice; n = 5 for all groups. (E) Liver weight, n = 16 (CD AhRRfl/fl), n = 15 (HFD AhRRfl/fl), n = 14 (CD AhRRfl/flLysMCre, HFD AhRRfl/flLysMCre). (F) Representative H&E (left panel) and semiquantitative analysis of the steatotic score (right panel) of HFD liver samples. Scale bars, 100 μm; n = 12 for both groups. (G) Relative mRNA expression levels of lipid-related markers in HFD liver samples, n = 12 for all groups. (H) Representative Sirius Red staining of HFD liver samples. Scale bars, 100 μm, n = 12 for all groups. (I) Relative mRNA expression of pro-fibrotic markers in HFD liver samples; n = 12 for all groups. (J) ALT concentration in plasma of AhRRfl/fl and AhRRfl/flLysMCre mice fed either CD or HFD for 14 weeks; n = 5 (CD AhRRfl/fl, CD AhRRfl/flLysMCre), n = 9 (HFD AhRRfl/fl), and n = 8 (HFD AhRRfl/flLysMCre). ∗p < 0.05, ∗∗p ≤ 0.01, ∗∗∗p ≤ 0.001. Significance was determined using unpaired two-tailed t-tests (F, G, and I) and one-way ANOVA with Tukey's multiple-comparison test (B, C, E and J). Data are mean ± s.e.m.
Figure 4
Figure 4
Lack of AhR in myeloid cells aggravates hepatic steatosis and induces fibrosis in liver and adipose tissue. (A-L) WT (AhRfl/fl) mice and mice lacking AhR in myeloid cells (AhRfl/flLysMCre) were fed either a CD or a HFD over the course of 14 weeks. For all experiments n = 11 (CD AhRfl/fl), n = 12 (CD AhRfl/flLysMCre), n = 12 (HFD AhRfl/fl), and n = 10 (HFD AhRfl/flLysMCre) unless otherwise stated in the figure legends. (A) Body weight. (B) WATg weight in grams. (C) Relative mRNA levels of adipogenic markers in WATg of HFD mice. (D) Total serum cholesterol; n = 8 (AhRfl/fl) and n = 7 (AhRfl/flLysMCre). (E) Representative H&E (left panel) and F4/80 (right panel) staining of the WATg of HFD mice. Scale bars, 100 μm. n = 11 (AhRfl/fl) and n = 10 (AhRfl/flLysMCre). (F) Representative Sirius Red staining (left panel) and semiquantitative analysis of the fibrosis score (right panel) of the WATg of HFD mice. Scale bars, 100 μm; n = 11 (AhRfl/fl) and n = 10 (AhRfl/flLysMCre). (G) Relative mRNA levels of pro-fibrotic markers in WATg of HFD mice. (H) Liver weight. (I) Representative H&E stainings (left panel) and semiquantitative analysis of the steatotic score (right panel) of HFD liver samples. Scale bars, 100 μm. (J) Relative mRNA expression levels of lipid-related markers in the liver of HFD mice. (K) Representative Sirius Red staining of liver sections. Scale bars, 100 μm (left panel). Right, relative mRNA expression levels of pro-fibrotic markers in the liver of HFD mice. (L) Serum ALT concentration of AhRfl/fl and AhRfl/flLysMCre mice fed a HFD for 14 weeks; n = 8 for both groups. ∗p < 0.05, ∗∗p ≤ 0.01, ∗∗∗p ≤ 0.001. Significance was determined using unpaired two-tailed t-tests (C, D, F, G, I, J, K, and L) and one-way ANOVA with Tukey's multiple-comparison test (B and H). Data are mean ± s.e.m.

References

    1. Stockinger B., Shah K., Wincent E. AHR in the intestinal microenvironment: safeguarding barrier function. Nat Rev Gastroenterol Hepatol. 2021:559–570. doi: 10.1038/s41575-021-00430-8. - DOI - PMC - PubMed
    1. Rothhammer V., Quintana F.J. The aryl hydrocarbon receptor: an environmental sensor integrating immune responses in health and disease. Nat Rev Immunol. 2019;19(3):184–197. doi: 10.1038/s41577-019-0125-8. - DOI - PubMed
    1. Denison M.S., Soshilov A.A., He G., Degroot D.E., Zhao B. Exactly the same but different: promiscuity and diversity in the molecular mechanisms of action of the aryl hydrocarbon (dioxin) receptor. Toxicol Sci. 2011;124(1):1–22. doi: 10.1093/toxsci/kfr218. - DOI - PMC - PubMed
    1. Schiering C., Wincent E., Metidji A., Iseppon A., Li Y., Potocnik A.J., et al. Feedback control of AHR signalling regulates intestinal immunity. Nature. 2017;542(7640):242–245. doi: 10.1038/nature21080. - DOI - PMC - PubMed
    1. Diny N.L., Schonfeldova B., Shapiro M., Winder M.L., Varsani-Brown S., Stockinger B. The aryl hydrocarbon receptor contributes to tissue adaptation of intestinal eosinophils in mice. J Exp Med. 2022;219(4) doi: 10.1084/jem.20210970. - DOI - PMC - PubMed

Substances