High-Resolution Raman Imaging of >300 Patient-Derived Cells from Nine Different Leukemia Subtypes: A Global Clustering Approach
- PMID: 38821490
- PMCID: PMC11170555
- DOI: 10.1021/acs.analchem.4c00787
High-Resolution Raman Imaging of >300 Patient-Derived Cells from Nine Different Leukemia Subtypes: A Global Clustering Approach
Abstract
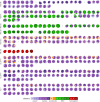
Leukemia comprises a diverse group of bone marrow tumors marked by cell proliferation. Current diagnosis involves identifying leukemia subtypes through visual assessment of blood and bone marrow smears, a subjective and time-consuming method. Our study introduces the characterization of different leukemia subtypes using a global clustering approach of Raman hyperspectral maps of cells. We analyzed bone marrow samples from 19 patients, each presenting one of nine distinct leukemia subtypes, by conducting high spatial resolution Raman imaging on 319 cells, generating over 1.3 million spectra in total. An automated preprocessing pipeline followed by a single-step global clustering approach performed over the entire data set identified relevant cellular components (cytoplasm, nucleus, carotenoids, myeloperoxidase (MPO), and hemoglobin (HB)) enabling the unsupervised creation of high-quality pseudostained images at the single-cell level. Furthermore, this approach provided a semiquantitative analysis of cellular component distribution, and multivariate analysis of clustering results revealed the potential of Raman imaging in leukemia research, highlighting both advantages and challenges associated with global clustering.
Conflict of interest statement
The authors declare no competing financial interest.
Figures


Similar articles
-
Label-free imaging and identification of typical cells of acute myeloid leukaemia and myelodysplastic syndrome by Raman microspectroscopy.Analyst. 2015 Feb 21;140(4):1054-64. doi: 10.1039/c4an02127d. Analyst. 2015. PMID: 25568900
-
Potential use of MCR-ALS for the identification of coeliac-related biochemical changes in hyperspectral Raman maps from pediatric intestinal biopsies.Integr Biol (Camb). 2018 Jun 18;10(6):356-363. doi: 10.1039/c8ib00028j. Integr Biol (Camb). 2018. PMID: 29756143
-
Discrimination of different cancer types clustering Raman spectra by a super paramagnetic stochastic network approach.PLoS One. 2019 Mar 12;14(3):e0213621. doi: 10.1371/journal.pone.0213621. eCollection 2019. PLoS One. 2019. PMID: 30861043 Free PMC article.
-
Segmentation of confocal Raman microspectroscopic imaging data using edge-preserving denoising and clustering.Anal Chem. 2013 Jun 18;85(12):5676-83. doi: 10.1021/ac303257d. Epub 2013 Jun 5. Anal Chem. 2013. PMID: 23701523
-
Recent developments in spontaneous Raman imaging of living biological cells.Curr Opin Chem Biol. 2019 Aug;51:138-145. doi: 10.1016/j.cbpa.2019.06.004. Epub 2019 Jul 22. Curr Opin Chem Biol. 2019. PMID: 31344641 Review.
Cited by
-
Exploring Biochemical Characteristics of Pediatric Hyperdiploid Acute Lymphoblastic Leukemia by Raman Spectroscopy.Anal Chem. 2025 May 20;97(19):10319-10327. doi: 10.1021/acs.analchem.5c00410. Epub 2025 May 9. Anal Chem. 2025. PMID: 40340365 Free PMC article.
-
Raman spectroscopy on dried blood plasma allows diagnosis and monitoring of colorectal cancer.MedComm (2020). 2024 Oct 31;5(11):e774. doi: 10.1002/mco2.774. eCollection 2024 Nov. MedComm (2020). 2024. PMID: 39492836 Free PMC article.
-
Unveiling the Invisible: Multiscale Molecular Insights through Raman Imaging.Chem Biomed Imaging. 2025 Jul 4;3(8):470-472. doi: 10.1021/cbmi.5c00083. eCollection 2025 Aug 25. Chem Biomed Imaging. 2025. PMID: 40881001 Free PMC article. No abstract available.
References
-
- Arber D. A.; Orazi A.; Hasserjian R.; Thiele J.; Borowitz M. J.; Le Beau M. M.; Bloomfield C. D.; Cazzola M.; Vardiman J. W. The 2016 Revision to the World Health Organization Classification of Myeloid Neoplasms and Acute Leukemia. Blood 2016, 127 (20), 2391–2405. 10.1182/blood-2016-03-643544. - DOI - PubMed
-
- Swerdlow S. H.; Campo E.; Harris N. L.; Jaffe E. S.; Pileri S. A.; Stein H.; Thiele J.; Vardiman J. W.. WHO Classification of Tumours of Haematopoietic and Lymphoid Tissues, 4th th ed; International agency for research on cancer: Lyon, France, 2008; Vol. 2.
-
- Swerdlow S. H.; Campo E.; Harris N. L.; Jaffe E. S.; Pileri S. A.; Stein H.; Thiele J.. WHO Classification of Tumours of Haematopoietic and Lymphoid Tissues, 4th th ed; International agency for research on cancer: Lyon, France, 2017; Vol. 2.
-
- Sasada K.; Yamamoto N.; Masuda H.; Tanaka Y.; Ishihara A.; Takamatsu Y.; Yatomi Y.; Katsuda W.; Sato I.; Matsui H. Inter-Observer Variance and the Need for Standardization in the Morphological Classification of Myelodysplastic Syndrome. Leuk. Res. 2018, 69, 54–59. 10.1016/j.leukres.2018.04.003. - DOI - PubMed
-
- Alsalem M. A.; Zaidan A. A.; Zaidan B. B.; Hashim M.; Madhloom H. T.; Azeez N. D.; Alsyisuf S. A Review of the Automated Detection and Classification of Acute Leukaemia: Coherent Taxonomy, Datasets, Validation and Performance Measurements, Motivation, Open Challenges and Recommendations. Comput. Methods Programs Biomed. 2018, 158, 93–112. 10.1016/j.cmpb.2018.02.005. - DOI - PubMed
Publication types
MeSH terms
Substances
LinkOut - more resources
Full Text Sources
Medical
Research Materials
Miscellaneous

