. 2024 May 31;15(1):4663.
doi: 10.1038/s41467-024-49016-3.

Aplp1 interacts with Lag3 to facilitate transmission of pathologic α-synuclein

Affiliations

Aplp1 interacts with Lag3 to facilitate transmission of pathologic α-synuclein

Xiaobo Mao et al. Nat Commun. .

Erratum in

  • Author Correction: Aplp1 interacts with Lag3 to facilitate transmission of pathologic α-synuclein.
    Mao X, Gu H, Kim D, Kimura Y, Wang N, Xu E, Kumbhar R, Ming X, Wang H, Chen C, Zhang S, Jia C, Liu Y, Bian H, Karuppagounder SS, Akkentli F, Chen Q, Jia L, Hwang H, Lee SH, Ke X, Chang M, Li A, Yang J, Rastegar C, Sriparna M, Ge P, Brahmachari S, Kim S, Zhang S, Shimoda Y, Saar M, Liu H, Kweon SH, Ying M, Workman CJ, Vignali DAA, Muller UC, Liu C, Ko HS, Dawson VL, Dawson TM. Mao X, et al. Nat Commun. 2024 Jul 30;15(1):6413. doi: 10.1038/s41467-024-50640-2. Nat Commun. 2024. PMID: 39080298 Free PMC article. No abstract available.

Abstract

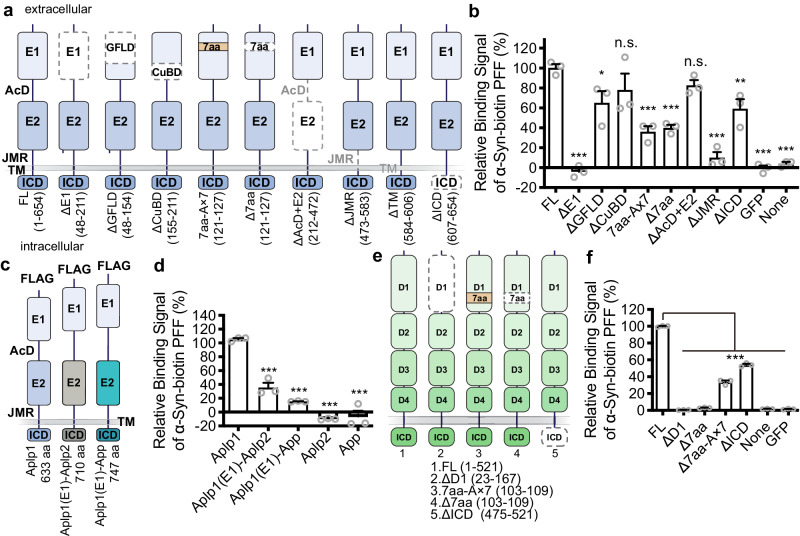
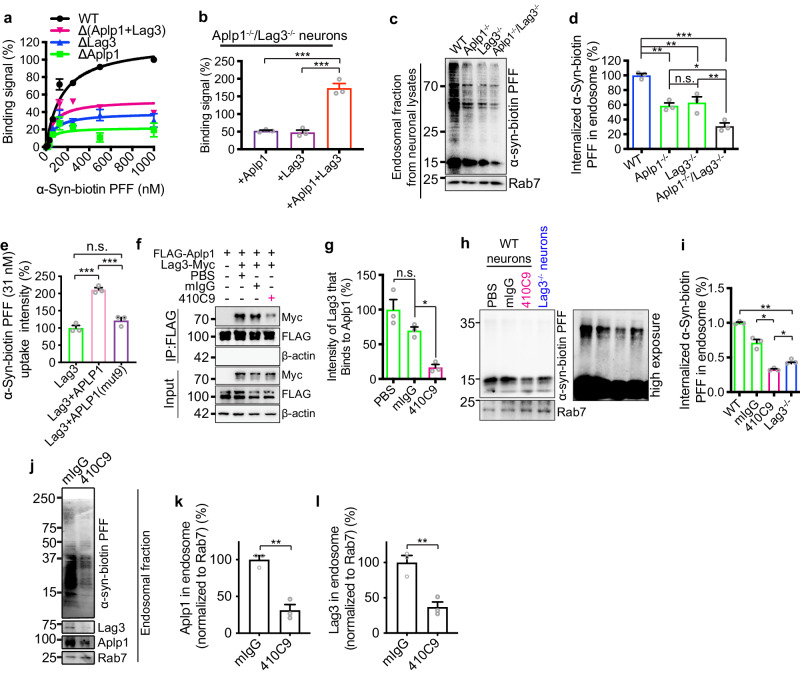
Pathologic α-synuclein (α-syn) spreads from cell-to-cell, in part, through binding to the lymphocyte-activation gene 3 (Lag3). Here we report that amyloid β precursor-like protein 1 (Aplp1) interacts with Lag3 that facilitates the binding, internalization, transmission, and toxicity of pathologic α-syn. Deletion of both Aplp1 and Lag3 eliminates the loss of dopaminergic neurons and the accompanying behavioral deficits induced by α-syn preformed fibrils (PFF). Anti-Lag3 prevents the internalization of α-syn PFF by disrupting the interaction of Aplp1 and Lag3, and blocks the neurodegeneration induced by α-syn PFF in vivo. The identification of Aplp1 and the interplay with Lag3 for α-syn PFF induced pathology deepens our insight about molecular mechanisms of cell-to-cell transmission of pathologic α-syn and provides additional targets for therapeutic strategies aimed at preventing neurodegeneration in Parkinson's disease and related α-synucleinopathies.


Conflict of interest statement

D.A.A.V. and C.J.W. have submitted patents on Lag3 that are approved or pending and are entitled to a share in net income generated from licensing of these patent rights for commercial development. Patents relate to the LAG3 aspects of this manuscript (Fig. 4, Supplementary Figs. 5, 6, and 9 are as follows: US Provisional Patent Application #60/451,039 (St Jude # SJ-02-0027)). Title: Regulating T-Cell Homeostasis. Priority date: February 28, 2003. Pardoll D, Vignali DAA, Powell J, Drake C, Huang C-T, Workman CJ. US Provisional Patent Application #60/482,143 (St Jude # SJ-03-0012 / JH # Dm-4255). Title: Modulating Regulatory T-Cell Activity via CD223. Filed: June 24, 2003. Combined and published September 16, 2004, as International Application No. WO 2004/078928 entitled ‘T-Cell Regulation’. European Patent Application No: 07021595.9; publication no: 1897548, Feb 13, 2008. Pending U.S. application for “T-cell Regulation” published Oct. 26, 2006, as Pub. No. 2006/0240024 and corresponding foreign applications pending in Canada and Japan. Patents granted in US (8551481 - issued 10/8/2013; 9005629 - issued 04/14/2015; 10787513 - issued 09/29/2020; 10934354 - issued 03/02/2021), Australia (2004217526; issued – 8/12/2010), Europe (1897548; issued – 08/14/2013), Japan (6758259; issued 09/03/2020), and Hong Kong (1114339; issued 11/22/2013). Additional applications pending in Canada (1), Europe (2), Japan (2), and the U.S. (1). The remaining authors declare no competing interests.

Figures

Fig. 1
Fig. 1. α-Syn PFF binds to Aplp1.
a Schematic diagram of Aplp1 deletions mutants: the ΔE1, ΔAcD+E2, ΔJMR (juxtamembrane region), ΔTM (transmembrane region), ΔICD (intracellular domain), two subdomain deletion mutants of ectodomain E1 (ΔGFLD and ΔCuBD), and the deletion mutant (Δ7aa) and the substitutional mutant (7aa-A × 7) of a seven-amino acid (7aa) motif. b Quantification of binding signals of deletion mutants of Aplp1 with α-syn-biotin PFF by normalization with the expression of indicated deletion mutants of Aplp1. (p-values: FL vs. ΔE1 < 0.0001, FL vs. ΔGFLD 0.0267, FL vs. ΔCuBD 0.2771, FL vs. 7aa-A × 7 < 0.0001, FL vs. Δ7aa 0.0001, FL vs. ΔAcD + E2 0.5265, FL vs. ΔJMR < 0.0001, FL vs. ΔICD 0.0076, FL vs. GFP < 0.0001, FL vs. None <0.0001). c, d Schematic diagram of Aplp1 chimeras. Quantification of binding signals of Aplp1(E1)-Aplp2 and Aplp1(E1)-App chimeras with α-syn-biotin PFF by normalization with the expression of indicated Aplp1 chimeras. (p-values: Aplp1 vs. Aplp1(E1)-Aplp2 < 0.0001, Aplp1 vs. Aplp1(E1)-App <0.0001, Aplp1 vs. Aplp2 < 0.0001, Aplp1 vs. App <0.0001). e Schematic diagram of Lag3 and deletions mutants. f Quantification of binding signals of deletion mutants of Lag3 with α-syn-biotin PFF by normalization with the expression of indicated deletion mutants of Lag3. (p-values: FL vs. ΔD1 < 0.0001, FL vs. Δ7aa < 0.0001, FL vs. Δ7aa-A × 7 < 0.0001, FL vs. ΔICD < 0.0001, FL vs. None <0.0001, FL vs. GFP < 0.0001) b, d, f ***P < 0.001, n.s. not significant. Data are the means ± SEM, from 3 individual experiments, one-way ANOVA followed by Dunnett’s correction. Source data are provided as a Source Data file.
Fig. 2
Fig. 2. Aplp1 mediates the endocytosis of α-syn PFF and subsequent pathology.
a Quantification of α-syn-pHrodo PFF endocytosis in WT and Aplp1–/– neurons control lentivirus (WT: 38 cells, Aplp1/: 40 cells) and Aplp1-lentivirus transduction (WT+Aplp1: 29 cells, Aplp1/ + Aplp1: 35 cells). n = 4 (WT, Aplp1–/–, Aplp1−/− + Aplp1); n = 3 (WT + Aplp1) independent experiments. Two-way ANOVA with Tukey’s correction. F (DFn, DFd): F (Time x Group) = F (18, 66) = 7.777; F (Time) = F (6, 66) = 143.2; F (Group) = F (3, 11) 46.15. b, c Immunoblot and quantification of α-syn-biotin PFF in the endolysosome fraction. n = 3 independent experiments. One-way ANOVA. d Quantification of the co-localization of α-syn-biotin PFF with Rab7 in WT and Aplp1–/– neurons. WT (38 cells), WT + Aplp1 (12 cells), Aplp1–/– (49 cells), Aplp1–/– + Aplp1 (13 cells) from 3 independent experiments. (p-values: WT vs. WT + Aplp1 0.0059, WT vs. Aplp1/ 0.0230, Aplp1/ vs. Aplp1/ + Aplp1 0.0024). e Quantification of co-localization of α-syn-biotin PFF and Rab7 in WT neurons transiently expressing full-length Aplp1 (FL: 25 cells) and deletion mutants: ΔE1(10 cells), ΔAcD + E2 (12 cells), ΔICD (15 cells), App (5 cells) and Aplp2 (5 cells), and control (16 cells) from 3 independent experiments. (p-values: FL vs. Control <0.0001, FL vs. ΔE1 < 0.0001, FL vs. ΔAcD + E2 0.0178, FL vs. ΔICD 0.0831, FL vs. App < 0.0001, FL vs. Aplp2 < 0.0001). f Quantification of co-localization signal of α-syn-biotin PFF in WT neurons transiently expressing Aplp1, chimeric Aplp1(E1)-Aplp2 and Aplp1(E1)-App. n = 3 independent experiments. g Immunostaining of anti-pS129 in WT and Aplp1–/– neurons expressing Aplp1 and control lentivirus, with α-syn PFF and PBS administration. Scale bar, 100 μm. h Quantification of (g). n = 3 (WT); n = 4 (WT + Aplp, Aplp1–/–, Aplp1/ + Aplp1) independent experiments. ik, Immunoblots for insoluble α-syn, pS129, soluble α-syn, and β-actin in WT and Aplp1–/– neuronal lysates post 15 days α-syn PFF treatment. n = 3 independent experiments. d, e One-way ANOVA with Dunnett’s correction. f, h, j, k One-way ANOVA with Tukey’s correction; a, c, d, e, f, h, j, k *P < 0.05, **P < 0.01, ***P < 0.001, n.s. not significant, Data are as means ± SEM. Source data are provided as a Source Data file.
Fig. 3
Fig. 3. Aplp1 and Lag3 bind to each other.
a Lag3 pulls down Aplp1 by anti-Lag3 410C9 immunoprecipitation in WT mouse brain lysates, but not in Lag3–/– lysates. b Aplp1 pulls down Lag3 by anti-Aplp1 CT11 immunoprecipitation in WT mouse brain lysates, but not in Aplp1–/– lysates. c, d Mapping of the Lag3-binding domains in Aplp1. HEK293FT cells were transfected with full-length (FL) or deletion mutants of FLAG-Aplp1, and Myc-Lag3 for co-IP experiments. The GFLD subdomain in the E1 domain of Aplp1 is the major subdomain responsible for the Lag3 interaction. e Mapping of the Aplp1-binding domains in Lag3. HEK293FT cells were transfected with FL, deletion mutants of Myc-Lag3, and FLAG-Aplp1 for co-IP experiments. Experiments in (ae) were repeated three times independently with similar results. fh Identification of the interface of A1E1 (E1 domain of APLP1) binding to L3D2 (D2 domain of LAG3). f Overlay of the 2D 1H-15N HSQC spectra of A1E1 alone (gray) and in the presence of 2 molar folds of L3D2 (blue). Four residues with significant calculated chemical shift deviations (CSDs) (> 0.03 ppm) are highlighted and enlarged in the black boxes. g Histogram of the CSDs of A1E1 in the presence of L3D2 at a molar ratio of 1:2 (A1E1/L3D2). The domain organization of A1E1 is indicated on the top, with blue boxes indicating the β-strands and the red box indicating the α-helix. A dashed line was drawn to highlight the residues with CSDs >0.01 ppm. h The 37 residues with large CSDs (>0.01 ppm) upon L3D2 titration are highlighted in blue on the ribbon diagram of the A1E1 modeled structure. i Validation of the NMR results. We substituted nine residues of APLP1 with alanine to generate FLAG-APLP1(mut9) and performed the co-IP experiment to assess the APLP1-Lag3 interaction. n = 3 independent experiments. Data are the means ± SEM, Two-tailed Student’s t-test; p-value = 0.0009. j The scheme for the interaction among Aplp1, Lag3, and α-syn PFF. Source data are provided as a Source Data file.
Fig. 4
Fig. 4. The role of Aplp1-Lag3 interaction in mediating the binding, endocytosis of α-syn PFF, and subsequent pathology.
a Aplp1 and Lag3 account for more than 40% α-syn-biotin PFF binding to cortical neurons analyzed in supplementary Fig. 6a. Data are the means ± SD. b Co-expressing Aplp1 and Lag3 in Aplp1–/–/Lag3–/– cortical neurons substantially increases binding that is greater than the sum of α-syn-biotin PFF binding to Aplp1 and Lag3. Refer to supplementary Fig. 6b. (p-values: +Aplp1 vs. +Aplp1 + Lag3 0.0001, +Lag3 vs. +Aplp1 + Lag3 < 0.0001). c, d Immunoblots of endosomal fractions from WT, Aplp1–/–, Lag3–/–, and Aplp1–/–/Lag3–/– cortical neurons. Aplp1–/–/Lag3–/– significantly decreases (~70%) internalized α-syn-biotin PFF compared to WT, Aplp1–/–, Lag3–/–, neurons. (p-values: WT vs. Aplp1/− 0.0019, WT vs. Lag3/− 0.0039, WT vs. Aplp1//Lag3/ <0.0001, Aplp1/ vs. Aplp1//Lag3/− 0.0208, Lag3/ vs. Aplp1//Lag3/− 0.0091) e, APLP1 and Lag3 co-expression by transfection increases α-syn-biotin uptake in SH-SY5Y cells compared to APLP1(mut9) expression. The biotin signal was normalized using the intensity of Lag3. Lag3 (15 cells), Lag3 + Aplp1 (14 cells), Lag3 + Aplp1(mut9) (11 cells). (p-values: Lag3 vs. Lag3 + Aplp1 < 0.0001, Lag3 vs. Lag3 + Aplp1(mut9) 0.1720, Lag3 + Aplp1 vs. Lag3+Aplp1(mut9) 0.0003). f, g Anti-Lag3 410C9 significantly disrupts the co-IP of FLAG-Aplp1 and Myc-Lag3 in HEK293FT cells. (p-values: PBS vs. mIgG 0.1304, mIgG vs. 410C9 0.0159). h, i Anti-Lag3 410C9 (330 nM) reduced the internalization of α-syn-biotin PFF (1 μM) in WT neurons compared to Lag3/ neurons. Quantification of the intensity of internalized α-syn-biotin PFF normalized by Rab7. (p-values: WT vs. Lag3/ < 0.0057, mIgG vs. 410C9 < 0.0277, 410C9 vs. Lag3/ 0.0152). jl Both the levels of the endosomal Aplp1 and Lag3 were significantly decreased by 410C9 in WT cortical neuron cultures. n = 3 independent experiments. Two-tailed Student’s t-test; p-value = 0.0019 (k), 0.0019 (l). For all experiments, n = 3 independent experiments. For graphs, b, d, e, g, i, k, l Data are the means ± SEM; b, d, e, g, i One-way ANOVA with Tukey’s correction; *P < 0.05, **P < 0.01, ***P < 0.001; n.s. not significant. Source data are provided as a Source Data file.
Fig. 5
Fig. 5. The role of Aplp1-Lag3 interaction in α-syn pathology propagation, transmission, and neurotoxicity in vitro.
a, b Aplp1-Lag3 double deletion significantly decreased (70%) pS129 immunostaining induced by α-syn PFF, compared to Aplp1–/–, Lag3–/–, or WT neurons. Scale bar, 20 μm. (p-values: WT vs. Aplp1/ 0.0016, WT vs. Lag3/ < 0.0001, WT vs. Aplp1//Lag3/ <0.0001, Aplp1/ vs. Lag3/ 0.0296, Aplp1/ vs. Aplp1//Lag3/ < 0.0001, Lag3/ vs. Aplp1//Lag3/− 0.0004). c, d Immunostaining of anti-pS129 in Aplp1–/–/Lag3–/– neurons, treated with αα-syn PFF, transduced with Aplp1, Lag3, or Aplp1 + Lag3. Scale bar, 20 μm. (p-values: +Aplp1 vs. +Aplp1 + Lag3 < 0.0001, +Lag3 vs. +Aplp1 + Lag3 < 0.0001). e Schematic of a microfluidic device with three chambers. α-Syn transmission from chamber 1 (C1) to chamber 2 (C2), to chamber 3 (C3) 14 days α-syn PFF treatment in C1. The different combinations of neurons tested in C2, listed as C1-(C2)-C3, are WT-(WT)-WT, WT-(Aplp1–/–)-WT, WT-(Lag3–/–)-WT, WT-(Aplp1–/–/Lag3–/–)-WT. fi Immunostaining images and quantification of pS129 signals in the transmission. Scale bar, 100 μm. (P-values: Chamber 2(h), WT-WT-WT vs. WT-Aplp1/-WT < 0.0001, WT-WT-WT vs. WT-Lag3/-WT < 0.0001, WT-WT-WT vs. WT-Aplp1//Lag3/-WT < 0.0001, WT-Aplp1/-WT vs. WT-Aplp1//Lag3/-WT 0.0032, WT-Lag3/-WT vs. WT-Aplp1//Lag3/-WT 0.0427; Chamber 3(i) WT-WT-WT vs. WT-Aplp1/-WT 0.0111, WT-WT-WT vs. WT-Lag3/-WT 0.0141, WT-WT-WT vs. WT-Aplp1//Lag3/-WT 0.0154). j, k PI/Hoechst staining for cell death in WT, Aplp1–/–, Lag3–/–, and Aplp1–/–/Lag3–/– cortical neuron cultures, treated with α-syn PFF. Scale bar, 100 μm. Aplp1-Lag3 deletion exhibited significantly less cell death than in Aplp1–/–, Lag3–/–, or WT cultures, treated with α-syn PFF. (p-values: PBS WT vs. PFF WT < 0.0001, PFF group: WT vs. Aplp1/ < 0.0001, WT vs. Lag3/ < 0.0001, WT vs. Aplp1//Lag3/ < 0.0001, Aplp1/ vs. Aplp1//Lag3/ <0.0001, Lag3/ vs. Aplp1//Lag3/ < 0.0001). For all experiments, n = 3 independent experiments. For graphs, Data are the means ± SEM. One-way ANOVA with Turkey’s correction. *P < 0.05, **P < 0.01, ***P < 0.001, n.s. not significant. Source data are provided as a Source Data file.
Fig. 6
Fig. 6. Roles of Aplp1 and the Aplp1-Lag3 interaction in mediating α-syn PFF-induced neurodegeneration in vivo.
a Representative TH (tyrosine hydroxylase) immunohistochemistry and Nissl staining images of dopamine (DA) neurons in the SNpc of α-syn PFF-injected hemisphere in the WT, Aplp1–/–, and Aplp1–/–/Lag3–/– mice. b Stereological counting of TH- and Nissl-positive neurons in the substantia nigra after 6 months of α-syn PFF injection (WT: n = 7; Aplp1–/–: n = 7; Aplp1–/–/Lag3–/–: n = 7). c DA concentrations in the striatum of PBS and α-syn PFF-injected mice measured at 180 days by HPLC. n = 8 mice per group, two-way ANOVA with Sidak’s correction. d, e Representative images, and quantification of pS129 positive inclusions in the substantia nigra of WT, Aplp1–/–, and Aplp1–/–/Lag3–/– mice. (n = 6, each group). f Distribution of LB/LN-like pathology in the brain sections of α-syn PFF-injected WT, Aplp1–/–, and Aplp1–/–/Lag3–/– mice (pS129 positive neuron, red dots; pS129 positive neurites, red lines). g, h Representative images of LB/LN-like pathology (the black box in h) and the quantification of pS129 intensity (green) from each coronal section (1–4) stained with pS129. (n = 6, each group). i, j Assessments of the behavioral deficits measured by the pole test (WT: n = 13; Aplp1–/–: n = 13; Aplp1–/–/Lag3–/–: n = 7) and cylinder test (n = 10, each group). (p-values: for pole test (i), PBS WT vs. PFF WT < 0.0001, PFF WT vs. PFF Aplp1/ < 0.0010, PFF WT vs. PFF Aplp1/Lag3/ < 0.0001, PFF Aplp1/ vs. PFF Aplp1/Lag3/ < 0.0312; For cylinder test (j): PBS WT vs. PFF WT < 0.0001, PFF WT vs. PFF Aplp1/− 0.0004, PFF WT vs. PFF Aplp1//Lag3/ < 0.0001, PFF Aplp1/ vs. PFF Aplp1//Lag3/− 0.0304). For graphs, e, h One-way ANOVA with Tukey’s correction; b, j Two-way ANOVA with Tukey’s correction; Data are the means ± SEM, *P < 0.05. **P < 0.01. ***P < 0.001. n.s. not significant. Source data are provided as a Source Data file.
Fig. 7
Fig. 7. The role of anti-Lag3 in blocking α-syn PFF-induced neurodegeneration in vivo.
a Representative images of TH and Nissl staining of SNpc DA neurons of WT mice treated with mIgG or 410C9 at 6 months after intrastriatal injection of α-syn PFF. b Stereology counts of data are the means ± SEM, (mIgG-PBS: n = 5; 410C9-PBS: n = 5; mIgG-PFF: n = 4; 410C9-PFF: n = 5). One-way ANOVA with Turkey’s correction. (p-values: for Nissl: PBS mIgG vs. PFF mIgG 0.0022, PFF mIgG vs. PFF 410C9 0.0301, for TH: PBS mIgG vs. PFF mIgG <0.0001, PFF mIgG vs. PFF 410C9 0.0311) *P < 0.05, **P < 0.01, ***P < 0.001. c DA concentrations in the striatum of α-syn PFF or PBS-injected mice treated with 410C9 or mIgG measured at 6 months by HPLC-ECD (high-performance liquid chromatography-electrochemical detection). (mIgG-PBS: n = 4; 410C9-PBS: n = 4; mIgG-PFF: n = 3; 410C9-PFF: n = 4), Data are the means ± SEM, Two-way ANOVA with Tukey’s correction; (p-values: PBS mIgG vs. PFF mIgG 0.0050, PFF mIgG vs. PFF 410C9 0.0111). dg Behavioral deficits were ameliorated by 410C9. Six months after α-syn PFF injection, the grip strength test and pole test were performed. Behavioral abnormalities in the grip strength test and pole test induced by α-syn PFF were ameliorated by 410C9 treatment (one day after stereotaxic injection). (mIgG-PBS: n = 8; 410C9-PBS: n = 8; mIgG-PFF: n = 8; 410C9-PFF: n = 9). Data are the means ± SEM, one-way ANOVA with Dunnett’s correction; (p-values: d PBS mIgG vs. PBS 410C9 0.9970 PBS, mIgG vs. PFF mIgG 0.0001, PFF mIgG vs. PFF 410C9 0.0001; e PBS mIgG vs. PBS 410C9 0.9655 PBS, mIgG vs. PFF mIgG 0.0001, PFF mIgG vs. PFF 410C9 0.0001; f PBS mIgG vs. PBS 410C9 0.9986 PBS, mIgG vs. PFF mIgG 0.0089, PFF mIgG vs. PFF 410C9 0.0179; g PBS mIgG vs. PBS 410C9 0.5869 PBS, mIgG vs. PFF mIgG 0.0057, PFF mIgG vs. PFF 410C9 0.0026). *P < 0.05, **P < 0.01, ***P < 0.001. Source data are provided as a Source Data file.

References

    1. Barker, R. A. & Williams-Gray, C. H. Review: the spectrum of clinical features seen with alpha synuclein pathology. Neuropathol. Appl. Neurobiol.42, 6–19 (2016). - PubMed
    1. Braak, H. et al. Staging of brain pathology related to sporadic Parkinson’s disease. Neurobiol. Aging24, 197–211 (2003). - PubMed
    1. Kordower, J. H., Chu, Y., Hauser, R. A., Freeman, T. B. & Olanow, C. W. Lewy body-like pathology in long-term embryonic nigral transplants in Parkinson’s disease. Nat. Med.14, 504–506 (2008). - PubMed
    1. Li, W. et al. Extensive graft-derived dopaminergic innervation is maintained 24 years after transplantation in the degenerating parkinsonian brain. Proc. Natl Acad. Sci. USA113, 6544–6549 (2016). - PMC - PubMed
    1. Li, J. Y. et al. Lewy bodies in grafted neurons in subjects with Parkinson’s disease suggest host-to-graft disease propagation. Nat. Med14, 501–503 (2008). - PubMed

MeSH terms

Grants and funding