. 2024 May 31;15(1):4650.
doi: 10.1038/s41467-024-48620-7.

The chromatin landscape of pathogenic transcriptional cell states in rheumatoid arthritis

Collaborators, Affiliations

The chromatin landscape of pathogenic transcriptional cell states in rheumatoid arthritis

Kathryn Weinand et al. Nat Commun. .

Abstract

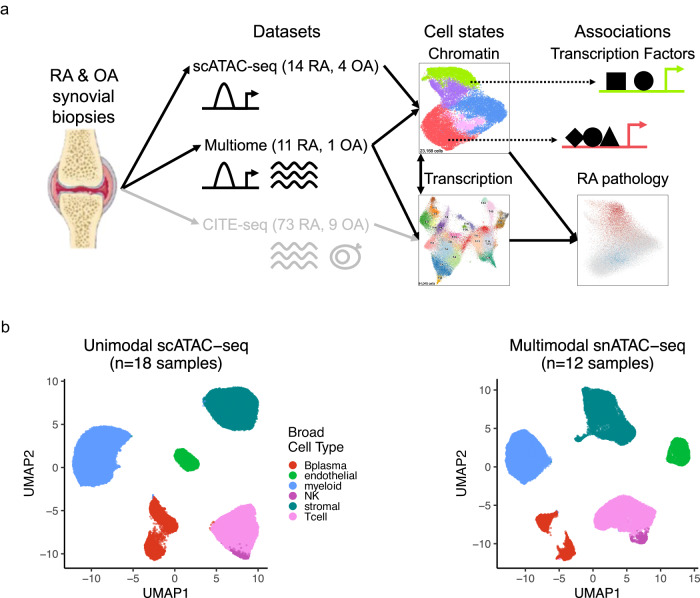
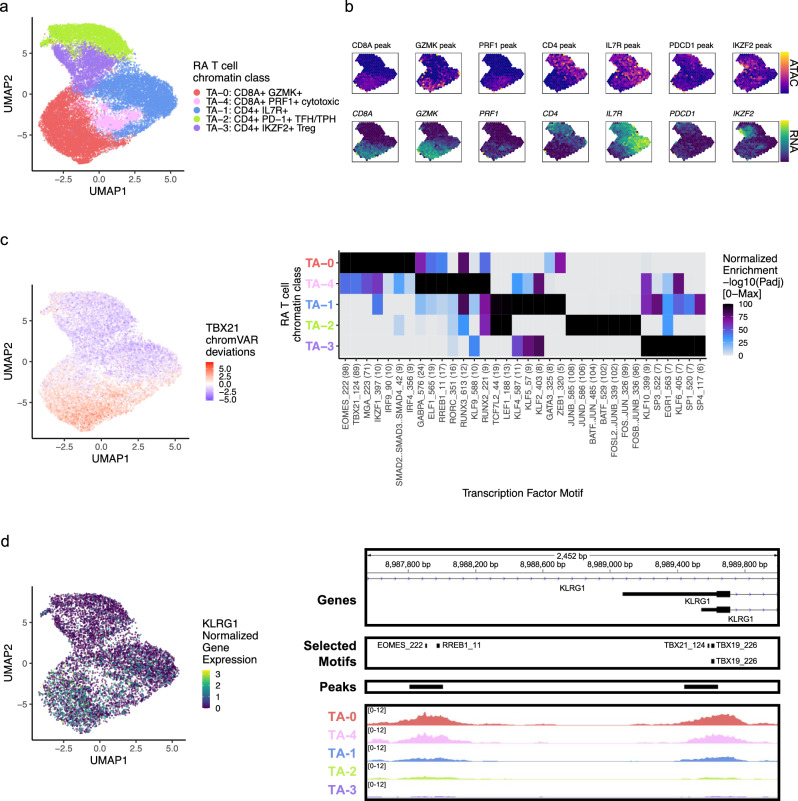
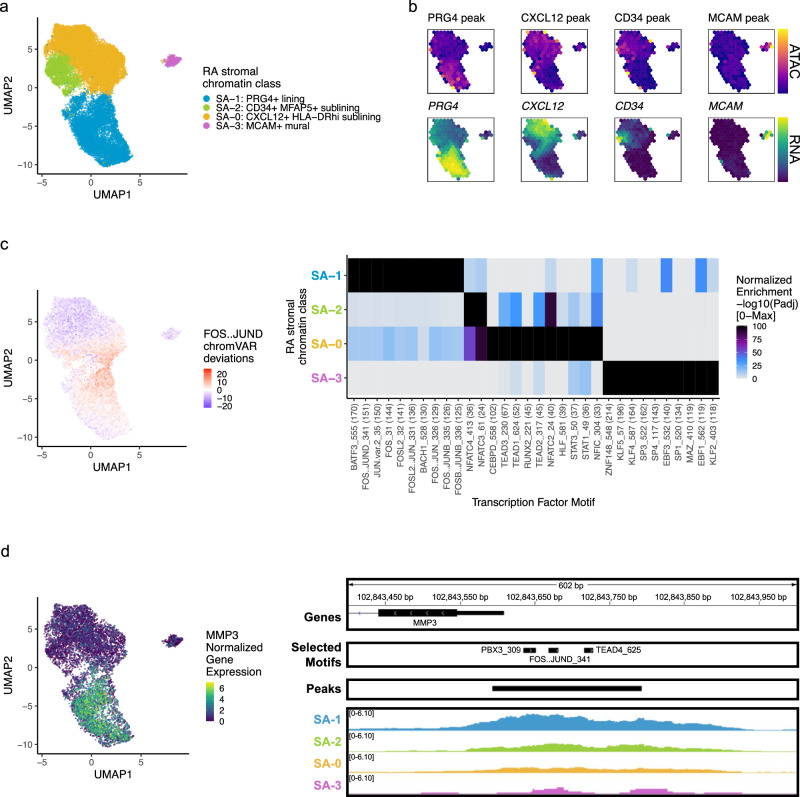
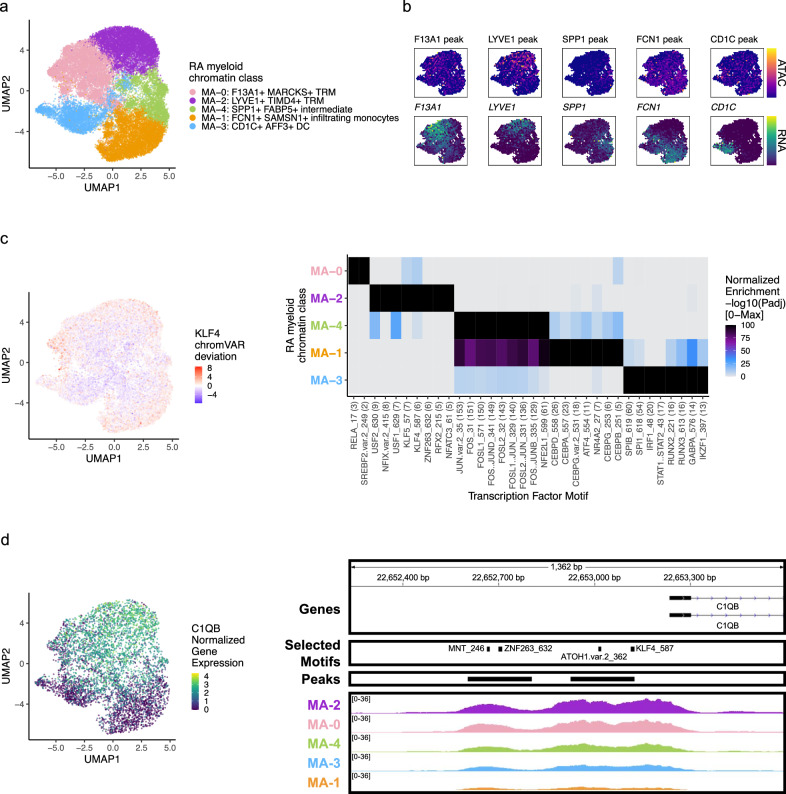
Synovial tissue inflammation is a hallmark of rheumatoid arthritis (RA). Recent work has identified prominent pathogenic cell states in inflamed RA synovial tissue, such as T peripheral helper cells; however, the epigenetic regulation of these states has yet to be defined. Here, we examine genome-wide open chromatin at single-cell resolution in 30 synovial tissue samples, including 12 samples with transcriptional data in multimodal experiments. We identify 24 chromatin classes and predict their associated transcription factors, including a CD8 + GZMK+ class associated with EOMES and a lining fibroblast class associated with AP-1. By integrating with an RA tissue transcriptional atlas, we propose that these chromatin classes represent 'superstates' corresponding to multiple transcriptional cell states. Finally, we demonstrate the utility of this RA tissue chromatin atlas through the associations between disease phenotypes and chromatin class abundance, as well as the nomination of classes mediating the effects of putatively causal RA genetic variants.


Conflict of interest statement

S.R. is a founder for Mestag Therapeutics, a scientific advisor for Janssen, Sonoma, and Pfizer. D.A.R. reports personal fees from Pfizer, Janssen, Merck, GlaxoSmithKline, AstraZeneca, Scipher Medicine, HiFiBio, and Bristol-Myers Squibb, and grant support from Merck, Janssen, and Bristol-Myers Squibb outside the submitted work. D.A.R. is a co-inventor on the patent for TPH cells as a biomarker of autoimmunity. The remaining authors declare no competing interests.

Figures

Fig. 1
Fig. 1. Study overview and open chromatin broad cell type identification.
a Study overview. Synovial biopsy specimens from RA and OA patients were utilized for unimodal scATAC-seq and multimodal snATAC-seq + snRNA-seq experiments. CITE-seq on similar specimens was performed in the AMP-RA reference study. We defined chromatin classes using the unimodal scATAC-seq and multimodal snATAC-seq data and compared them with AMP-RA transcriptional cell states classified onto the multiome cells. We further defined transcription factors likely regulating these chromatin classes and found putative links to RA pathology by associating the classes to RA clinical metrics, RA subtypes, and putative RA risk variants. b Open chromatin broad cell type identification in unimodal scATAC-seq datasets (left) and multimodal snATAC-seq datasets (right) visualized on a UMAP, processed separately. Parts of Fig. 1a were generated using Servier Medical Art, provided by Servier, licensed under a Creative Commons Attribution 3.0 unported license.
Fig. 2
Fig. 2. RA T cell chromatin classes.
a UMAP colored by 5 T cell chromatin classes defined from unimodal scATAC-seq and multimodal snATAC-seq cells. b Mean binned normalized marker peak accessibility (top; yellow (high) to purple (low)) and gene expression (bottom; yellow (high) to blue (low)) for multimodal snATAC-seq cells on UMAP. c UMAP colored by chromVAR deviations for the TBX21 motif (left). Most significantly enriched motifs in class-specific peaks per T cell chromatin class (right). To be included per class, motifs had to be enriched in the class above a minimal threshold, and corresponding TFs had to have at least minimal expression in snRNA-seq. Color scale normalized per motif across classes with max −log10(padj) value shown in parentheses in motif label. P values were calculated via hypergeometric test in ArchR. d UMAP colored by KLRG1 normalized gene expression in multiome cells (left). KLRG1 locus (chr12:8,987,550–8,990,000) with selected gene isoforms, motifs, open chromatin peaks, and chromatin accessibility reads from unimodal and multiome cells aggregated by chromatin class and scaled by read counts per class (right).
Fig. 3
Fig. 3. RA stromal chromatin classes.
a UMAP colored by 4 stromal chromatin classes defined from unimodal scATAC-seq and multimodal snATAC-seq cells. b Mean binned normalized marker peak accessibility (top; yellow (high) to purple (low)) and gene expression (bottom; yellow (high) to blue (low)) for multimodal snATAC-seq cells on UMAP. c UMAP colored by chromVAR deviations for the FOS::JUND motif (left). Most significantly enriched motifs in class-specific peaks per stromal chromatin class (right). To be included per class, motifs had to be enriched in the class above a minimal threshold, and corresponding TFs had to have at least minimal expression in snRNA-seq. Color scale normalized per motif across classes with max −log10(padj) value shown in parentheses in motif label. P values were calculated via hypergeometric test in ArchR. d UMAP colored by MMP3 normalized gene expression (left). MMP3 locus (chr11:102,843,400–102,844,000) with selected gene isoforms, motifs, open chromatin peaks, and chromatin accessibility reads from unimodal and multiome cells aggregated by chromatin class and scaled by read counts per class (right).
Fig. 4
Fig. 4. RA myeloid chromatin classes.
a UMAP colored by 5 myeloid chromatin classes defined from unimodal scATAC-seq and multimodal snATAC-seq cells. b Mean binned normalized marker peak accessibility (top; yellow (high) to purple (low)) and gene expression (bottom; yellow (high) to blue (low)) for multimodal snATAC-seq cells on UMAP. c UMAP colored by chromVAR deviations for the KLF4 motif (left). Most significantly enriched motifs in class-specific peaks per myeloid chromatin class (right). To be included per class, motifs had to be enriched in the class above a minimal threshold, and corresponding TFs had to have at least minimal expression in snRNA-seq. Color scale normalized per motif across classes with max −log10(padj) value shown in parentheses in motif label. P values were calculated via hypergeometric test in ArchR. d UMAP colored by C1QB normalized gene expression (left). C1QB locus (chr1: 22,652,235–22,653,595) with selected gene isoforms, motifs, open chromatin peaks, and chromatin accessibility reads from unimodal and multiome cells aggregated by chromatin class and scaled by read counts per class (right).
Fig. 5
Fig. 5. RA B/plasma chromatin classes.
a UMAP colored by 6 B/plasma chromatin classes defined from unimodal scATAC-seq and multimodal snATAC-seq cells. b Mean binned normalized marker peak accessibility (top; yellow (high) to purple (low)) and gene expression (bottom; yellow (high) to blue (low)) for multimodal snATAC-seq cells on UMAP. c UMAP colored by chromVAR deviations for the SP3 motif (left). Most significantly enriched motifs in class-specific peaks per B/plasma chromatin class (right). To be included per class, motifs had to be enriched in the class above a minimal threshold, and corresponding TFs had to have at least minimal expression in snRNA-seq. Color scale normalized per motif across classes with max −log10(padj) value shown in parentheses in motif label. P values were calculated via hypergeometric test in ArchR. d UMAP colored by PRDM1 normalized gene expression (left). PRDM1 locus (chr6:106,082,865−106,111,658) with selected gene isoforms, motifs, open chromatin peaks, and chromatin accessibility reads from unimodal and multiome cells aggregated by chromatin class and scaled by read counts per class (right).
Fig. 6
Fig. 6. RA endothelial chromatin classes.
a UMAP colored by 4 endothelial chromatin classes defined from unimodal scATAC-seq and multimodal snATAC-seq cells. b Mean binned normalized marker peak accessibility (top; yellow (high) to purple (low)) and gene expression (bottom; yellow (high) to blue (low)) for multimodal snATAC-seq cells on UMAP. c UMAP colored by chromVAR deviations for the SOX17 motif (left). Most significantly enriched motifs in class-specific peaks per endothelial chromatin class (right). To be included per class, motifs had to be enriched in the class above a minimal threshold, and corresponding TFs had to have at least minimal expression in snRNA-seq. Color scale normalized per motif across classes with max −log10(padj) value shown in parentheses in motif label. P values were calculated via hypergeometric test in ArchR. EA−3 is not shown because only 1 class-specific peak was found, likely due to low cell counts. d UMAP colored by NES normalized gene expression (left). NES locus (chr1: 156,675,398–156,680,400) with selected gene isoforms, motifs, open chromatin peaks, and chromatin accessibility reads from unimodal and multiome cells aggregated by chromatin class and scaled by read counts per class (right).
Fig. 7
Fig. 7. A chromatin class encompassed multiple transcriptional cell states in proposed superstate model.
ac For a T, b stromal, and c myeloid cells, chromatin class UMAP colored by the classified AMP-RA reference transcriptional cell states for multiome cells (left) and the natural log of the odds ratio between the chromatin classes and transcriptional cell states (right). On the right, non-significant values (FDR < 0.05) are white, and the colors of the y axis labels correspond to the colors in the UMAPs on the left. In c, the M-13: pDC transcriptional cell state was excluded as fewer than 10 cells were classified into it. d, e Using genes and promoter peak pairs with at least minimal signal, the two-sided Wilcoxon −log10(FDR) of normalized gene expression (x axis) and the logistic regression LRT −log10(FDR) of binary promoter peak accessibility (y axis) between d RA PBMC CD25hi and CD25int Treg populations (n = 7208 pairs) and e RA PBMC TFH and TPH populations (n = 5264 pairs). Color was determined by the state with the higher gene expression and the shape denotes whether the state with the higher chromatin accessibility agreed. The dotted lines correspond to FDR = 0.10, calculated separately within modalities.
Fig. 8
Fig. 8. Linking RA chromatin classes to RA pathology.
a For each donor of the 14 donors shared between the unimodal scATAC-seq and AMP-RA reference studies with at least 200 T cells, the Pearson correlation coefficient (R) and two-sided p value (P) between the relative proportions of T cell chromatin classes defined in the unimodal scATAC-seq datasets (x axis) and classified into in the CITE-seq datasets through the multiome cells (y axis). b CNA correlations between myeloid cell neighborhoods and lymphoid density in AMP-RA reference myeloid cells visualized on chromatin class UMAP (top; two-sided global P = 0.005) and aggregated by classified myeloid chromatin classes (bottom). On the top, cells not passing the FDR threshold were colored grey. On the bottom, FDR thresholds shown in dotted black lines. c CNA correlations between T cell neighborhoods and CTAP-TB in AMP-RA reference T cells visualized on chromatin class UMAP (top; two-sided global P = 0.046) and aggregated by classified T cell chromatin classes (bottom). On the top, cells not passing the FDR threshold were colored grey. On the bottom, FDR thresholds shown in dotted black lines. d Scaled mean normalized chromatin accessibility for peaks that overlap putatively causal RA risk variants across chromatin classes in unimodal and multimodal datasets. Additional information is in Supplementary Table 5. e rs798000 locus, zoomed in (chr1: 116,735,799–116,740,800) (top) and zoomed out (chr1: 116,658,581–116,775,106) (bottom) with selected gene isoforms, SNPs, open chromatin peaks, and chromatin accessibility reads aggregated by chromatin class and scaled by read counts per class. STAT1/2 motif was downloaded from JASPAR ID MA0517.1 and is not to scale, but it is aligned to the SNP-disrupting motif position.

Update of

Similar articles

Cited by

References

    1. Smolen JS, et al. Rheumatoid arthritis. Nat. Rev. Dis. Prim. 2018;4:1–23. - PubMed
    1. Smolen JS, Aletaha D, McInnes IB. Rheumatoid arthritis. Lancet. 2016;388:2023–2038. doi: 10.1016/S0140-6736(16)30173-8. - DOI - PubMed
    1. Han B, et al. Fine mapping seronegative and seropositive rheumatoid arthritis to shared and distinct HLA alleles by adjusting for the effects of heterogeneity. Am. J. Hum. Genet. 2014;94:522–532. doi: 10.1016/j.ajhg.2014.02.013. - DOI - PMC - PubMed
    1. Padyukov L. Genetics of rheumatoid arthritis. Semin. Immunopathol. 2022;44:47–62. doi: 10.1007/s00281-022-00912-0. - DOI - PMC - PubMed
    1. Viatte S, Barton A. Genetics of rheumatoid arthritis susceptibility, severity, and treatment response. Semin. Immunopathol. 2017;39:395–408. doi: 10.1007/s00281-017-0630-4. - DOI - PMC - PubMed

MeSH terms

Grants and funding