. 2024 May 31;15(1):4653.
doi: 10.1038/s41467-024-47547-3.

Representation of genomic intratumor heterogeneity in multi-region non-small cell lung cancer patient-derived xenograft models

Collaborators, Affiliations

Representation of genomic intratumor heterogeneity in multi-region non-small cell lung cancer patient-derived xenograft models

Robert E Hynds et al. Nat Commun. .

Abstract

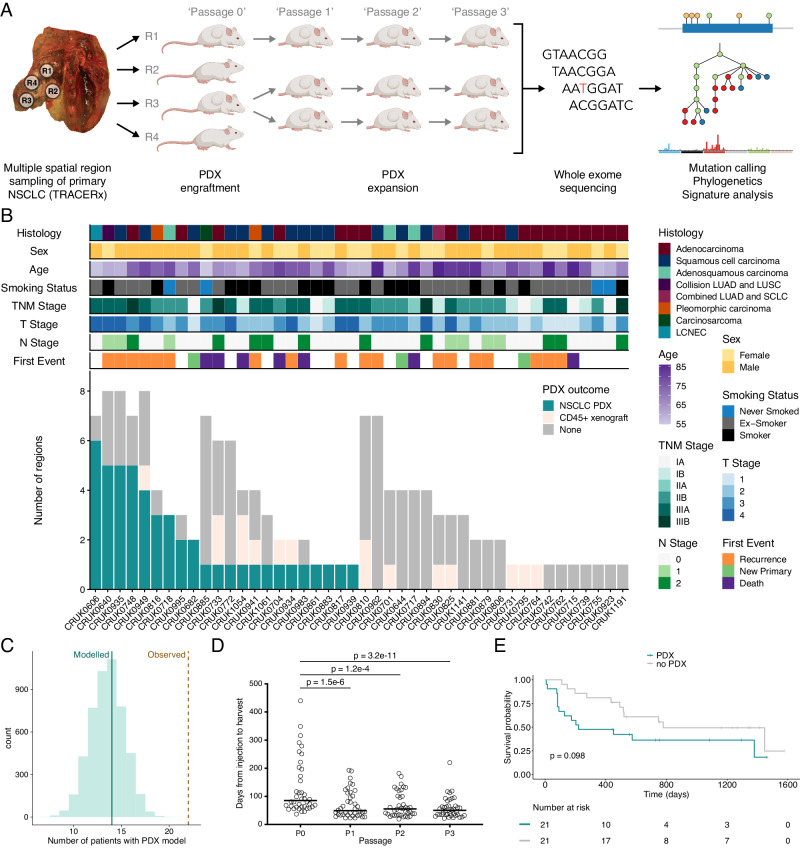
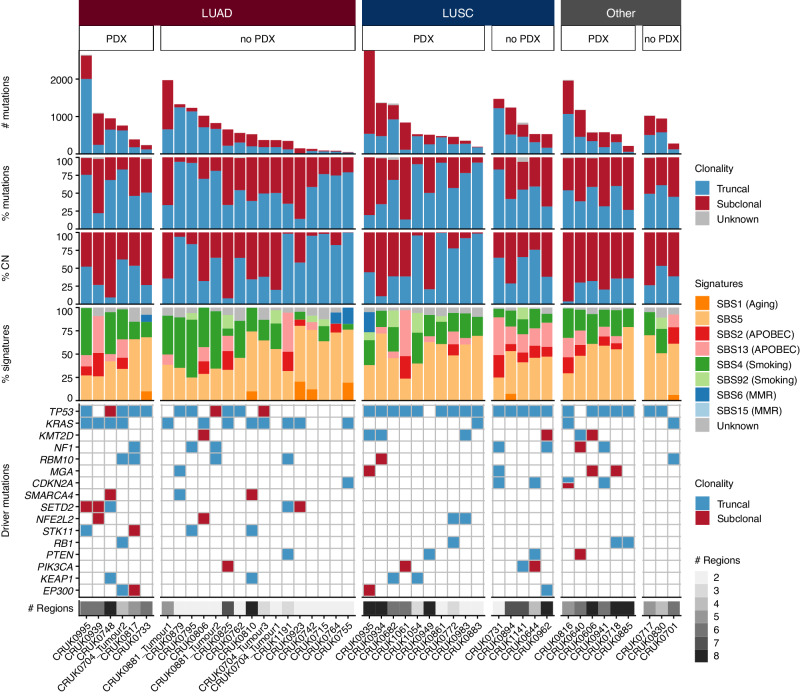
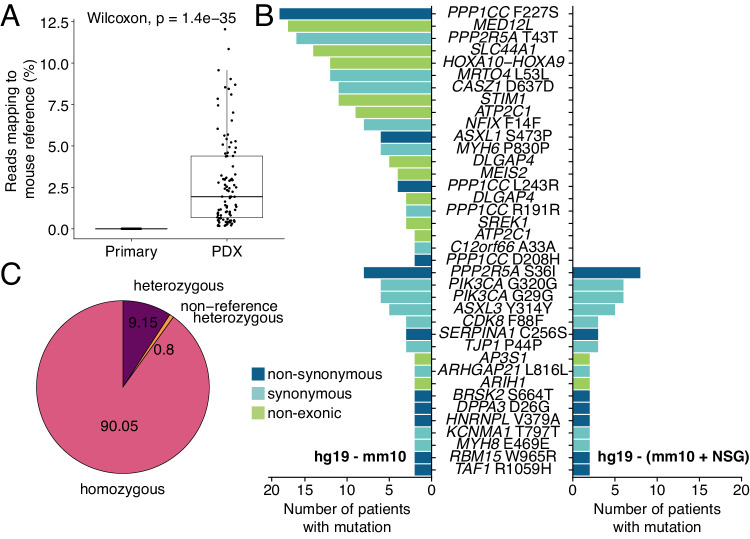
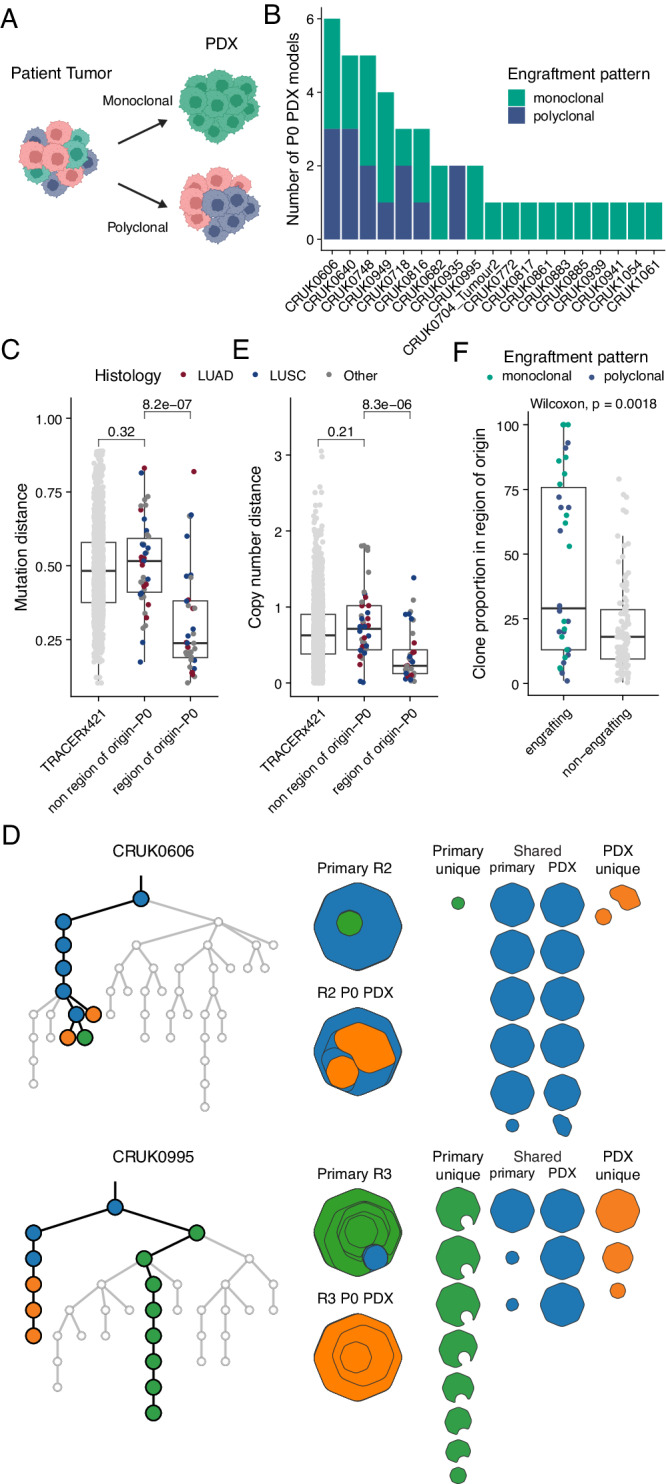
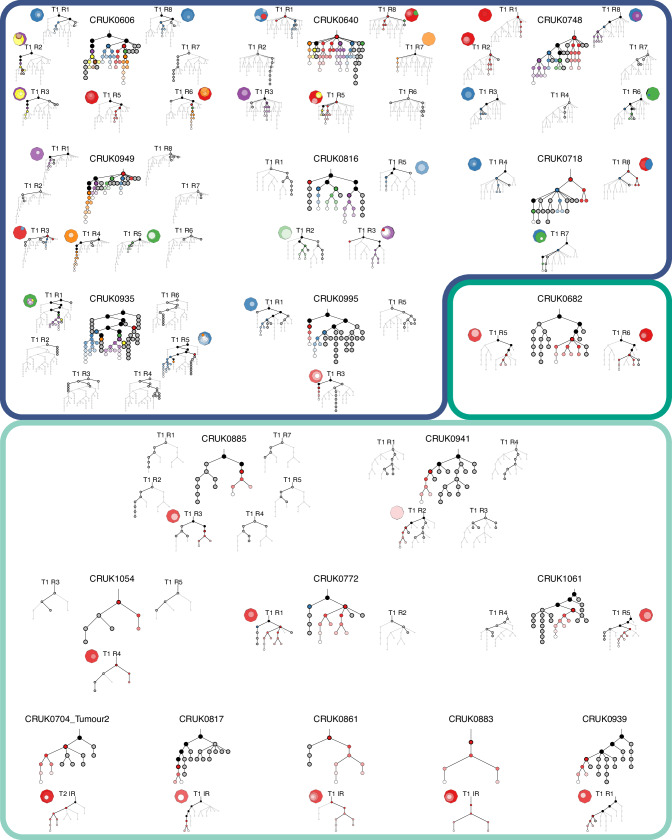
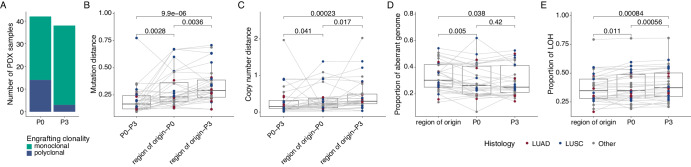
Patient-derived xenograft (PDX) models are widely used in cancer research. To investigate the genomic fidelity of non-small cell lung cancer PDX models, we established 48 PDX models from 22 patients enrolled in the TRACERx study. Multi-region tumor sampling increased successful PDX engraftment and most models were histologically similar to their parent tumor. Whole-exome sequencing enabled comparison of tumors and PDX models and we provide an adapted mouse reference genome for improved removal of NOD scid gamma (NSG) mouse-derived reads from sequencing data. PDX model establishment caused a genomic bottleneck, with models often representing a single tumor subclone. While distinct tumor subclones were represented in independent models from the same tumor, individual PDX models did not fully recapitulate intratumor heterogeneity. On-going genomic evolution in mice contributed modestly to the genomic distance between tumors and PDX models. Our study highlights the importance of considering primary tumor heterogeneity when using PDX models and emphasizes the benefit of comprehensive tumor sampling.


Conflict of interest statement

D.A.M. reports speaker fees from AstraZeneca, Eli Lilly, BMS and Takeda, consultancy fees from AstraZeneca, Thermo Fisher, Takeda, Amgen, Janssen, MIM Software, Bristol-Myers Squibb and Eli Lilly and has received educational support from Takeda and Amgen. C.S. acknowledges grants from AstraZeneca, Boehringer-Ingelheim, Bristol Myers Squibb, Pfizer, Roche-Ventana, Invitae (previously Archer Dx Inc. - collaboration in minimal residual disease sequencing technologies), Ono Pharmaceutical, and Personalis. He is chief investigator for the AZ MeRmaiD 1 and 2 clinical trials and is the steering committee chair. He is also co-chief investigator of the NHS Galleri trial funded by GRAIL and a paid member of GRAIL’s Scientific Advisory Board. He receives consultant fees from Achilles Therapeutics (also a scientific advisory board (SAB) member), Bicycle Therapeutics (also a SAB member), Genentech, Medicxi, China Innovation Centre of Roche (CICoR) formerly Roche Innovation Centre – Shanghai, Saga Diagnostics SAB member, Metabomed (until July 2022), Relay Therapeutics SAB member, and the Sarah Cannon Research Institute. C.S has received honoraria from Amgen, AstraZeneca, Bristol Myers Squibb, GlaxoSmithKline, Illumina, MSD, Novartis, Pfizer, and Roche-Ventana. C.S. has previously held stock options in Apogen Biotechnologies and GRAIL, and currently has stock options in Epic Bioscience, Bicycle Therapeutics, and has stock options and is co-founder of Achilles Therapeutics. S.V. is a co-inventor to a patent of methods for detecting molecules in a sample (U.S. patent no. 10578620; Methods for detecting molecules in a sample). C.S declares a patent application (PCT/US2017/028013; Methods for lung cancer detection) for methods to lung cancer; targeting neoantigens (PCT/EP2016/059401; Method for treating cancer); identifying patent response to immune checkpoint blockade (PCT/EP2016/071471; “Immune checkpoint intervention” in cancer), determining HLA LOH (PCT/GB2018/052004; Analysis of HLA alleles in tumors and the uses thereof); predicting survival rates of patients with cancer (PCT/GB2020/050221; Method of predicting survival rates for cancer patients), identifying patients who respond to cancer treatment (PCT/GB2018/051912; Method for identifying responders to cancer treatment); methods for lung cancer detection (US20190106751A1; Methods for lung cancer detection); methods for systems and tumor monitoring (PCT/EP2022/077987; Methods and systems for tumor monitoring). C.S. is an inventor on a European patent application (PCT/GB2017/053289; Method of detecting tumor recurrence) relating to assay technology to detect tumor recurrence. This patent has been licensed to a commercial entity and under their terms of employment C.S is due a revenue share of any revenue generated from such license(s). The remaining authors declare no competing interests.

Figures

Fig. 1
Fig. 1. Lung TRACERx patient-derived xenograft (PDX) cohort overview.
A Schematic of the study protocol to derive and expand PDX models within the lung TRACERx study. B Outcomes of regional non-small cell lung cancer (NSCLC) tumor tissue engraftment in NSG mice, including patient characteristics. C Downsampling to one engraftment attempt for each patient. Green line indicates median modeled number of patients with a PDX model following a single engraftment attempt, brown dashed line indicates the observed number of patients for whom PDX models were derived with a multi-region sampling approach. D Time from tumor injection to PDX harvest by passage number. Only PDX models for which complete P0-P3 data were available are shown (n = 40 PDX models at each passage). Bar shows median time for all models. Two-sided Friedman test with Dunn’s test for multiple comparisons, p values as indicated. E Disease-free survival over a 1600 day period following tumor resection is shown grouped by the generation (PDX) or not (no PDX) of at least one regional NSCLC PDX model for each patient. Log rank test, p value as indicated. LUAD—lung adenocarcinoma; LUSC—lung squamous cell carcinoma; SCLC—small cell lung cancer; LCNEC—large cell neuroendocrine carcinoma.
Fig. 2
Fig. 2. Genomic characteristics of primary tumors.
Patient primary tumors (n patients = 43; n tumors = 46) are split based on histology and subsequently whether a PDX model was generated from any tumor region (PDX) or not (no PDX). Within each category, tumors are ordered according to their total mutation burden. Top panel: total number of coding and non-coding mutations including single nucleotide variants (SNVs), dinucleotide and indel alterations. Bars are colored by the clonality status of alterations. Second panel: proportion of truncal and subclonal mutations. Third panel: proportion of copy number alterations that were truncal or subclonal. Fourth panel: proportion of mutational signatures as estimated across all mutations. Bottom panel: driver alterations on a per tumor basis. The genes shown are mutated in more than three tumors in this patient cohort. Mutations are colored by the clonal status of alterations. LUAD—lung adenocarcinoma; LUSC—lung squamous cell carcinoma; CN—copy number; MMR—mismatch repair.
Fig. 3
Fig. 3. An NSG-adapted mouse reference genome.
A Detection of mouse DNA contamination in PDX model whole-exome sequencing (WES) data using FastQ Screen (n primary regions = 108, n PDX samples = 99). The box plot represents the upper and lower quartiles (box limits), the median (center line) and the whiskers span 1.5*IQR. Two-sided Wilcoxon rank sum test, p value as indicated. B Overview of PDX-unique non-driver mutations called in PDX models from two or more patients after using the mm10 reference genome (GRCm38; left) or a NOD scid gamma mouse-adapted (NSG-adapted) reference genome (right) for mouse WES read removal. C Percentage of genome-wide single nucleotide polymorphisms (total = 7,333,533) identified as non-concordant in whole-genome sequencing data from an NSG mouse, compared to the mm10 (GRCm38) reference genome.
Fig. 4
Fig. 4. Genomic comparison of primary tumor region-early passage PDX model pairs.
A Schematic representation of engraftment patterns. B Overview of engraftment patterns (monoclonal, green; polyclonal, blue) for each unique P0 PDX sample (for which WES data were available) stacked by tumor. C Mutational distance between regions within each primary tumor in the lung TRACERx421 cohort (n = 1426 regions), P0 PDX models and other regions of their primary tumor (n = 42 regions), and P0 PDX models and their respective region of origin (n = 36 regions). D Examples of phylogenetic trees (left) and clonal composition (right) of P0 PDX models and their regions of origin. Highlighted branches of the phylogenetic trees are those found only in the PDX models (orange), only in the region of origin (primary; green) or both (shared; blue). Clonal composition is shown as clone maps (left: stacked, right: individual clones) where each octagon corresponds to a clone from the phylogenetic tree that is present within the sample. The regions with lowest (upper: CRUK0606 R2) and greatest (lower: CRUK0995 R3) mutational distances between the region of origin and matched PDX model are shown. E Copy number distance between regions within each primary tumor in the lung TRACERx421 cohort (n = 1424 regions), P0 PDX models and other regions of their primary tumor (n = 42 regions), and P0 PDX models and their respective region of origin (n = 36 regions). F Clone proportions of engrafting (n = 34) and non-engrafting (n = 94) clones, excluding ancestral clones that were not detected, within 36 primary tumor regions of origin for which data were available. Dots are colored by the overall engraftment pattern of the P0 PDX models. C, E, F The box plots represent the upper and lower quartiles (box limits), the median (center line) and the whiskers span 1.5*IQR. Two-sided Wilcoxon rank sum test, p values as indicated. LUAD—lung adenocarcinoma; LUSC—lung squamous cell carcinoma.
Fig. 5
Fig. 5. Representation of multiple primary tumor subclones in multi-region PDX models.
An overview of phylogenetic trees (based on all primary tumor region and PDX data) and subclonal composition of the P0 PDX models is shown for each tumor that underwent whole-exome sequencing. Nine cases with multiple region-specific PDX models are shown (top). Eight of these cases have multiple primary tumor clones engrafting in the PDX models (blue border), while in one case both PDX models were engrafted by the same clone (green border). A further ten cases had a single PDX model per tumor which was engrafted by a single tumor clone (light green border, bottom). For each case, a phylogenetic tree constructed from primary tumor data and all PDX samples is shown in the center. Regional phylogenetic trees are shown for regions with attempted PDX engraftments highlighting clusters that were present in the primary tumor region of origin and/or the matched PDX model. Black - shared clusters between primary tumor (main tree), or primary tumor region of origin (regional trees) and PDX model; gray - primary tumor specific clusters (or primary tumor region specific); colors (red, blue, green, purple, orange) indicate independent engrafting clusters, and subsequent diversification in the PDX models is indicated by a gradient of each color (to white). Clusters highlighted with a bold black border were present (either detectable as clones or ancestral) in the primary tumor (main tree) or primary tumor region of origin (regional trees) while the other clusters are either PDX-specific or below the limit of detection in the primary tumor. Additionally, for each PDX model a clone map illustrates the clonal composition of the P0 PDX sample. T—tumor; R—region.
Fig. 6
Fig. 6. On-going evolution in PDX models.
A Overview of engraftment patterns relative to the primary tumor of initial (P0) and established (P3) PDX models. B, C Comparison of mutational distance (B) and copy number distance (C) between P0 and matched P3 PDX models, P0 PDX models and the matched region of origin, and P3 PDX models and the matched region of origin (n = 32 comparisons per group). D The proportion of the aberrant genome for matched primary tumor region of origin, P0 PDX model and P3 PDX model samples (n = 32 samples per group). E Proportion of the genome subject to loss of heterozygosity (LOH) for matched primary tumor region of origin, P0 PDX model and P3 PDX model samples (n = 32 samples per group). BE The box plots represent the upper and lower quartiles (box limits), the median (center line) and the whiskers span 1.5*IQR. Lines indicate sample matching. Two-sided Wilcoxon signed rank test, p values as indicated. LUAD—lung adenocarcinoma; LUSC—lung squamous cell carcinoma.

References

    1. Hidalgo M, et al. Patient-derived xenograft models: an emerging platform for translational cancer research. Cancer Discov. 2014;4:998–1013. doi: 10.1158/2159-8290.CD-14-0001. - DOI - PMC - PubMed
    1. Hynds RE, et al. Progress towards non-small-cell lung cancer models that represent clinical evolutionary trajectories. Open Biol. 2021;11:200247. doi: 10.1098/rsob.200247. - DOI - PMC - PubMed
    1. Gao H, et al. High-throughput screening using patient-derived tumor xenografts to predict clinical trial drug response. Nat. Med. 2015;21:1318–1325. doi: 10.1038/nm.3954. - DOI - PubMed
    1. Byrne AT, et al. Interrogating open issues in cancer precision medicine with patient-derived xenografts. Nat. Rev. Cancer. 2017;17:254–268. doi: 10.1038/nrc.2016.140. - DOI - PubMed
    1. Izumchenko E, et al. Patient-derived xenografts effectively capture responses to oncology therapy in a heterogeneous cohort of patients with solid tumors. Ann. Oncol. 2017;28:2595–2605. doi: 10.1093/annonc/mdx416. - DOI - PMC - PubMed