. 2024 May 31;15(1):4669.
doi: 10.1038/s41467-024-49140-0.

The neural basis of resting-state fMRI functional connectivity in fronto-limbic circuits revealed by chemogenetic manipulation

Affiliations

The neural basis of resting-state fMRI functional connectivity in fronto-limbic circuits revealed by chemogenetic manipulation

Catherine Elorette et al. Nat Commun. .

Abstract

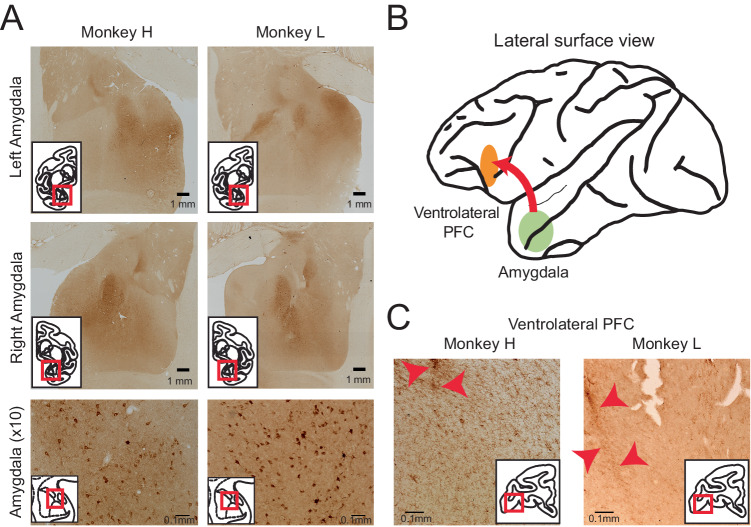
Measures of fMRI resting-state functional connectivity (rs-FC) are an essential tool for basic and clinical investigations of fronto-limbic circuits. Understanding the relationship between rs-FC and the underlying patterns of neural activity in these circuits is therefore vital. Here we introduced inhibitory designer receptors exclusively activated by designer drugs (DREADDs) into the amygdala of two male macaques. We evaluated the causal effect of activating the DREADD receptors on rs-FC and neural activity within circuits connecting amygdala and frontal cortex. Activating the inhibitory DREADD increased rs-FC between amygdala and ventrolateral prefrontal cortex. Neurophysiological recordings revealed that the DREADD-induced increase in fMRI rs-FC was associated with increased local field potential coherency in the alpha band (6.5-14.5 Hz) between amygdala and ventrolateral prefrontal cortex. Thus, our multi-modal approach reveals the specific signature of neuronal activity that underlies rs-FC in fronto-limbic circuits.


Conflict of interest statement

The authors declare no competing interests.

Figures

Fig. 1
Fig. 1. Schematic of experimental design and analysis approach.
A Experimental timeline from injection of DREADDs into amygdala, through data collection of fMRI and extracellular recordings. VEH = vehicle; DCZ = deschloroclozapine; CNO = clozapine-N-oxide. Types of (B) fMRI or (C) neural activity analyses performed. Sagittal and coronal drawings of the macaque brain are taken from a standard rhesus macaque brain atlas (generated by the Laboratory of Neuropsychology, NIMH; in the public domain). Macaque MRI templates shown are taken from the NMT and CHARM atlases.
Fig. 2
Fig. 2. DREADD transfection confirmed by histological processing.
A Brain sections processed for HA tag showing representative images shown of whole amygdala (tiled images, top and middle) as well as DREADD transfected amygdala neurons (bottom). At least 14 sections through the amygdala were stained for each animal. A further 11 sections from each animal were dual-stained for Nissl and DREADDs. B Schematic of DREADD injection site in amygdala and labeling of axonal projections in vlPFC. Sagittal drawing of the macaque brain taken from a standard rhesus macaque brain atlas (generated by the Laboratory of Neuropsychology, NIMH; in the public domain). C Brain sections processed for HA tag, showing labeling of axon terminals in vlPFC (see inset). Representative images are shown for each animal of the hemisphere in which extracellular recording of vlPFC occurred. Red arrows indicate electrode tracks. At least 6 sections through the vlPFC were stained for each animal.
Fig. 3
Fig. 3. Representative changes in functional connectivity between amygdala and frontal cortex.
A Coronal view of the standardized macaque template showing vlPFC (left) and amygdala (right) ROIs, taken from the D99 atlas, highlighted on the left hemisphere. Select anatomical regions are labeled on the right hemisphere. BD Average rs-FC with a left amygdala seed region in animal L. Pre-DCZ injection period (B) and post-injection period (C). Scale bar indicates z-score of rs-FC. Threshold p = 0.0485, cluster size ≥30 voxels, voxel faces touching, average of two sessions. r-value range −0.222:0.772 (Pre-DCZ), −0.216:0.794 (Post-DCZ). This analysis was conducted for both hemispheres in both animals (N = 2). D Difference in FC produced by DREADD inhibition [(DCZ post-injection – pre-injection) – (vehicle post-injection – pre-injection)], calculated from averaged DCZ post-injection – pre-injection data and averaged vehicle post-injection – pre-injection data. Scale bar indicates difference in z-score of rs-FC. Threshold p = 0.0485, cluster size ≥30 voxels, voxel faces touching. r-value range −0.205:0.215. This analysis was conducted for both hemispheres in both animals (N = 2). E Average (±SEM) change in rs-FC between amygdala (bilateral ROI) and all other voxels in the brain after treatment with vehicle or DREADD activation via DCZ. Symbols indicate individual session average values for each animal (total 226,783 voxel correlations, 2 sessions per treatment, N = 2 animals). Animal H, diamond; animal L, plus sign. Multiway ANOVA, main effect of drug F[1,226780] = 272.20, p = 4.09e-61, main effect of animal F[1,226780] = 186.82, p = 1.64e-42, interaction of drug and animal F[1,226780] = 64.26, p = 1.10e-15. Results are shown throughout on a standard macaque MRI template. Source data are provided as a source data file. ACC = anterior cingulate cortex; OFC = orbitofrontal cortex; vlPFC = ventrolateral prefrontal cortex; Str = striatum; AMY = amygdala; PrMo = premotor cortex; Ins = insula; DCZ = deschloroclozapine; VEH = vehicle.
Fig. 4
Fig. 4. Whole brain fMRI functional connectome altered by chemogenetic inhibition of amygdala.
Average FC across all ROIs calculated across a standard whole brain atlas (A), a cortical atlas (B) and a subcortical (C) atlas. Activation of DREADDs via DCZ increased global rs-FC across all three networks. Symbols denote average difference in rs-FC for each animal, separated by session (2 sessions per treatment, N = 2 animals). Animal H, diamond; animal L, plus sign. Error bars represent SEM. Atlas image insets shown on NMT v2,–. Multi-way ANOVA analyses: Whole brain (A), main effect of drug F[1,146,684] = 728.35, p = 5.05e-160 and subject F[1,146,684] = 498.91, p = 2.51e-110, interaction between subject and drug F[1,146,684] = 12.54, p = 0.0004. Total 146688 voxel correlations. Cortical atlas (B), main effect of drug F[1,5036] = 34.71, p = 4.07e-09 and subject F[1,5036] = 115.59, p = 1.13e-26. Total 5040 voxel correlations. Subcortical atlas (C), main effect of drug F[1,4484] = 44.61, p = 2.69e-11 and subject F[1,4484] = 56.76, p = 5.92e-14, interaction between subject and drug F[1,4484] = 206.47, p = 8.29e-46. Total 4488 voxel correlations. Source data are provided as a source data file. DCZ = deschloroclozapine; VEH = vehicle.
Fig. 5
Fig. 5. Inhibition of amygdala produces increased functional connectivity as measured by LFP coherency and rs-fMRI, and increased neural spiking.
A Recording sites in vlPFC and amygdala, validated by histology (pink markers, animal H; purple markers, animal L). Sagittal and coronal drawings taken from a standard rhesus macaque brain atlas (Laboratory of Neuropsychology, NIMH; in the public domain). Average time course (left) and summary data (right) of neural spiking activity in the amygdala (B) or vlPFC (C) after treatment with DREADD actuator DCZ or control. For visualization purposes, the average normalized firing rate change over time was smoothed using a moving average window of 2 s (4 bins). Time course data is displayed as the mean ± SEM. Only amygdala neurons show an increase in average firing rate after chemogenetic inhibition of amygdala via DCZ compared to baseline (Wilcoxon signed-rank test, two-tailed; p = 0.002. Amygdala vehicle p = 0.46; vlFPC DCZ p = 0.68, vlPFC vehicle p = 0.29; amygdala neurons N = 99, vlPFC neurons N = 45). There was a significant difference between amygdala neuron firing rate after treatment with DCZ as compared to vehicle (Kruskal-Wallis; Χ2 [1,97, N = 99] = 7.3, p = 0.0069), but no difference due to treatment in the vlPFC (Χ2 [1,43, N = 45] = 0.48, p = 0.49). Single neurons denoted by dots. Box plots display average value (center), 25th–75th percentile data spread (top and bottom of box), and maximal and minimal values (whiskers). D Average (±SEM) change in LFP coherency at each amygdala bipolar site with all vlPFC bipolar sites. Dots indicate amygdala bipolar sites (N = 106 across both animals, two recording sessions per treatment). Box plots display average value (center), 25th–75th percentile data spread (top and bottom of box), and maximal and minimal values (whiskers). LFP signal at each bipolar site was band-pass filtered between 0.5 and 200 Hz before a multi-taper frequency transformation was applied; see Methods. Multiway ANOVA, main effect of drug F[1, 102] = 5.64, p = 0.02. E Average change in FC between each amygdala ROI voxel with all vlPFC (area 12o/l) voxels, shown separately for each animal, on NMT. Right and left rs-FC maps were calculated separately. Source data are provided as a source data file. DCZ = deschloroclozapine; VEH = vehicle.
Fig. 6
Fig. 6. Inhibitory DREADDs activation by less specific actuator CNO produces similar changes in frontal-limbic functional connectivity but differently affects large scale connectomes.
All analyses conducted in two animals (N = 2). A Animal L left amygdala ROI FC difference after CNO treatment compared to vehicle, on NMT (as in Fig. 3D). Threshold p = 0.0485, cluster size ≥30 voxels. r-value range −0.304:0.261. Analysis was conducted for both hemispheres. B Average (±SEM) change in rs-FC between amygdala (bilateral ROI) and all other voxels after vehicle or CNO treatment. Symbols indicate animal session values: Animal H, diamond; animal L, plus sign. Multiway ANOVA, main effects of drug F[1,170084] = 67.70, p = 1.91e-16, animal F[1,170084] = 16.23, p = 5.61e-5, and interaction F[1,170084] = 76.22, p = 2.56e-18. C Average (±SEM) rs-FC calculated using whole brain, cortical, or subcortical atlases. CNO decreased global and subcortical rs-FC. Whole brain multiway ANOVA, main effects of drug F[1,110012] = 24.49, p = 7.48e-07, subject F[1,110012] = 90.89, p = 1.55e-21, and interaction F[1,110012] = 140.66, p = 2.00e-32. Total 110016 voxel correlations. Cortical atlas multiway ANOVA, main effect of subject F[1,3776] = 51.04, p = 1.08e-12, no drug (F[1,3776] = 2.17, p = 0.14), no interaction (F[1,3776] = 1.05, p = 0.31). Total 3780 ROI correlations. Subcortical atlas, main effect of drug (F[1,3362] = 42.99, p = 6.35e-11), subject and drug interaction (F[1,3362] = 23.28, p = 1.46e-06), no main effect of subject (F[1,3362] = 1.77, p = 0.18). Total 3366 ROI correlations. D CNO didn’t alter amygdala (left; Kruskal-Wallis; Χ2 [1,72,N = 74] = 2.0, p = 0.16) or vlPFC (right; Kruskal-Wallis; Χ2 [1,40,N = 42] = 0.52, p = 0.47) neural spiking. Dots indicate single neurons. Box plots display average value (center), 25th–75th percentile data spread (top and bottom of box), and maximal and minimal values (whiskers). Across conditions, firing rate was not significantly altered compared to pre-injection (Wilcoxon signed-rank test; amygdala: CNO p = 0.33, vehicle p = 0.46; vlPFC: CNO p = 0.85, vehicle p = 0.29). E CNO treatment did significantly increase the proportion of modulated neurons (average ±SEM) across the amygdala (N = 74) and vlPFC (N = 42). Linear mixed-effects model T[1,112] = 2.25, p = 0.03. F CNO significantly increased amygdala-vlPFC LFP coherence. Dots indicate coherence with all vlPFC sites at each amygdala bipolar site (N = 82 across both animals, two vehicle, one CNO recording session each). Box plots are the same as Fig. 6D. Multiway ANOVA, main effect of treatment (F[1,78] = 10.73, p = 0.002). Source data are provided in source data file. CNO = clozapine-N-oxide; VEH = vehicle.

Update of

References

    1. Chen K, Azeez A, Chen DY, Biswal BB. Resting-state functional connectivity: signal origins and analytic methods. Neuroimaging Clin. 2020;30:15–23. doi: 10.1016/j.nic.2019.09.012. - DOI - PubMed
    1. Grayson DS, Fair DA. Development of large-scale functional networks from birth to adulthood: a guide to the neuroimaging literature. Neuroimage. 2017;160:15–31. doi: 10.1016/j.neuroimage.2017.01.079. - DOI - PMC - PubMed
    1. Rosenberg, B. M., Mennigen, E., Monti, M. M. & Kaiser, R. H. Functional segregation of human brain networks across the lifespan: an exploratory analysis of static and dynamic resting-state functional connectivity. Front. Neurosci. 14, 561594 (2020). - PMC - PubMed
    1. Greicius M. Resting-state functional connectivity in neuropsychiatric disorders. Curr. Opin. Neurol. 2008;21:424–430. doi: 10.1097/WCO.0b013e328306f2c5. - DOI - PubMed
    1. Chai, Y., Sheline, Y. I., Oathes, D. J., Balderston, N. L. & Rao, H. Functional connectomics in depression: insights into therapies. Trends Cogn. Sci. 1–19 10.1016/j.tics.2023.05.006 (2023). - PMC - PubMed

MeSH terms