. 2024 May 31;15(1):4665.
doi: 10.1038/s41467-024-49059-6.

Glycolysis inhibition induces anti-tumor central memory CD8+T cell differentiation upon combination with microwave ablation therapy

Affiliations

Glycolysis inhibition induces anti-tumor central memory CD8+T cell differentiation upon combination with microwave ablation therapy

Xinyu Tang et al. Nat Commun. .

Abstract

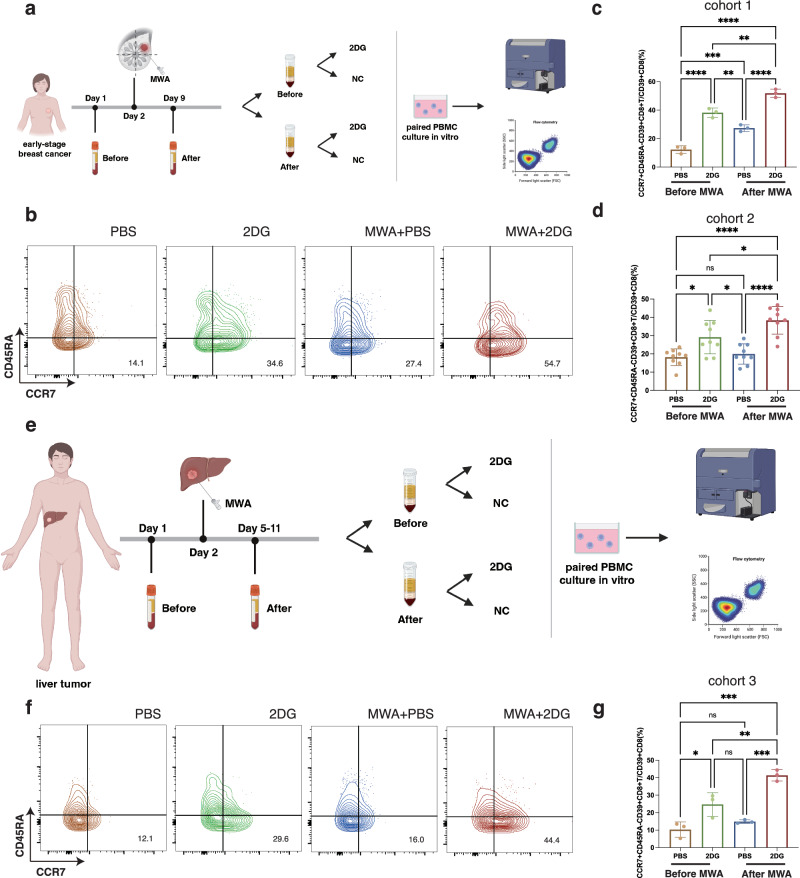
Minimally invasive thermal therapy is a successful alternative treatment to surgery in solid tumors with high complete ablation rates, however, tumor recurrence remains a concern. Central memory CD8+ T cells (TCM) play important roles in protection from chronic infection and cancer. Here we find, by single-cell RNA analysis of human breast cancer samples, that although the memory phenotype of peripheral CD8+ T cells increases slightly after microwave ablation (MWA), the metabolism of peripheral CD8+ T cells remains unfavorable for memory phenotype. In mouse models, glycolysis inhibition by 2-deoxy-D-glucose (2DG) in combination with MWA results in long-term anti-tumor effect via enhancing differentiation of tumor-specific CD44hiCD62L+CD8+ TCM cells. Enhancement of CD8+ TCM cell differentiation determined by Stat-1, is dependent on the tumor-draining lymph nodes (TDLN) but takes place in peripheral blood, with metabolic remodeling of CD8+ T cells lasting the entire course of the the combination therapy. Importantly, in-vitro glycolysis inhibition in peripheral CD8+ T cells of patients with breast or liver tumors having been treated with MWA thrice leads to their differentiation into CD8+ TCM cells. Our work thus offers a potential strategy to avoid tumor recurrence following MWA therapy and lays down the proof-of-principle for future clinical trials.


Conflict of interest statement

The authors declare no competing interests.

Figures

Fig. 1
Fig. 1. Memory and metabolic features of peripheral CD8+T cells in patients with breast cancer post-local ablation.
a Experimental design for (bi). Peripheral blood of six patients with breast cancer was collected before and 1 week after MWA. Peripheral blood mononuclear cells (PBMC) were isolated for single-cell RNA sequencing. b T-distributed stochastic neighbor embedding (t-SNE) plot of eight distinct clusters demarcated by colors based on gene expression differences in NK and T cells. c Feature plots of key gene expression in the CD8+T cell clusters. d Violin plots of differential expression of known memory T cell markers (IL7R) in two CD8+T cell clusters. e Box plots of the proportions of IL7R+CD8+T cells in peripheral CD8+T cells before and after ablation (n = 6). f Violin plots of scores of memory CD8+T cells in two CD8+T cell clusters. g Heatmap of the average metabolic pathway scores of two CD8+T cell clusters before and after ablation. The metabolic pathways highlighted in red represent the main energy metabolism pathways. The metabolic pathway scores were determined by the GSVA algorithm. h Volcano plots of differential metabolic pathways of two CD8+T cell clusters before and after MWA of breast cancer. i Violin Plots of Δscore (glycolysis - OXPHOS) of two CD8+T cell clusters before and after ablation. Significance was determined as P < 0.05. The low ends of the segment indicate the minimum and the high ends of the segment indicate the maximum. Lower bounds of the box indicate the 25th percentile and the higher bounds of the box indicate the 75th percentile. The segment in the middle is the median (df, i). Significance determined by two-tailed unpaired t-test (d, f, i), two-tailed paired t-test (e), and two-sided linear model fitting and empirical Bayesian methods (h). Source data are provided as a Source Data file. a Created with BioRender.com released under a Creative Commons Attribution-NonCommercial-NoDerivs 4.0 International license.
Fig. 2
Fig. 2. Interfering with glycolysis potentiates the anti-tumor effect of complete local ablation.
a Experimental design for (b). b Representative H&E stained sections of lung and TDLN metastases in (a) (n = 4 per group). Arrow, lung metastases. Scale bar, from top to bottom, 500 μm, 20 μm, and 1000 μm. c Experimental design for (d, e, f). Respectively, 4T1 or Py8119 tumor cells (n = 5 × 105) were re-challenged at the opposite flanks of mice on day 35. d Concentration of 2DG in the plasma after the last 2DG injection detected by UPLC-ESI-MS/MS. e Tumor volume curves of mice in (c) re-challenged with 4T1 (n = 5 per group). f Tumor volume curves of mice in (c) re-challenged with Py8119 (n = 3 per group). g Survival curves of mice in (d) re-challenged with 4T1 (n = 5 per group). h Experimental design for (i, j). MC38 or B16F10 tumor cells (n = 5 × 105) were re-challenged at the opposite flanks of mice on day 35, respectively. i, j Tumor volume curves of mice in (h) re-challenged with B16F10 or MC38 (n = 5 per group for the B16F10 model; n = 4 in the MWA + 2DG, MWA, and 2DG groups and n = 3 in the NC group for the MC38 model). k Experimental design for (l). 3 mice in the MWA + 2DG group survived for 140 days and were re-challenged with 4T1 tumor cells (n = 1 × 105) at the opposite flanks of mice from the 2 groups on day 140. Naïve BALB/c mice were set as control. l Tumor volume curves of mice in (k) re-challenged with 4T1 (n = 3 per group). All the experiments were repeated for at least two times. Data are mean ± SD (d, e, f, i, j, l). Significance determined by one-way ANOVA (e, j), two-tailed unpaired t-test (f, i, l), and log-rank (Mantel-Cox) test with Bonferroni’s correction (g). ns not significant, *P < 0.05, **P < 0.01, ***P < 0.001, ****P < 0.0001. Exact p values and source data are provided as a Source Data file. a, c, h, k Created with BioRender.com released under a Creative Commons Attribution-NonCommercial-NoDerivs 4.0 International license.
Fig. 3
Fig. 3. Interfering with glycolysis post local ablation induces enhanced long-term memory phenotype of peripheral CD8+T cells.
a Experimental design for (b-g). Percentages and absolute numbers of CD3+T, CD4+T, CD8+T, CD44hiCD62LCD4+T, CD44hiCD62L+CD4+T, CD44hiCD62LCD8+T, CD44hiCD62L+CD8+T cells in spleens of mice implanted with 4T1 (b, n = 3 per group) or with Py8119 (c, n = 3 per group). d, e Representative flow plots of CD44hiCD62L+CD8+T and CD44hiCD62L+CD4+T cells in (b). f, g Percentages of Tregs and non-apoptotic memory CD8 + T cells in spleens of mice implanted with 4T1 (n = 3 per group). h Experimental design for (i, j). CD8 + T cells were isolated from the spleens of mice from MWA + 2DG and MWA + PBS on day 17 to coculture with 4T1 tumor cells in the presence of 2DG or PBS respectively for 24 h. Representative pictures of the coculture experiment (i) and percentages of cytotoxicity in the coculture experiment (j, n = 3 per group). k Experimental design for (l, m). l MFI of CD62L of CD44hiCD8+T cells between day 35 and day 140 (n = 3 per group). m Dynamic changes of CD44hiCD62L+CD8+T cell percentage and absolute number in spleens of mice from the MWA + 2DG group as time progressed (n = 3 per group). All the experiments were repeated for at least two times. Data are mean ± SD (b, c, f, g, j, l, m). Significance determined by one-way ANOVA (b) and two-tailed unpaired t-test (c, f, g, j, l, m). ns, not significant, *P < 0.05, **P < 0.01, ***P < 0.001, ****P < 0.0001. Exact p values and source data are provided as a Source Data file. a, h, k Created with BioRender.com released under a Creative Commons Attribution-NonCommercial-NoDerivs 4.0 International license.
Fig. 4
Fig. 4. Interfering with glycolysis boosts the anti-tumor effect of local ablation in a CD8+T cell-dependent manner.
a Experimental design for (b). 4T1 tumor cells (n = 1 × 105) were rechallenged at the opposite flanks of mice on day 35. b Tumor volume curves of the mice in (a) re-challenged with 4T1 (n = 5 per group). c Experimental design for (d, e). Mice intraperitoneally injected with anti-CD8a or rat IgG2a,κ q.4d from day 34 to day 50. 4T1 tumor cells (n = 1 × 105) were re-challenged at the opposite flanks of mice on day 35. d, e Tumor volume curves of the mice (n = 4 per group for 4T1 model; n = 4 for MWA + 2DG with anti-CD8a or IgG2a,κ group and n = 3 for MWA + PBS with IgG2a,κ group for Py8119 model). f Experimental design for (g). g Percentages and absolute numbers of tetramer+CD8+T, CD44hiCD62L-tetramer+CD8+T, and CD44hiCD62L+tetramer+CD8+T cells in spleens of mice (n = 3 per group). h Experimental design for (i). i Percentage and absolute number of CD44hiCD62L+tetramer+CD8+T cells in spleens of mice (n = 3 per group). j Experimental design for (k, l). k Dynamic changes of CD44hiCD62L+tetramer+CD8+T cell percentage and absolute number in spleens of mice from the MWA + 2DG group as time progressed (n = 3 per group). l CD62L expression of CD44hitetramer+CD8+ T cells in spleens of mice from the MWA + 2DG group as time progressed (n = 3 per group). All the experiments were repeated for at least two times. Data are mean ± SD (b, d, e, g, i, k, l). Significance determined by one-way ANOVA (d, e, g, i) and two-tailed unpaired t-test (b, k, l). ns, not significant,*P < 0.05, **P < 0.01, ***P < 0.001, ****P < 0.0001. Exact p values and source data are provided as a Source Data file. a, c, f, h, j Created with BioRender.com released under a Creative Commons Attribution-NonCommercial-NoDerivs 4.0 International license.
Fig. 5
Fig. 5. Immune microenvironment in TDLN is more activated by the combination therapy compared with local ablation alone.
a Experimental design for (bd). Dissection of TDLN or sham surgery was performed on all mice on day 10. bd Percentages of CD4+T, CD8+T, and CD44hiCD62L+CD8+T cells of mice (n = 4 per group). e Experimental design for (fi). All mice were intraperitoneally injected with 2DG every 2 days from day 10 to day 30. FTY720 or 0.9% saline was intraperitoneally injected q.d from day 9 to day 35. f Percentages and absolute numbers of CD8+T, tetramer+CD8+T, CD44hiCD62L+tetramer+CD8+T cells in 4T1 model (n = 3 per group). g Percentages and absolute numbers of CD8+T, CD44hiCD62L+CD8+T cells in Py8119 model (n = 3 per group). h, i Representative flow plots of CD8+T and tetramer+CD8+T cells in (e). jl WT BALB/c mice implanted with 4T1 were treated with MWA on day 10. All mice were intraperitoneally injected with 2DG or PBS every 2 days from day 10. TDLNs were collected on day 15 for RNA-seq (n = 5 per group). Estimated percentages of immune cells in TDLNs of mice (j). GO pathways enriched in differentially expressed genes of TDLNs between the MWA + 2DG and MWA + PBS groups (k). Mean scores of GO pathways related to CD8+T and Th1 cells in the TDLNs (l). m Experimental design for (nq). n Percentages of Th1, CD8+T, CD25+CD8+T, CD69+CD8+T, and CD44+CD8+T cells in TDLNs of mice (n = 4 per group). o Representative flow plots of migratory cDC1s in TDLNs of mice. p, q Percentages and absolute numbers of DCs, cDC1s, cDC2s, migratory cDC1s, and resident cDC1s in TDLNs of mice (n = 3 per group). The experiments (ai and mq) were repeated for at least two times. Data are mean ± SD (bd, f, g, n, p, q), mean with min to max (j). Significance determined by two-tailed unpaired t-test (bd, f, g, j, n, p, q) and the hypergeometric test (k). ns, not significant, *P < 0.05, **P < 0.01, ***P < 0.001, ****P < 0.0001. Exact p values and source data are provided as a Source Data file. a, e, m Created with BioRender.com released under a Creative Commons Attribution-NonCommercial-NoDerivs 4.0 International license.
Fig. 6
Fig. 6. Enhancement of CD8+TCM cell differentiation after the combination therapy does not occur in TDLN but mainly in peripheral blood.
a Experimental design for (b–e). b Representative flow plots of tetramer+CD8+T cells in TDLNs of mice in (a). c, d Percentages and absolute numbers of CD8+T, tetramer+CD8+T, CD44hiCD62L+tetramer+CD8+T cells (n = 3 per group) implanted with 4T1. e Percentages and absolute numbers of CD8+T, CD44hiCD62L+CD8+T cells (n = 3 per group) implanted with Py8119. f Experimental design for (g, h). PBMCs (g) or single cells of TDLNs (h) were collected for in-vitro experiments. Percentages of CD44hiCD62L+CD8+T cells in PBMCs (g, n = 3) or single cells of TDLNs (h, n = 5) cultured in vitro. i Experimental design for (j). j Percentages and absolute numbers of CD44hiCD62L+tetramer+CD8+T and CD44hiCD62L+CD8+T cells (n = 3 per group). k Uniform manifold approximation and projection (UMAP) plot of tumor-specific CD8+T cells from the 2 groups. l Percentages of CD8+TCM in the single-cell RNA seq data. m Monocle2 pseudotime trajectory showing the differentiation of tumor-specific CD8+T cells. n, o Metabolism pathway scores of CD8+T cells (n = 3 per group) and estimated transcription factor promoting memory formation of CD8 + T cells (n = 3 per group). p Percentages of CD44hiCD62L+CD8+T cells in isolated CD8+T cells after coculturing with PBS + DMSO, PBS + fludarabine (flu), 2DG + DMSO, or 2DG + fludarabine for 4 days (n = 6 per group). q Experimental design for (rs). r Knockdown of total STAT1 of Zsgreen+CD8+T cells in spleens of CD8a-cre mice injected with AAV (n = 3 per group). s Percentage of CD44hiCD62L+Zsgreen+CD8+T cells (n = 3 per group). The experiments (aj and ps) were repeated for at least two times. Data are mean ± SD (ce, g, h, j, l, n, p, r, s). Significance determined by two-tailed unpaired t-test (ce, j, n), one-way ANOVA (g, h, p, r, s), and one-sided Wilcoxon rank-sum test (o). ns, not significant,*P < 0.05, **P < 0.01, ***P < 0.001, ****P < 0.0001. Exact p values and source data are provided as a Source Data file. a, f, i, q Created with BioRender.com released under a Creative Commons Attribution-NonCommercial-NoDerivs 4.0 International license.
Fig. 7
Fig. 7. Peripheral CD8 + T cells of patients post MWA of local tumors differentiate into CD8 + TCM cells by inhibiting glycolysis in vitro.
a Experimental design for (bd). Peripheral blood was collected 1 day before and 7 days after MWA of breast cancer. PBMCs isolated from the peripheral blood were cultured in vitro with 2DG or vehicle in a paired way. b Representative flow plots of CD39+CD8+TCM cells in the 4 groups of PBMCs in (a) cultured in vitro. c, d Percentages of CD39+CD8+TCM cells in the 4 groups of PBMCs in (a) cultured in vitro (n = 3 per group in cohort 1 and n = 9 per group in cohort 2). e Experimental design for (f, g). Peripheral blood was collected 1 day before and 3–9 days after MWA of liver tumor. PBMCs isolated from the peripheral blood were cultured in vitro with 2DG or vehicle in a paired way. f Representative flow plots of CD8+TCM cells in the 4 groups of PBMCs in (e) cultured in vitro. g Percentages of CD8+TCM cells in the 4 groups of PBMCs in (e) cultured in vitro (n = 3 per group). Data are mean ± SD (c, d, g). Significance determined by one-way ANOVA (c, d, g). ns, not significant,*P < 0.05, **P < 0.01, ***P < 0.001, ****P < 0.0001. Exact p values and source data are provided as a Source Data file. a, e Created with BioRender.com released under a Creative Commons Attribution-NonCommercial-NoDerivs 4.0 International license.

References

    1. Hiller JG, Perry NJ, Poulogiannis G, Riedel B, Sloan EK. Perioperative events influence cancer recurrence risk after surgery. Nat. Rev. Clin. Oncol. 2018;15:205–218. doi: 10.1038/nrclinonc.2017.194. - DOI - PubMed
    1. Tohme S, Simmons RL, Tsung A. Surgery for cancer: a trigger for metastases. Cancer Res. 2017;77:1548–1552. doi: 10.1158/0008-5472.CAN-16-1536. - DOI - PMC - PubMed
    1. Krall, J. A. et al. The systemic response to surgery triggers the outgrowth of distant immune-controlled tumors in mouse models of dormancy. Sci. Transl. Med.10, 10.1126/scitranslmed.aan3464 (2018). - PMC - PubMed
    1. Ahmed M, Brace CL, Lee FT, Jr., Goldberg SN. Principles of and advances in percutaneous ablation. Radiology. 2011;258:351–369. doi: 10.1148/radiol.10081634. - DOI - PMC - PubMed
    1. Petrowsky H, et al. Modern therapeutic approaches for the treatment of malignant liver tumours. Nat. Rev. Gastroenterol. Hepatol. 2020;17:755–772. doi: 10.1038/s41575-020-0314-8. - DOI - PubMed

MeSH terms