

Using explainable machine learning and fitbit data to investigate predictors of adolescent obesity
- PMID: 38821981
- PMCID: PMC11143310
- DOI: 10.1038/s41598-024-60811-2
Using explainable machine learning and fitbit data to investigate predictors of adolescent obesity
Abstract
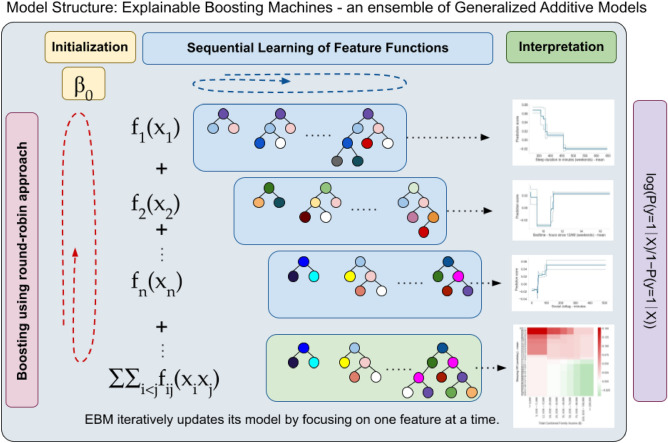
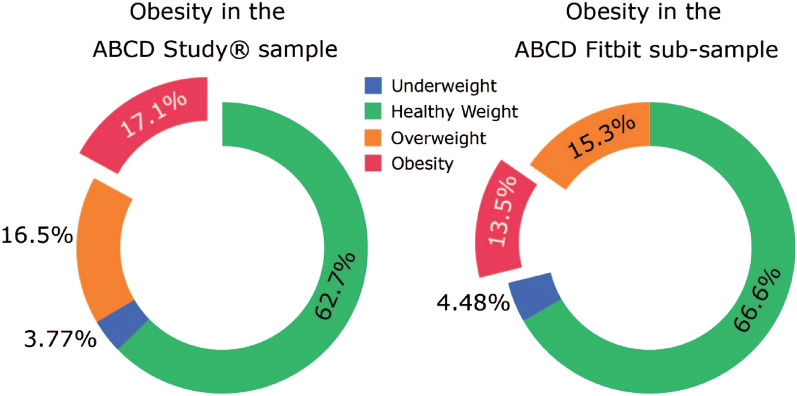
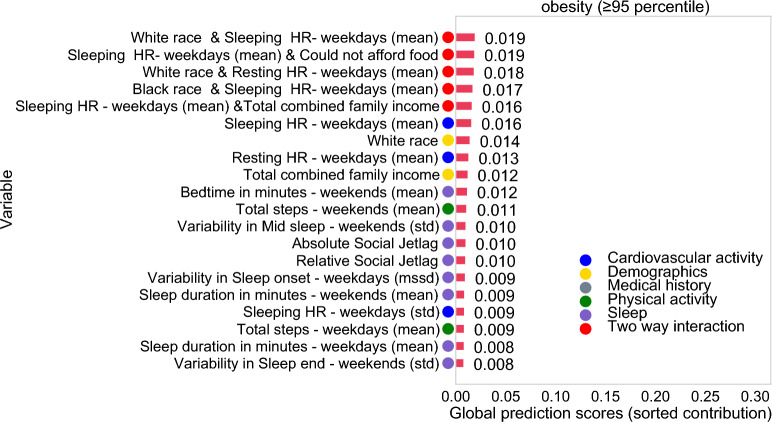
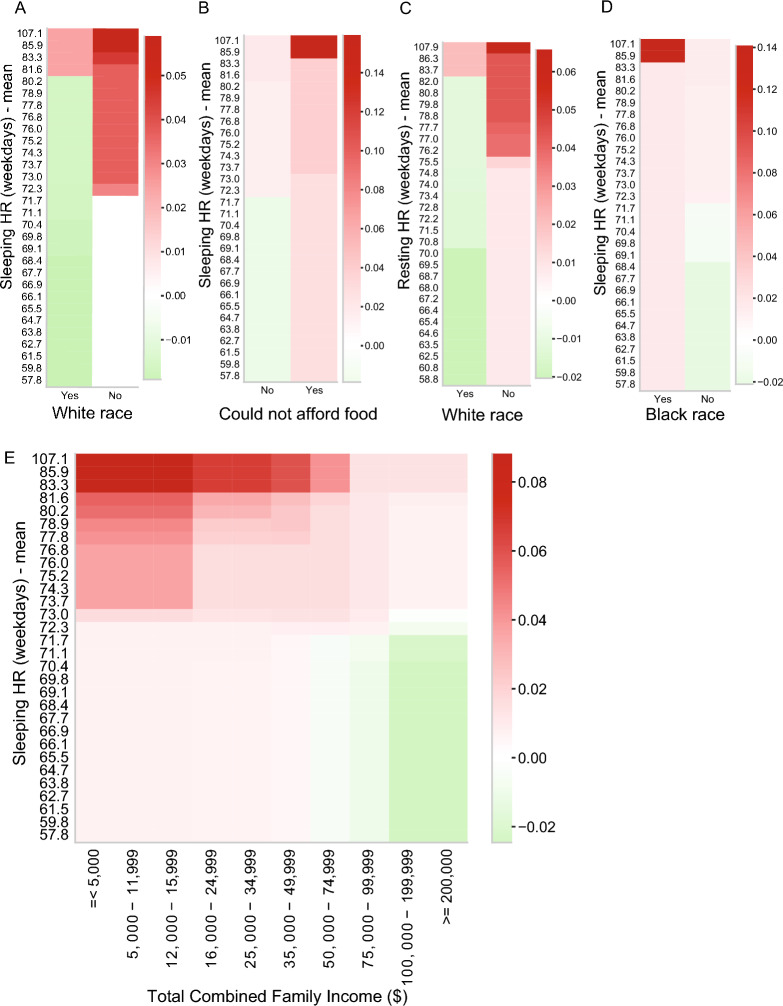
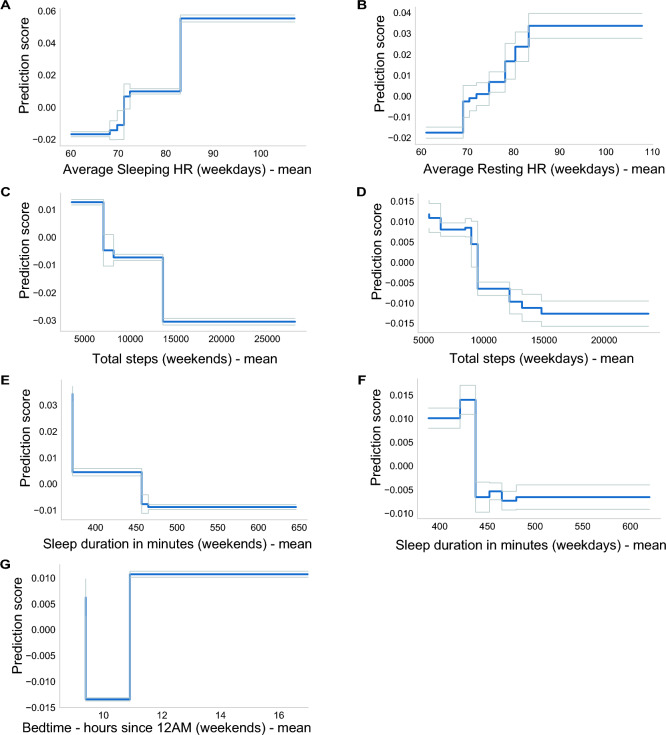
Sociodemographic and lifestyle factors (sleep, physical activity, and sedentary behavior) may predict obesity risk in early adolescence; a critical period during the life course. Analyzing data from 2971 participants (M = 11.94, SD = 0.64 years) wearing Fitbit Charge HR 2 devices in the Adolescent Brain Cognitive Development (ABCD) Study, glass box machine learning models identified obesity predictors from Fitbit-derived measures of sleep, cardiovascular fitness, and sociodemographic status. Key predictors of obesity include identifying as Non-White race, low household income, later bedtime, short sleep duration, variable sleep timing, low daily step counts, and high heart rates (AUCMean = 0.726). Findings highlight the importance of inadequate sleep, physical inactivity, and socioeconomic disparities, for obesity risk. Results also show the clinical applicability of wearables for continuous monitoring of sleep and cardiovascular fitness in adolescents. Identifying the tipping points in the predictors of obesity risk can inform interventions and treatment strategies to reduce obesity rates in adolescents.
© 2024. The Author(s).
Conflict of interest statement
The authors declare no competing interests.
Figures
Similar articles
-
Social epidemiology of Fitbit daily steps in early adolescence.Pediatr Res. 2023 Nov;94(5):1838-1844. doi: 10.1038/s41390-023-02700-4. Epub 2023 Jun 23. Pediatr Res. 2023. PMID: 37353663 Free PMC article.
-
Sleep Patterns and Quality Are Associated with Severity of Obesity and Weight-Related Behaviors in Adolescents with Overweight and Obesity.Child Obes. 2018 Jan;14(1):11-17. doi: 10.1089/chi.2017.0148. Epub 2017 Aug 29. Child Obes. 2018. PMID: 28850274 Free PMC article.
-
Cross-sectional associations of objectively assessed sleep duration with physical activity, BMI and television viewing in German primary school children.BMC Pediatr. 2019 Feb 11;19(1):54. doi: 10.1186/s12887-019-1429-3. BMC Pediatr. 2019. PMID: 30744602 Free PMC article.
-
Identifying Key Determinants of Childhood Obesity: A Narrative Review of Machine Learning Studies.Child Obes. 2021 Apr;17(3):153-159. doi: 10.1089/chi.2020.0324. Epub 2021 Mar 4. Child Obes. 2021. PMID: 33661719 Free PMC article. Review.
-
Sedentary Behavior, Exercise, and Cardiovascular Health.Circ Res. 2019 Mar;124(5):799-815. doi: 10.1161/CIRCRESAHA.118.312669. Circ Res. 2019. PMID: 30817262 Review.
Cited by
-
Machine learning applied to wearable fitness tracker data and the risk of hospitalizations and cardiovascular events.Am J Prev Cardiol. 2025 May 17;22:101006. doi: 10.1016/j.ajpc.2025.101006. eCollection 2025 Jun. Am J Prev Cardiol. 2025. PMID: 40496758 Free PMC article.
-
Big data approaches for novel mechanistic insights on sleep and circadian rhythms: a workshop summary.Sleep. 2025 Jun 13;48(6):zsaf035. doi: 10.1093/sleep/zsaf035. Sleep. 2025. PMID: 39945146
-
Body Weight Perception and Other Factors Associated with Overweight and Obesity in U.S. Adolescents.Children (Basel). 2025 Jan 29;12(2):169. doi: 10.3390/children12020169. Children (Basel). 2025. PMID: 40003273 Free PMC article.
-
Differences between Type 2 Diabetes Mellitus and Obesity Management: Medical, Social, and Public Health Perspectives.Diabetes Metab J. 2025 Jul;49(4):565-579. doi: 10.4093/dmj.2025.0278. Epub 2025 Jun 11. Diabetes Metab J. 2025. PMID: 40499580 Free PMC article. Review.
-
Detection and Analysis of Circadian Biomarkers for Metabolic Syndrome Using Wearable Data: Cross-Sectional Study.JMIR Med Inform. 2025 Jul 16;13:e69328. doi: 10.2196/69328. JMIR Med Inform. 2025. PMID: 40669055 Free PMC article.
References
MeSH terms
Grants and funding
LinkOut - more resources
Full Text Sources
Medical
