. 2024 May 31;8(1):124.
doi: 10.1038/s41698-024-00615-9.

Mediator kinase inhibition impedes transcriptional plasticity and prevents resistance to ERK/MAPK-targeted therapy in KRAS-mutant cancers

Affiliations

Mediator kinase inhibition impedes transcriptional plasticity and prevents resistance to ERK/MAPK-targeted therapy in KRAS-mutant cancers

Daniel P Nussbaum et al. NPJ Precis Oncol. .

Abstract

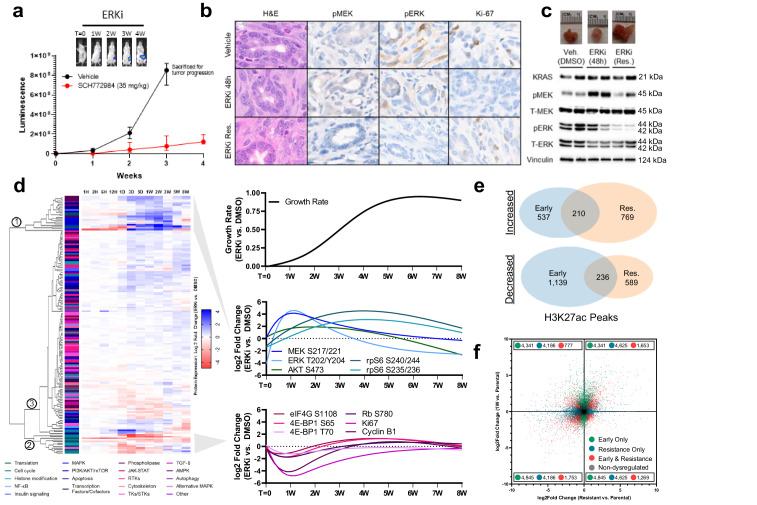
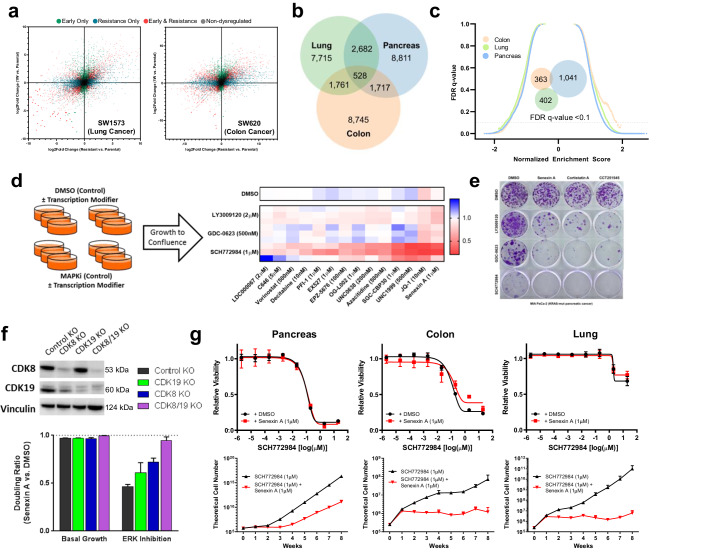
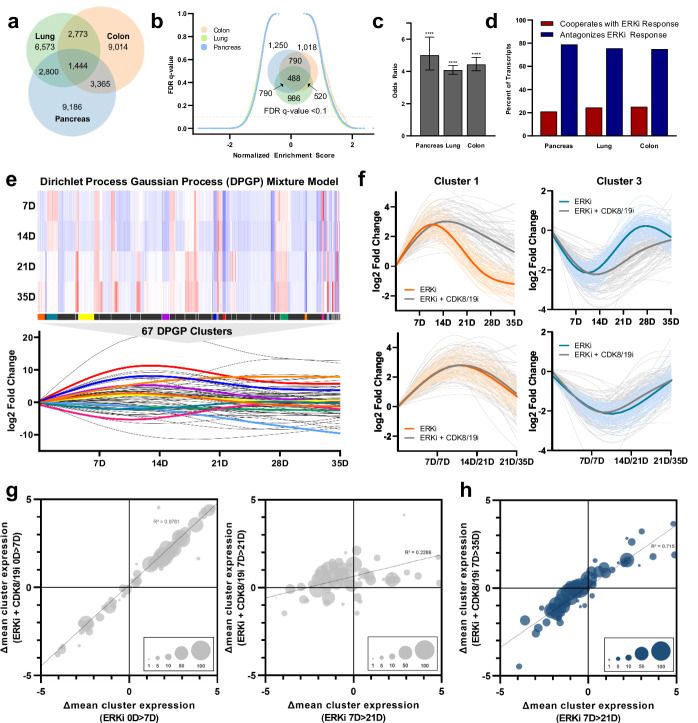
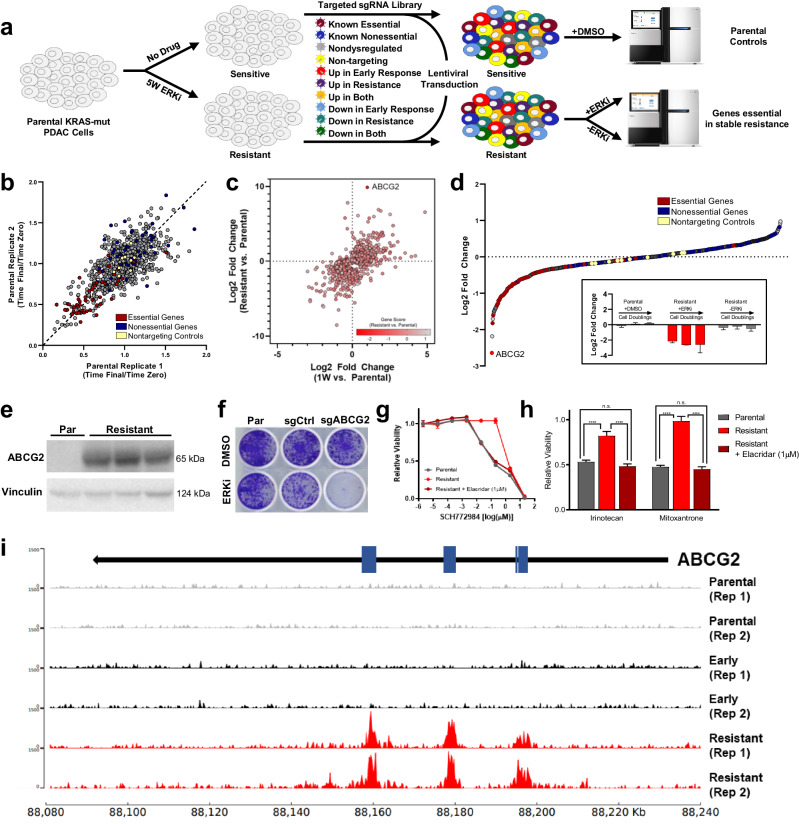
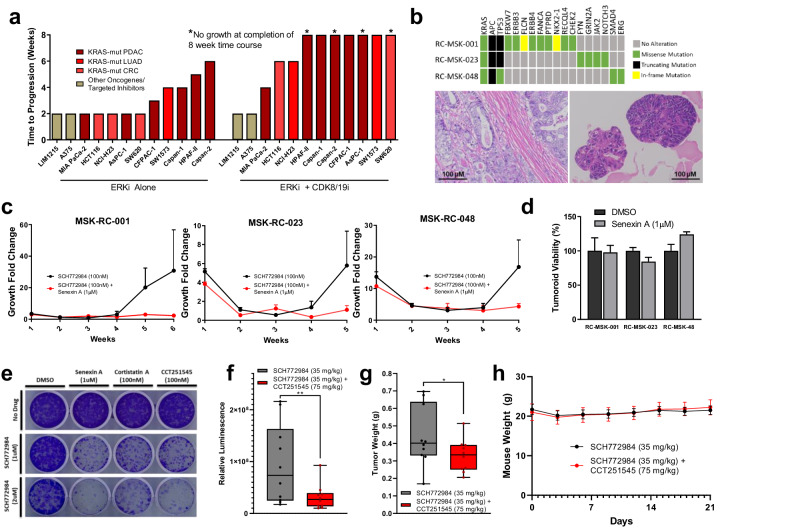
Acquired resistance remains a major challenge for therapies targeting oncogene activated pathways. KRAS is the most frequently mutated oncogene in human cancers, yet strategies targeting its downstream signaling kinases have failed to produce durable treatment responses. Here, we developed multiple models of acquired resistance to dual-mechanism ERK/MAPK inhibitors across KRAS-mutant pancreatic, colorectal, and lung cancers, and then probed the long-term events enabling survival against this class of drugs. These studies revealed that resistance emerges secondary to large-scale transcriptional adaptations that are diverse and cell line-specific. Transcriptional reprogramming extends beyond the well-established early response, and instead represents a dynamic, evolved process that is refined to attain a stably resistant phenotype. Mechanistic and translational studies reveal that resistance to dual-mechanism ERK/MAPK inhibition is broadly susceptible to manipulation of the epigenetic machinery, and that Mediator kinase, in particular, can be co-targeted at a bottleneck point to prevent diverse, cell line-specific resistance programs.


Conflict of interest statement

K.C.W. is a founder, consultant, and equity holder at Tavros Therapeutics and Celldom and has performed consulting work for Guidepoint Global, Bantam Pharmaceuticals, and Apple Tree Partners. C.J.D. is an advisory board member for Deciphera Pharmaceuticals, Mirati Therapeutics, Reactive Biosciences, Revolution Medicines and SHY Therapeutics, has received research funding support from Deciphera Pharmaceuticals, Mirati Therapeutics, Reactive Biosciences, Revolution Medicines and SpringWorks Therapeutics, and has consulted for Day One Biotherapeutics, Eli Lilly, Jazz Therapeutics, Ribometrix, Sanofi, and Turning Point Therapeutics. The remaining authors declare no competing interests. JJS received travel support for fellow education from Intuitive Surgical (August 2015). He also served as a clinical advisor for Guardant Health (March 2019) and as a clinical advisor for Foundation Medicine (April 2022). He served as a consultant and speaker for Johnson and Johnson (May 2022). And he serves as a clinical advisor and consultant for GlaxoSmithKline (2023-24).

Figures

Fig. 1
Fig. 1. Resistance to ERK/MAPK inhibition is supported by long-term epigenetic and transcriptional changes.
a FVB/n mice implanted orthotopically with 103 2.1.1syn_Luc cells and treated with either vehicle (20% HpBCD) or SCH772984 (35 mg/kg), with luminescence reported as mean and standard deviation, N = 10 mice per group. Representative micrographs (b) and immunoblots (c) of orthotopic tumors treated with vehicle (20% HpBCD) for 48 h, SCH772984 (35 mg/kg) for 48 h, or SCH772984 (35 mg/kg) for four weeks. The immunoblots are performed with two biologic replicates, and the micrographs are representative of two biologic replicates. d Left, hierarchical clustering of RPPA protein expression changes in MIA PaCa-2 cells treated with SCH772984 (1 µM) relative to DMSO (1:1000), performed in triplicate, with individual proteins annotated by cellular function and clusters indicated by circled numbers. Right, restrictive cubic splines of relative growth rate (total doublings per day) of SCH772984-treated cells compared to DMSO-treated cells (top), as well as selected protein expression changes within MAPK and PI3K/AKT/mTOR signaling pathways (middle) and cell cycle/translation markers (bottom). e Venn diagram depicting total H3K27ac peaks gained or lost (FDR < 0.1) in MIA PaCa-2 cells treated with SCH772984 (1 µM) compared to DMSO (1:1,000) for either one week (early) or eight weeks (stable resistance), performed in duplicate. (f) Scatter plot comparing gene expression changes in MIA PaCa-2 cells treated with SCH772984 (1 µM) compared to DMSO (1:1000) for either one week (early) or eight weeks (stable resistance), performed in triplicate. Each dot represents a single gene, with colored dots representing statistically significant (p < 10−3) gene expression changes at the indicated time points, with statistical significance determined by Wald test using the Benjamini and Hochberg method to correct for multiple hypothesis testing. Error bars represent standard deviations.
Fig. 2
Fig. 2. Inhibition of CDK8/19 and other epigenetic modifiers prevents resistance to ERK/MAPK inhibition.
a Scatter plots comparing gene expression changes in SW1573 cells (left) and SW620 cells (right) treated with SCH772984 (1 µM) compared to DMSO (1:1000) for either one week (early) or eight weeks (stable resistance), each performed in triplicate. Each dot represents a single gene, with colored dots representing statistically significant (p < 10−3) gene expression changes at the indicated time points, with statistical significance determined by Wald test using the Benjamini and Hochberg method to correct for multiple hypothesis testing. b Venn diagram depicting differentially expressed genes (p < 10−3) in MIA PaCa-2, SW1573, and SW620 cells treated with SCH772984 (1 µM) relative to DMSO (1:1000) for eight weeks (stable resistance). c Reverse volcano plot depicting gene set enrichment analysis gene sets from the MsigDB Biologic Process Ontology based on the gene expression data from Fig. 2b; Venn diagram depicting enriched gene sets with an FDR < 0.1 (insert). d Schematic representation of the transcriptional modifier pharmacologic screen (left). The heatmap (right) demonstrates the ratio of cell doublings of MIA PaCa-2 cells co-treated with the indicated epigenetic modifier and MAPK inhibitor compared to that MAPK inhibitor alone for three weeks, with each row representing a single biologic replicate. The doubling ratio is plotted, which is calculated as the number of doublings per experimental condition compared to control condition. e Crystal violet staining of 21-day colony growth in MIA PaCa-2 cells treated with the indicated drug combinations, performed in triplicate. f Immunoblot of MIA PaCa-2 cells with indicated genetic modifications (top); the doubling ratio of those same populations treated with Senexin A (1 µM) relative to DMSO (1:1000) for two weeks, either alone (basal growth) or in the presence of SCH772984 (1 µM) (bottom), each condition performed in triplicate. g Eight-point growth inhibition assay of MIA PaCa-2 cells (left), SW620 cells (middle), and SW1573 cells (right) treated with increasing concentrations of SCH772984 in the background of Senexin A (1 µM) or DMSO (1:1000) for four days (top), each condition performed in triplicate; TTP assay of those same cell lines and drug conditions for eight weeks of treatment, each condition performed in triplicate. Error bars represent standard deviations.
Fig. 3
Fig. 3. Co-inhibition of CDK8/19 paralyzes long-term transcriptional adaptations by antagonizing the early response to ERK inhibition.
a Venn diagram depicting differentially expressed genes (p < 10−3) in MIA PaCa-2, SW1573, and SW620 cells treated with SCH772984 (1 µM) relative to DMSO (1:1000) for one week, performed in triplicate, with statistical significance determined by Wald test using the Benjamini and Hochberg method to correct for multiple hypothesis testing. b Reverse volcano plot depicting gene set enrichment analysis using gene sets from the MsigDB Biologic Process Ontology based on the gene expression data from Fig. 3a; Venn diagram depicting enriched gene sets with an FDR < 0.1 (insert). c In MIA PaCa-2, SW1573, and SW620 cells, odds that genes significantly dysregulated by treatment with SCH772984 for one week (1 µM, p < 0.001 by Wald statistic) are further up- or downregulated by co-treatment with Senexin A (1 µM), relative to genes that are not significantly dysregulated by treatment with ERK inhibition; p-value calculated according to Sheskin method. d In these same cell lines, percent of transcripts significantly dysregulated by SCH772984 (1 µM) for which treatment with Senexin A (1 µM) antagonizes or cooperates with these gene expression changes. e Heatmap (top) depicts differential expression of all genes within the assigned 67 DPGP clusters for MIA PaCa-2 cells treated with SCH772984 (1 µM) relative to DMSO (1:1000) at the indicated time points; restricted cubic splines of the mean differential expression of each cluster at each time point (bottom). f Restricted cubic spline of all genes in representative clusters 1 and 3 treated with SCH772984 (1 µM) alone or in combination with Senexin A (1 µM), with the bolded curves representing mean expression changes of each cluster according to treatment condition; the curves on the top reflect equivalent time points for the two treatment conditions, while on the bottom the SCH772984 alone curve is right-shifted by the indicated time intervals. g Bubble charts reflecting the mean expression changes of each cluster according to treatment condition at one week (left) versus three weeks (right), with the size of each bubble reflecting the number of genes in each cluster. h Bubble charts reflecting the mean expression changes of each cluster for MIA PaCa-2 cells treated with SCH772984 (1 µM) for three weeks compared to SCH772984 (1 µM) and Senexin A (1 µM) for five weeks, with the size of each bubble reflecting the number of genes in each cluster. ****p < 0.0001. Error bars represent standard deviations.
Fig. 4
Fig. 4. Transcriptional plasticity permits diverse mechanisms of resistance to ERK/MAPK inhibition.
a Schematic depicting CRISPR/Cas9 loss-of-function screen. b Replicate-to-replicate comparison of gene-level essentiality phenotypes in MIA PaCa-2 cells treated with DMSO (1:1000) alone. Essential controls are shown in red, non-essential controls in blue, and non-targeting controls in yellow. c Scatter plot of genes included in loss-of-function screen comparing gene expression changes in MIA PaCa-2 cells treated with SCH772984 (1 µM) compared to DMSO (1:1000) for either one week (early) or eight weeks (stable resistance), with loss-of-function gene score indicated by color gradient. Gene score is calculated as the log2 fold change of the fractional representations (time final/time zero) of resistant cells treated with SCH772984 (1 µM) compared to parental cells treated with DMSO (1:1000) at the screen midpoint (19 days). d Gene-level representation of essential phenotypes in evolved resistant MIA PaCa-2 cells treated with SCH772984 (1 µM) at the screen midpoint (19 days), ranked by their mean log2-transformed gene score across duplicates; the insert shows the effect of ABCG2 loss in parental cells treated with DMSO (1:1000, left), resistant cells treated with SCH772984 (1 µM, middle), and resistant cells treated with DMSO (1:1000, right) at all three screen time points (15, 19, and 23 days). e Immunoblot of treatment-naïve parental MIA PaCa-2 cells and three independently evolved resistant derivatives of this same cell line to SCH772984 (1 µM). f Crystal violet staining of MIA Paca-2 cells evolved resistant to SCH772984 (1 µM) with either no alteration, control knockout, or ABCG2 knockout, treated with either SCH772984 (1 µM) or DMSO (1:1000) for one week; representative photograph of all conditions performed in triplicate. g Eight-point growth inhibition assay of parental and evolved resistant MIA PaCA-2 cells treated with increasing concentrations of SCH772984, performed in triplicate; one triplicate set of evolved resistant cells is treated with the ABCG2 inhibitor Elacridar (1 µM) in the background. h GI50 values derived from eight-point dose-response curves of parental and evolved resistant MIA PaCA-2 cells treated with increasing concentrations of the indicated chemotherapies, with and without Elacridar (1 µM). i Genome browser view of ChIP-seq tracks across the ABCG2 gene coding locus depicting H3K27Ac density in MIA PaCa-2 cell treated with DMSO (1:1000, parental), SCH772984 (1 µM) for one week (Early), or SCH772984 (1 µM) for eight weeks (Resistant); known enhancer elements within the ABCG2 coding region are depicted with blue boxes. Error bars represent standard deviations.
Fig. 5
Fig. 5. Cotargeting mediator kinase prevents resistance to ERK/MAPK inhibition.
a Bar chart depicting the time at which resistance emerged to treatment with either SCH772984 (1 µM) alone or SCH772984 (1 µM) in combination with Senexin A (1 µM). b Oncoplot of three rectal cancer tumoroids based on MSK-IMPACT testing (top), with representative micrographs below of RC-MSK-001 patient tumor (left) and its corresponding tumoroid (right). c TTP assays for rectal cancer tumoroids treated with SCH772984 (100 nM) alone or in combination with Senexin A (1 µM). d Relative viability of rectal cancer tumoroids treated with Senexin A (1 µM) compared to DMSO (1:1000) for 14 days. e Crystal violet staining of 14 day colony growth of 2.1.1syn_Luc cells treated with the indicated drug combinations. Box plot demonstrating whole body luminescence (f) and tumor weights (g) after orthotopic implantation of 103 2.1.1syn_Luc cells into FVB/n mice and treatment with SCH772984 (35 mg/kg) in combination with or without CCT251545 (75 mg/kg) for 21 days, 10 mice per group. g Mean mouse weights throughout treatment described in Fig. 5f, g. Error bars represent standard deviations.

Update of

Similar articles

Cited by

References

    1. Ryan MB, Der CJ, Wang-Gillam A, Cox AD. Targeting RAS-mutant cancers: is ERK the key? Trends Cancer. 2015;1:183–198. doi: 10.1016/j.trecan.2015.10.001. - DOI - PMC - PubMed
    1. Samatar AA, Poulikakos PI. Targeting RAS-ERK signalling in cancer: promises and challenges. Nat. Rev. Drug Discov. 2014;13:928–942. doi: 10.1038/nrd4281. - DOI - PubMed
    1. Chapman PB, et al. Improved survival with vemurafenib in melanoma with BRAF V600E mutation. N. Engl. J. Med. 2011;364:2507–2516. doi: 10.1056/NEJMoa1103782. - DOI - PMC - PubMed
    1. Flaherty KT, et al. Improved survival with MEK inhibition in BRAF-mutated melanoma. N. Engl. J. Med. 2012;367:107–114. doi: 10.1056/NEJMoa1203421. - DOI - PubMed
    1. Pratilas CA, Solit DB. Targeting the mitogen-activated protein kinase pathway: physiological feedback and drug response. Clin. Cancer Res. 2010;16:3329–3334. doi: 10.1158/1078-0432.CCR-09-3064. - DOI - PMC - PubMed