

Role of CSF1R 550th-tryptophan in kusunokinin and CSF1R inhibitor binding and ligand-induced structural effect
- PMID: 38822100
- PMCID: PMC11143223
- DOI: 10.1038/s41598-024-63505-x
Role of CSF1R 550th-tryptophan in kusunokinin and CSF1R inhibitor binding and ligand-induced structural effect
Abstract
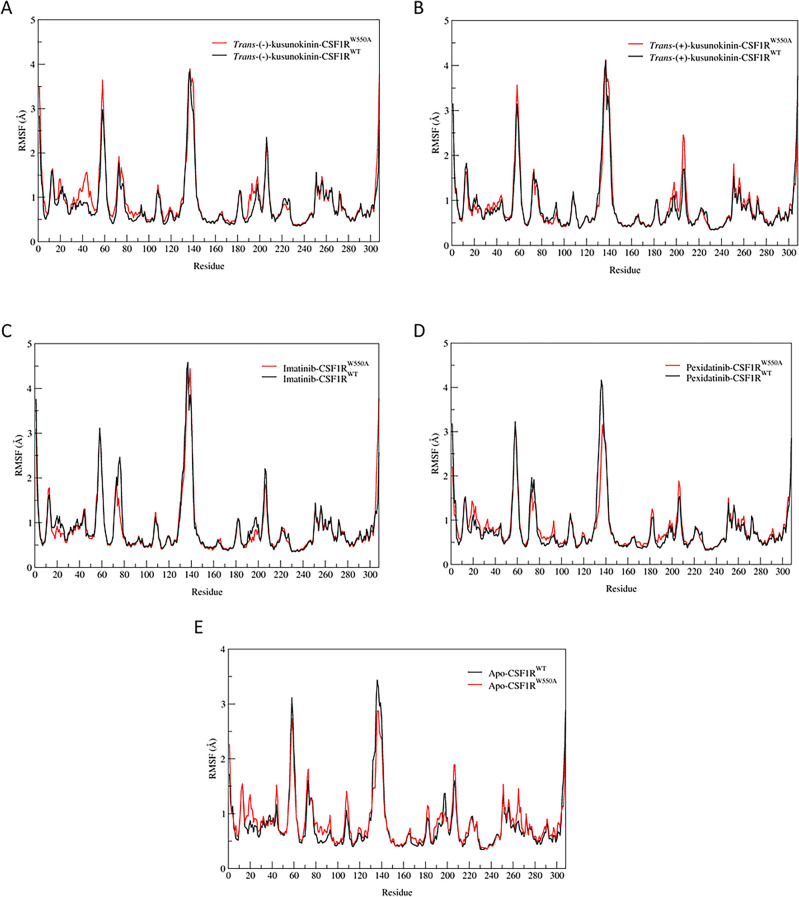
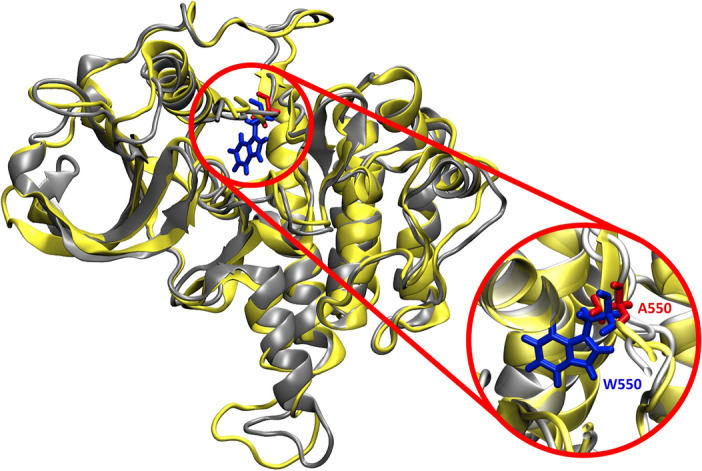
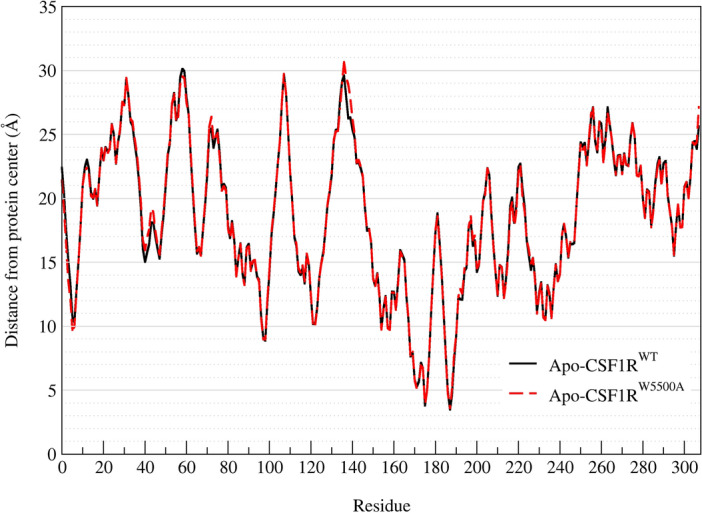
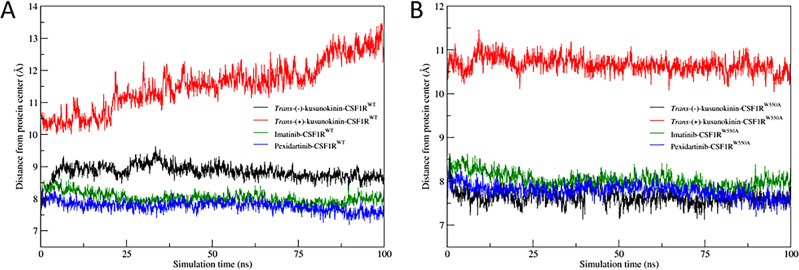
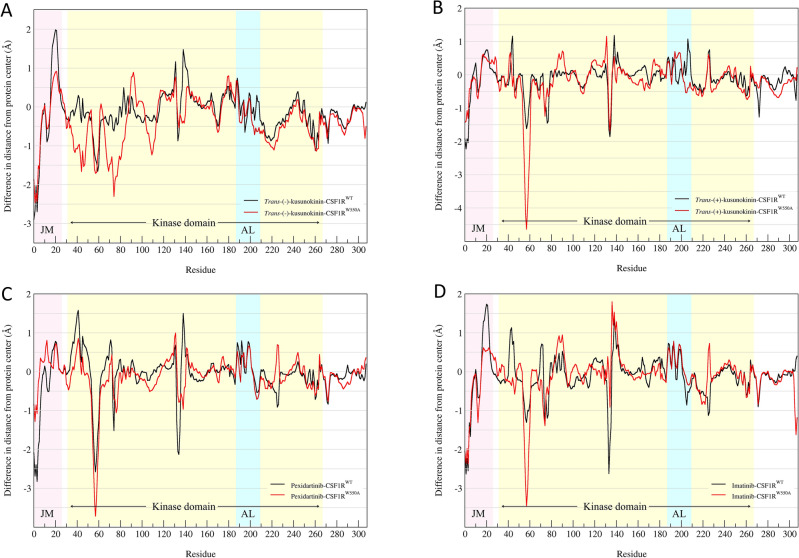
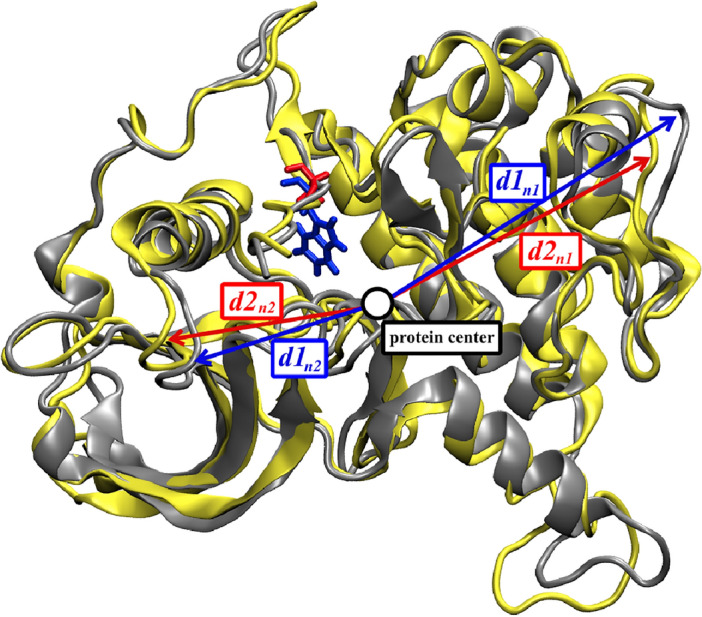
Binding affinity is an important factor in drug design to improve drug-target selectivity and specificity. In this study, in silico techniques based on molecular docking followed by molecular dynamics (MD) simulations were utilized to identify the key residue(s) for CSF1R binding affinity among 14 pan-tyrosine kinase inhibitors and 15 CSF1R-specific inhibitors. We found tryptophan at position 550 (W550) on the CSF1R binding site interacted with the inhibitors' aromatic ring in a π-π way that made the ligands better at binding. Upon W550-Alanine substitution (W550A), the binding affinity of trans-(-)-kusunokinin and imatinib to CSF1R was significantly decreased. However, in terms of structural features, W550 did not significantly affect overall CSF1R structure, but provided destabilizing effect upon mutation. The W550A also did not either cause ligand to change its binding site or conformational changes due to ligand binding. As a result of our findings, the π-π interaction with W550's aromatic ring could be still the choice for increasing binding affinity to CSF1R. Nevertheless, our study showed that the increasing binding to W550 of the design ligand may not ensure CSF1R specificity and inhibition since W550-ligand bound state did not induce significantly conformational change into inactive state.
© 2024. The Author(s).
Conflict of interest statement
The authors declare no competing interests.
Figures


Similar articles
-
Inhibition of CSF1R and AKT by (±)-kusunokinin hinders breast cancer cell proliferation.Biomed Pharmacother. 2020 Sep;129:110361. doi: 10.1016/j.biopha.2020.110361. Epub 2020 Jun 11. Biomed Pharmacother. 2020. PMID: 32535390
-
Identification, synthesis and evaluation of CSF1R inhibitors using fragment based drug design.Comput Biol Chem. 2019 Jun;80:374-383. doi: 10.1016/j.compbiolchem.2019.04.015. Epub 2019 May 2. Comput Biol Chem. 2019. PMID: 31103918
-
Potential Stereoselective Binding of Trans-(±)-Kusunokinin and Cis-(±)-Kusunokinin Isomers to CSF1R.Molecules. 2022 Jun 29;27(13):4194. doi: 10.3390/molecules27134194. Molecules. 2022. PMID: 35807438 Free PMC article.
-
Colony-stimulating factor 1 receptor (CSF1R) inhibitors in cancer therapy.J Immunother Cancer. 2017 Jul 18;5(1):53. doi: 10.1186/s40425-017-0257-y. J Immunother Cancer. 2017. PMID: 28716061 Free PMC article. Review.
-
CSF1R inhibitors are emerging immunotherapeutic drugs for cancer treatment.Eur J Med Chem. 2023 Jan 5;245(Pt 1):114884. doi: 10.1016/j.ejmech.2022.114884. Epub 2022 Oct 29. Eur J Med Chem. 2023. PMID: 36335744 Review.
Cited by
-
Octanoic Acid and Decanoic Acid Inhibit Tunicamycin-Induced ER Stress in Rat Aortic Smooth Muscle Cells.Adv Pharmacol Pharm Sci. 2024 Nov 26;2024:9076988. doi: 10.1155/adpp/9076988. eCollection 2024. Adv Pharmacol Pharm Sci. 2024. PMID: 39628939 Free PMC article.
-
Role of Non-Binding T63 Alteration in IL-18 Binding.Int J Mol Sci. 2024 Dec 3;25(23):12992. doi: 10.3390/ijms252312992. Int J Mol Sci. 2024. PMID: 39684709 Free PMC article.
References
MeSH terms
Substances
Grants and funding
- Grant No. 63-006/Graduate Scholarship from Faculty of Medicine, Prince of Songkla University
- Grant No. MED6601223S/Fundamental Fund 2566 (FF66) from Thailand Science Research and Innovation, Thailand
- Grant no. MR-PSU: 66-38-23-115/Faculty of Medicine, Prince of Songkla University, Songkhla, Thailand
LinkOut - more resources
Full Text Sources
Research Materials
Miscellaneous
