. 2024 May 31;29(1):84.
doi: 10.1186/s11658-024-00601-w.

AGR2-mediated unconventional secretion of 14-3-3ε and α-actinin-4, responsive to ER stress and autophagy, drives chemotaxis in canine mammary tumor cells

Affiliations

AGR2-mediated unconventional secretion of 14-3-3ε and α-actinin-4, responsive to ER stress and autophagy, drives chemotaxis in canine mammary tumor cells

Stephen Hsien-Chi Yuan et al. Cell Mol Biol Lett. .

Abstract

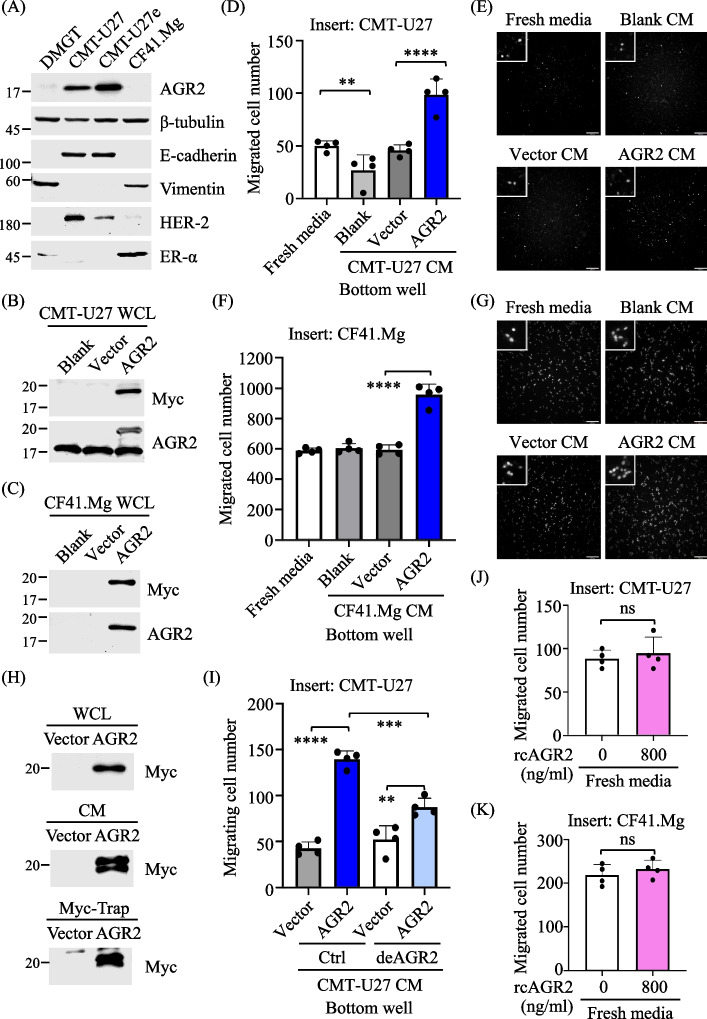
Background: Canine mammary tumors (CMTs) in intact female dogs provide a natural model for investigating metastatic human cancers. Our prior research identified elevated expression of Anterior Gradient 2 (AGR2), a protein disulfide isomerase (PDI) primarily found in the endoplasmic reticulum (ER), in CMT tissues, highly associated with CMT progression. We further demonstrated that increased AGR2 expression actively influences the extracellular microenvironment, promoting chemotaxis in CMT cells. Unraveling the underlying mechanisms is crucial for assessing the potential of therapeutically targeting AGR2 as a strategy to inhibit a pro-metastatic microenvironment and impede tumor metastasis.

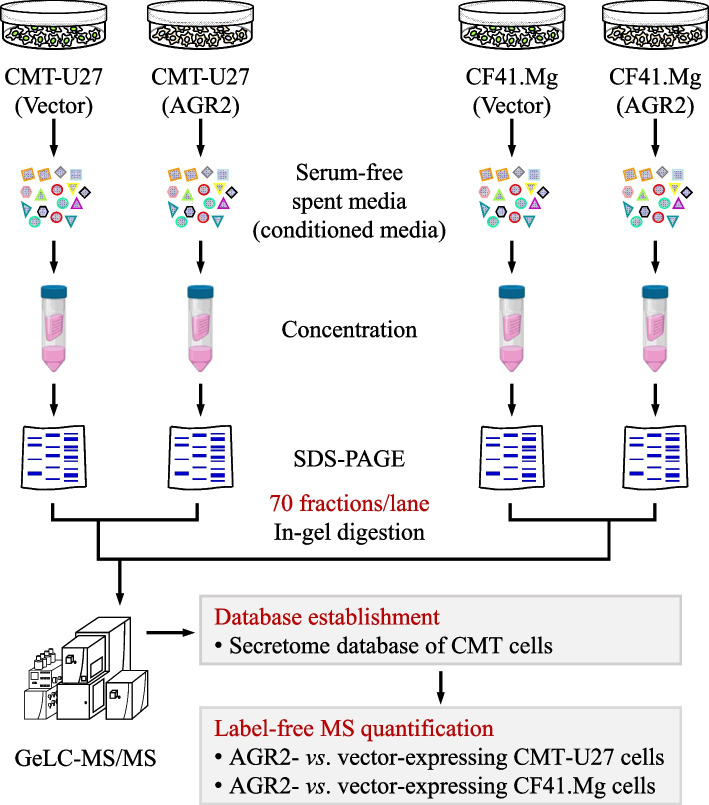
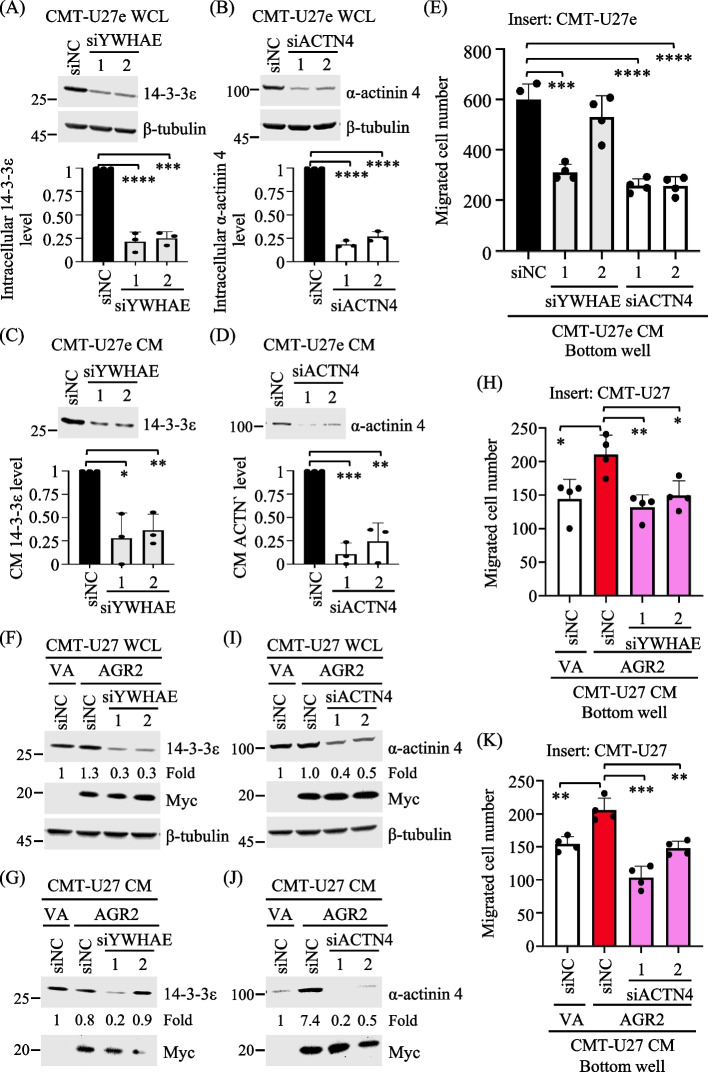
Methods: To identify the AGR2-modulated secretome, we employed proteomics analysis of the conditioned media (CM) from two CMT cell lines ectopically expressing AGR2, compared with corresponding vector-expressing controls. AGR2-regulated release of 14-3-3ε (gene: YWHAE) and α-actinin 4 (gene: ACTN4) was validated through ectopic expression, knockdown, and knockout of the AGR2 gene in CMT cells. Extracellular vesicles derived from CMT cells were isolated using either differential ultracentrifugation or size exclusion chromatography. The roles of 14-3-3ε and α-actinin 4 in the chemotaxis driven by the AGR2-modulated CM were investigated through gene knockdown, antibody-mediated interference, and recombinant protein supplement. Furthermore, the clinical relevance of the release of 14-3-3ε and α-actinin 4 was assessed using CMT tissue-immersed saline and sera from CMT-afflicted dogs.

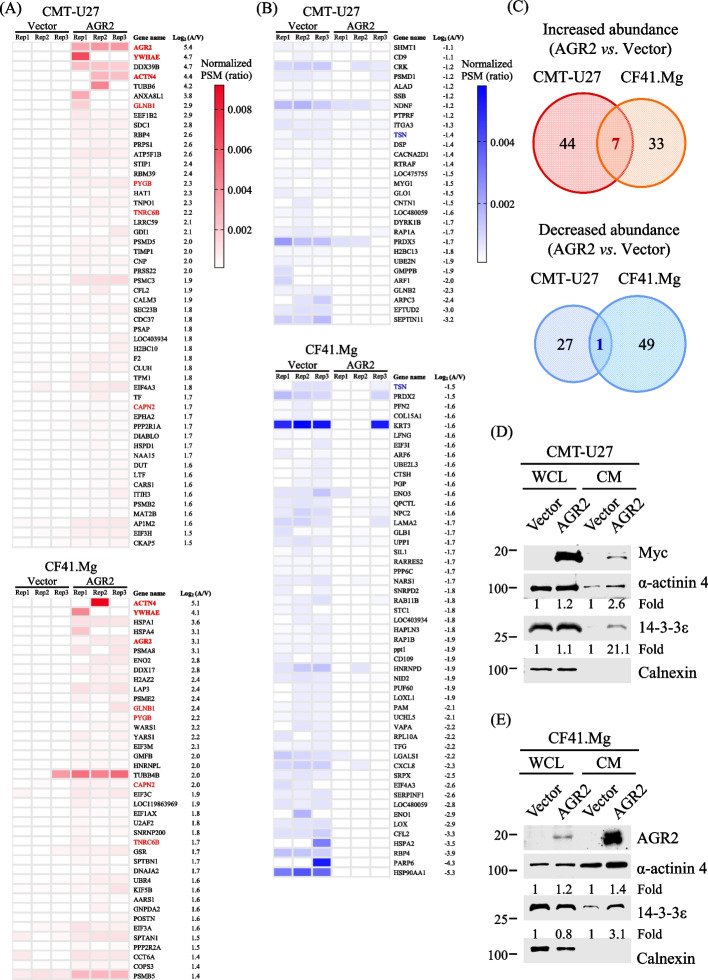
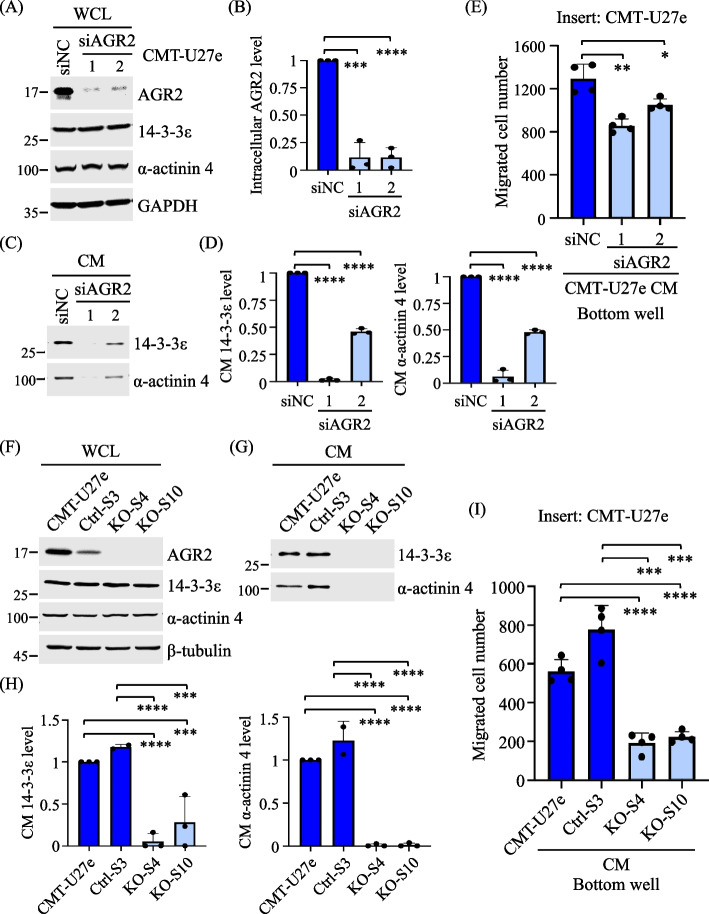
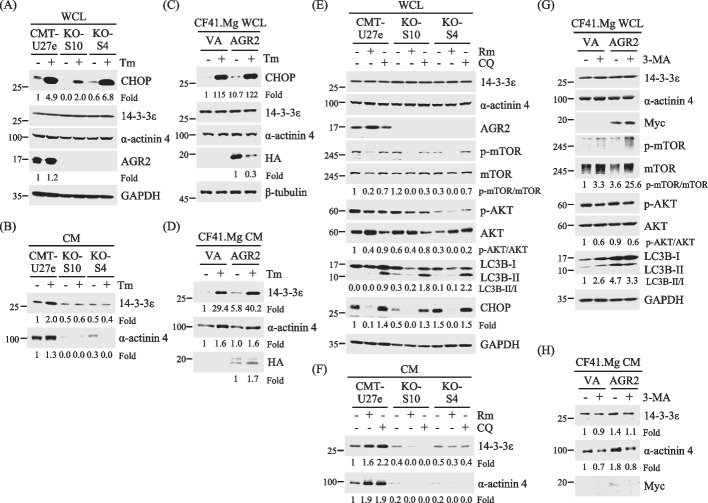
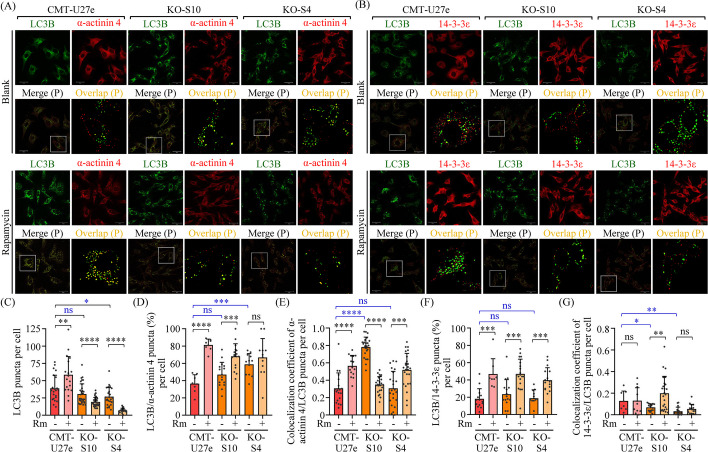
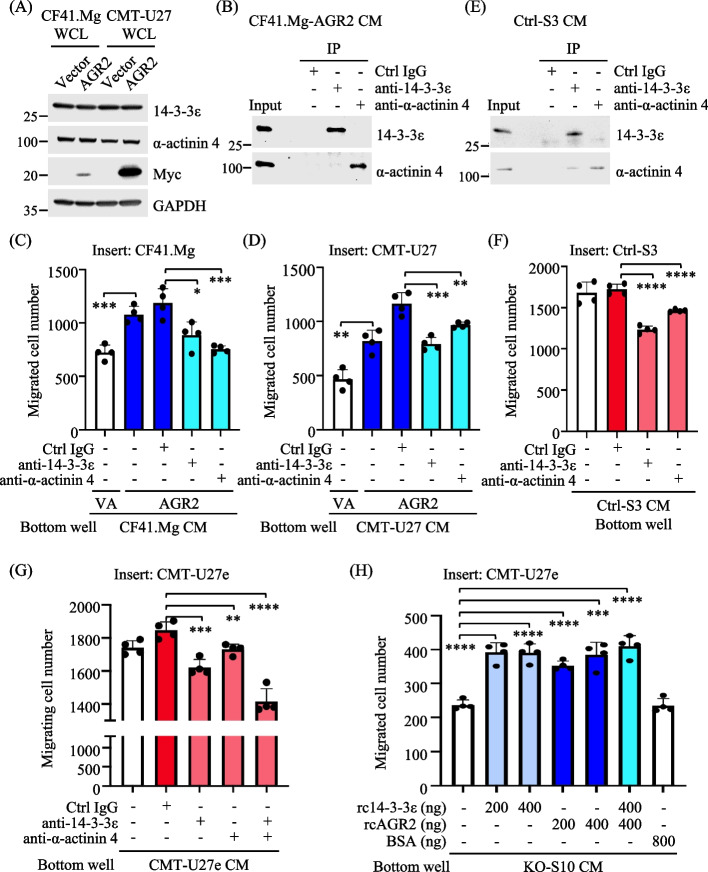
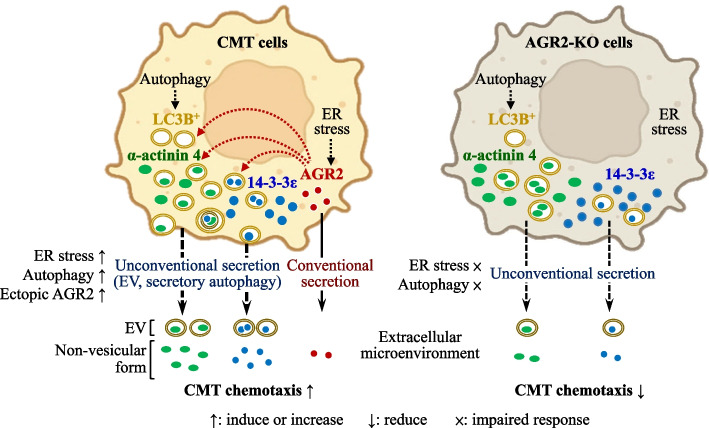
Results: Proteomics analysis of the AGR2-modulated secretome revealed increased abundance in 14-3-3ε and α-actinin 4. Ectopic expression of AGR2 significantly increased the release of 14-3-3ε and α-actinin 4 in the CM. Conversely, knockdown or knockout of AGR2 expression remarkably reduced their release. Silencing 14-3-3ε or α-actinin 4 expression diminished the chemotaxis driven by AGR2-modulated CM. Furthermore, AGR2 controls the release of 14-3-3ε and α-actinin 4 primarily via non-vesicular routes, responding to the endoplasmic reticulum (ER) stress and autophagy activation. Knockout of AGR2 resulted in increased α-actinin 4 accumulation and impaired 14-3-3ε translocation in autophagosomes. Depletion of extracellular 14-3-3ε or α-actinin 4 reduced the chemotaxis driven by AGR2-modulated CM, whereas supplement with recombinant 14-3-3ε in the CM enhanced the CM-driven chemotaxis. Notably, elevated levels of 14-3-3ε or α-actinin 4 were observed in CMT tissue-immersed saline compared with paired non-tumor samples and in the sera of CMT dogs compared with healthy dogs.

Conclusion: This study elucidates AGR2's pivotal role in orchestrating unconventional secretion of 14-3-3ε and α-actinin 4 from CMT cells, thereby contributing to paracrine-mediated chemotaxis. The insight into the intricate interplay between AGR2-involved ER stress, autophagy, and unconventional secretion provides a foundation for refining strategies aimed at impeding metastasis in both canine mammary tumors and potentially human cancers.

Keywords: 14-3-3 Epsilon (YWHAE); Alpha-actinin 4 (ACTN4); Anterior gradient 2 (AGR2); Canine mammary tumor (CMT); Chemotaxis; Microenvironment; Proteomics; Unconventional protein secretion.


Conflict of interest statement

The authors declare that they have no competing interests.

Figures

Fig. 1
Fig. 1
Ectopic expression of AGR2 modulated extracellular milieu of CMT cells, promoting CMT cell chemotaxis. A Characterization of CMT cell lines. Expression of AGR2, E-cadherin, vimentin, HER-2, or ER-⍺ in individual cell lines was analyzed by immunoblotting with specific antibodies. CMT-U27 (B) and CF41.Mg (C) were transfected with pcDNA3.1-myc.His-AGR2 or the mock vector and grown in 2% FBS-containing RPMI and DMEM, respectively, for 24 h. Whole-cell lysates (WCL) of the transfectants were analyzed by immunoblotting to confirm the expression of Myc-tagged AGR2. Conditioned media (CM) of the transfectants were collected and placed in the bottom well for a transwell migration assay, in which the responding cells were seeded in the top insert and stained with Hoechst during a 16-h incubation. Cells in the insert were fixed for image acquisition using an epifluorescence microscope with a 10 × objective. D, F The number of migrated cells was counted and presented as the mean + SD of three independent experiments. E, G Representative images of migrated cells per field were shown. H Myc-Trap-based precipitation conducted the depletion of AGR2 in the CM of AGR2-expressing CMT-U27. Expression of AGR2 in WCL or CM and Myc-Trap-precipitated AGR2 were verified by immunoblotting. I As described above, the AGR2-depleted CM (denoted deAGR2) or the untreated control was placed in the bottom well for a transwell migration assay. J, K Fresh 2% FBS-containing media supplemented with or without rcAGR2 (800 ng/mL) were placed in the bottom well for a transwell migration assay. For C, F, I–K, statistical significance was determined by a two-tailed unpaired t-test. *p < 0.05; **p < 0.01; ****p < 0.0001
Fig. 2
Fig. 2
Identification of AGR2-affected secretome of CMT cells. Schematic diagram for identification of AGR2-affected secretome. Serum-free conditioned media (CM) were prepared from CMT cells (CMT-U27 or CF41.Mg) which had been transfected with pcDNA3.1-myc.His-AGR2 or the mock vector and were grown for another 24 h to 90% confluency. The CM samples were concentrated and resolved by SDS-PAGE and subsequently stained with 0.5% Coomassie Brilliant Blue G-250. Individual protein lanes were cut into gel slices and applied to in-gel digestion, and the resulting peptides were analyzed using a GeLC-MS/MS-based proteomics pipeline. The abundance of identified proteins was determined by label-free MS quantification
Fig. 3
Fig. 3
Differentially present proteins in the CM of AGR2-expressing CMT cells. A, B Heatmap of the proteins identified as AGR2-increased (A) and AGR2-decreased (B) in the CM of CMT-U27 or CF41.Mg. Each CM sample was triply analyzed (Rep1, Rep2, Rep3). Protein abundance was determined by normalizing PSMs of specific proteins to total PSMs in replicates. Cumulative normalized PSM ratios of AGR2-expressing CM were divided by vector-expressing CM. This ratio underwent logarithmic transformation (Log2) as Log2 (A/V). Proteins with Log2 (A/V) above mean + 1.5 SD were classified as AGR2-increased; below mean-1.5 SD were designated as AGR2-decreased. AGR2-increased and AGR2-decreased proteins which are in common in both CMT-U27 CM and CF41.Mg CM are highlighted in red (A) and blue (B), respectively, and are shown in the overlap of Venn diagrams (C). D, E Verification of increased 14-3-3ε and α-actinin 4 levels in the CM of AGR2-expressing CMT cells. CMT-U27 (D) or CF41.Mg (E) cells transfected with the AGR2-expressing or the mock vector were grown in serum-free CM for 24 h, and the CM samples were collected and concentrated. The concentrated CM and whole-cell lysate (WCL) were analyzed by immunoblotting with indicated specific antibodies. Levels of 14-3-3ε and α-actinin 4 in the AGR2-expressing group were presented as fold changes to that in the vector group. Calnexin was used as a negative control in the CM
Fig. 4
Fig. 4
Genetic depletion of AGR2 impaired 14-3-3ε and α-actinin 4 release in the CM of CMT cells. A CMT-U27e transfected with AGR2-targeting siRNA (siAGR2 1 or 2) or negative control siRNA (siNC) was grown in 1% FBS-containing RPMI for 30 h. WCL and CM samples were collected and subjected to immunoblotting analysis. Protein bands were quantified and normalized to that of GAPDH, which was used as an internal control. AGR2 expression levels in siAGR2 transfectants were presented as a ratio to that in siNC transfectants. Data were presented as the mean + SD of three independent experiments, shown in B. C CM samples collected from (A) were TCA-precipitated, and 14-3-3ε and α-actinin 4 levels were analyzed by immunoblotting and quantified as described above. Data are presented as the mean + SD of three independent experiments, shown in D. E CM collected from (A) was applied to a transwell migration. Results are presented as the mean + SD of three independent experiments. F, G CMT-U27e, a control cell clone Ctrl-S3, and two AGR2-KO clones, KO-S4 and KO-S10, were grown in 1% FBS-containing RPMI for 24 h. WCL and CM samples were collected and analyzed by immunoblotting, as shown in F and G, respectively. 14-3-3ε and α-actinin 4 levels in individual CM samples are presented as a ratio to that in CMT-U27e, as shown in H. I CM collected from individual cell clones was applied to a transwell migration assay. Results are presented as the mean + SD of three independent experiments *p < 0.05; **p < 0.01; ***p < 0.001; ****p < 0.0001 (two-tailed unpaired t-test)
Fig. 5
Fig. 5
Knockdown of 14-3-3ε or α-actinin 4 diminished the chemotaxis conferred by AGR2-modulated CM. A, B CMT-U27e transfected with 14-3-3ε-targeting siRNA, siYWHAE (A), α-actinin 4-targeting siRNA, siACTN4 (B), or negative control siRNA (siNC) were grown in 1% FBS-containing RPMI for 30 h. WCL samples were harvested and analyzed by immunoblotting. 14-3-3ε and α-actinin 4 levels were normalized to β-tubulin levels in individual samples, and the resulting values in siYWHAE- or siACTN4-transfectants were presented as a ratio to that in siNC. C, D 14-3-3ε and α-actinin 4 levels in the CM samples collected respectively from (A) and (B) were analyzed by immunoblotting and processed as above. E CM samples collected from (B, D) were applied to a transwell migration assay. F, G, I, J CMT-U27e cells were first transfected with the indicated siRNA (75 nM) and subsequently transfected with pcDNA3.1-myc.His-AGR2 or the mock control 6 h later. After 8 h incubation, the culture media were replaced with 1% FBS-containing RPMI, and cells were grown for another 20 h until WCL and CM were collected. Levels of indicated proteins in individual WCL (F, I) and CM (G, J) were analyzed and quantified as described above. H, K CM samples collected from (I, J) were applied to a transwell migration assay. All quantitation data shown are the mean + SD of three independent experiments. *p < 0.05; **p < 0.01; ***p < 0.001; ****p < 0.0001 (two-tailed unpaired t-test)
Fig. 6
Fig. 6
AGR2 modulated the release of 14-3-3ε and α-actinin 4 upon ER stress and autophagy induction. A, B CMT-U27e or AGR2-KO clones (KO-S10 and KO-S4) were cultured in 1% FBS-containing RMPI and treated with or without 50 nM tunicamycin (denoted Tm) for 14 h. Cell lysate (WCL) samples were collected and subjected to immunoblotting analysis with antibodies specific to indicated proteins. The CM samples were further TCA-precipitated to analyze 14-3-3ε or α-actinin 4 levels with immunoblotting (B). C, D CF41.Mg transfected with pcDNA3.1-HA-AGR2 or the mock control were subsequently cultured in 1% FBS-containing DMED for 14 h with or without addition of 50 nM Tm. Levels of the indicated proteins in WCL (C) and CM (D) were analyzed by immunoblotting. E, F CMT-U27e, KO-S10, or KO-S4 were cultured in serum-free RPMI and treated with 300 nM rapamycin (denoted Rm) or 40 µM chloroquine (denoted CQ) for 16 h. Levels of the indicated proteins in WCL (E) and CM (F) were analyzed by immunoblotting. G, H CF41.Mg transfected with pcDNA3.1-myc.His-AGR2 or the mock control was cultured in serum-free DMEM supplemented with or without 3-MA (2 mM) for 16 h. Levels of the indicated proteins in WCL (G) and CM (H) were analyzed by immunoblotting. The present results were representative data from three independent experiments
Fig. 7
Fig. 7
Depletion of AGR2 resulted in aberrant translocation of 14-3-3ε or α-actinin 4 to the autophagosome. CMT-U27e, KO-S10, and KO-S4 seeded on coverslips were cultured in serum-free RPMI for 16 h, with or without adding 50 nM rapamycin (Rm). The cells were subsequently fixed and subjected to immunofluorescence staining of α-actinin 4 (A) or 14-3-3ε (B), together with LC3B. The resulting images were acquired using confocal microscopy. Puncta exhibiting LC3B (i.e., autophagosomes), α-actinin 4, or 14-3-3ε were identified using a Difference of Gaussian processing filter and presented in overlay images, denoted Merge (P). Scale bar, 20 µm. Colocalization of α-actinin 4 puncta with LC3B puncta, or 14-3-3ε puncta with LC3B puncta, were shown as overlap regions (yellow) in the enlargement, denoted Overlap (P). The number of LC3B puncta per cell (C) and the percentage of the LC3B puncta exhibiting colocalization with α-actinin 4 (D) or with 14-3-3ε (F) across all the experimental groups were quantified. Colocalization coefficients were measured for the puncta showing α-actinin 4-LC3B colocalization (E) and those showing 14-3-3ε-LC3B colocalization (G) per cell. The data in panels (C) through (G) were presented as the mean + SD
Fig. 8
Fig. 8
Extracellular 14-3-3ε and α-actinin 4 conferred the chemotaxis effect of AGR2-modulated CM. A WCL and CM samples of CF41.Mg or CMT-U27 transfected with pcDNA3.1-myc.His-AGR2 or the mock control were collected as described previously. Levels of indicated proteins in individual WCL samples were analyzed by immunoblotting. B CM of AGR-expressing CF41.Mg was deprived of 14-3-3ε or α-actinin 4 by immunoprecipitation (IP). Input CM and IP protein products were analyzed by immunoblotting. C, D CM samples before and after IP were subjected to a transwell migration assay. E CM samples of Ctrl-S3 cells grown at sub-confluency were collected and applied to IP, followed by immunoblotting analysis as described in B. FG CM samples of Ctrl-S3 (F) or CMT-U27e (G) cells supplied with the indicated antibodies (3 μg each) were placed in the bottom well for a transwell migration assay. H CM of KO-S10 supplied with rcAGR2, rc14-3-3ε, or BSA at the indicated concentration was placed in the bottom well for a transwell migration assay. Data of all transwell migration assays were presented as the mean + SD (n = 4), and a two-tailed unpaired t-test determined statistical significance. *p < 0.05; **p < 0.01; ***p < 0.001; ****p < 0.0001
Fig. 9
Fig. 9
Elevated levels of 14-3-3ε and α-actinin 4 in CMT tissue-immersed PBS and sera of CMT-afflicted dogs. A Paired samples of CMT tissues (labeled C) and non-involved mammary gland tissues (labeled N) were obtained from nine female dogs afflicted with CMT. The tissue-immersed PBS samples were collected after one-hour incubation, and the tissue-released proteins were precipitated with TCA for immunoblotting analysis (10 μg of each sample) of 14-3-3ε and α-actinin 4. The CMT sample of patient #4 was replicated in two blots. Results were quantified and presented as fold changes of CMT over paired non-tumor samples. For patient#3, a fold change of CMT was calculated by comparing to the mean of all non-tumor samples. B Elevated levels of 14-3-3ε and α-actinin 4 were observed in CMT tissue-immersed PBS compared with non-tumor tissue-immersed samples. Data from all samples were normalized by the mean of total non-tumor samples. Statistical analysis was conducted using the Mann–Whitney U test. **p < 0.01. C Sera were collected from 17 female dogs afflicted with CMT and 15 age-matched healthy female dogs. Each serum sample (1 μL) was diluted in PBS, mixed with 4 × sampling buffer and subjected to SDS-PAGE with two gels. One gel was stained with Coomassie Brilliant Blue G-250, while the other was used for immunoblotting analysis. To quantify the levels of 14-3-3ε and α-actinin 4 in serum samples, the blot intensity of 14-3-3ε or α-actinin 4 was divided by the intensity of the entire lane of proteins stained with Coomassie Brilliant Blue for each sample. The resulting ratio was then normalized by the mean ratio of all healthy samples to acquire a normalized level for comparison. D Elevated levels of 14-3-3ε and α-actinin 4 were observed in sera from CMT-afflicted dogs compared with those in sera from healthy dogs. Statistical analysis was conducted with the Mann–Whitney U test. **p < 0.01
Fig. 10
Fig. 10
Schematic illustration of a proposed model for how AGR2 controls the release of 14-3-3ε and α-actinin 4 to promote chemotaxis of CMT cells. AGR2 functions as a stress sensor, regulating proteostasis by controlling the release of unconventional secretory proteins. Upon serum starvation, tunicamycin-induced ER stress, or rapamycin-induced autophagy, AGR2 expression promotes the release of 14-3-3ε and α-actinin 4 into the extracellular microenvironment, thereby enhancing chemotaxis in CMT cells. This controlled release of 14-3-3ε and α-actinin 4 by AGR2 involves extracellular vesicle (EV)-mediated delivery and secretory autophagy. Depletion of AGR2 leads to a reduced release of 14-3-3ε and α-actinin 4 in response to serum starvation, ER stress, or autophagy induction. Additionally, the absence of AGR2 can result in diminished uptake of 14-3-3ε within the LC3B+ autophagosome and impaired export of α-actinin 4 through the LC3B+ autophagosome

Similar articles

Cited by

References

    1. Rowell JL, McCarthy DO, Alvarez CE. Dog models of naturally occurring cancer. Trends Mol Med. 2011;17(7):380–388. doi: 10.1016/j.molmed.2011.02.004. - DOI - PMC - PubMed
    1. LeBlanc AK, Mazcko CN. Improving human cancer therapy through the evaluation of pet dogs. Nat Rev Cancer. 2020;20(12):727–742. doi: 10.1038/s41568-020-0297-3. - DOI - PubMed
    1. Goldschmidt M, Pena L, Rasotto R, Zappulli V. Classification and grading of canine mammary tumors. Vet Pathol. 2011;48(1):117–131. doi: 10.1177/0300985810393258. - DOI - PubMed
    1. Gray M, Meehan J, Martinez-Perez C, Kay C, Turnbull AK, Morrison LR, et al. Naturally-occurring canine mammary tumors as a translational model for human breast cancer. Front Oncol. 2020;10:617. doi: 10.3389/fonc.2020.00617. - DOI - PMC - PubMed
    1. Zheng HH, Du CT, Yu C, Zhang YZ, Huang RL, Tang XY, et al. Epidemiological investigation of canine mammary tumors in mainland China between 2017 and 2021. Front Vet Sci. 2022;9:843390. doi: 10.3389/fvets.2022.843390. - DOI - PMC - PubMed