

Genome-wide identification and expression analysis of the SPL transcription factor family and its response to abiotic stress in Pisum sativum L
- PMID: 38822248
- PMCID: PMC11140923
- DOI: 10.1186/s12864-024-10262-w
Genome-wide identification and expression analysis of the SPL transcription factor family and its response to abiotic stress in Pisum sativum L
Abstract
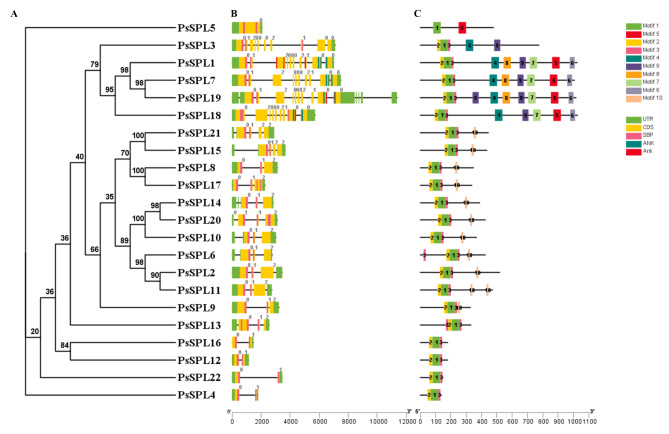
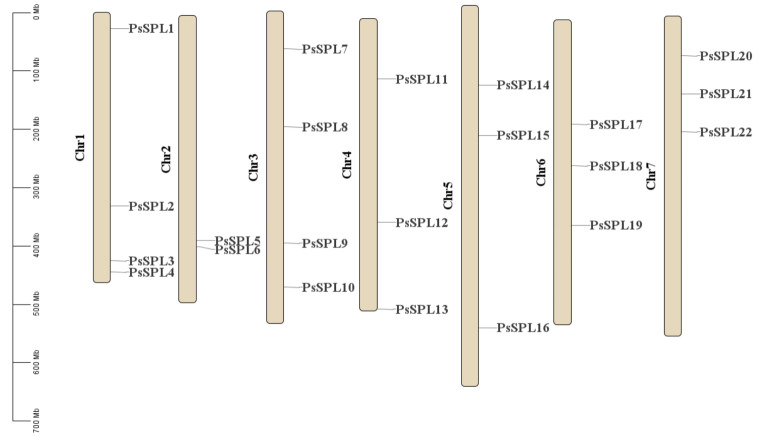
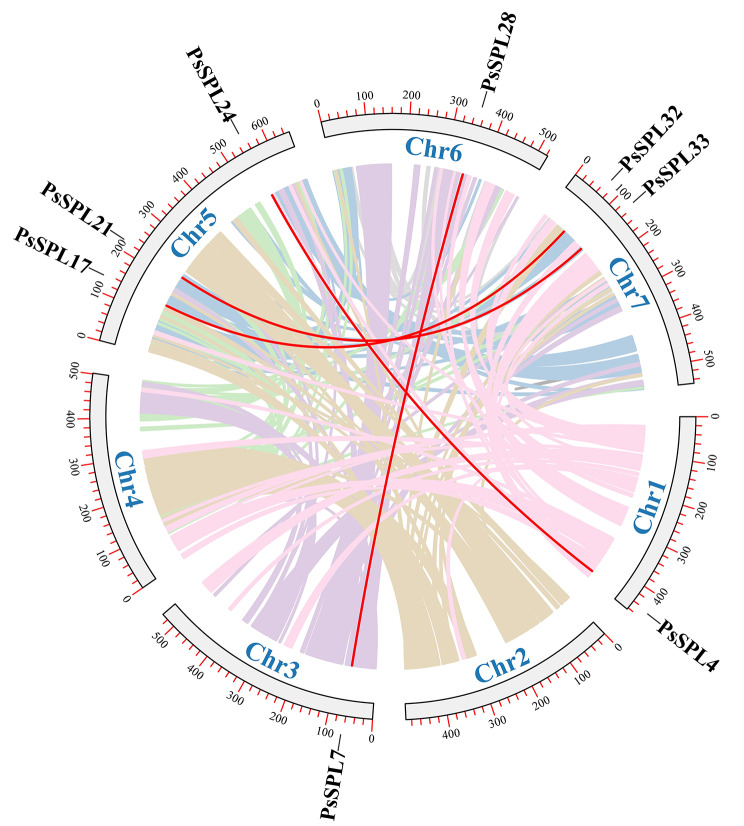
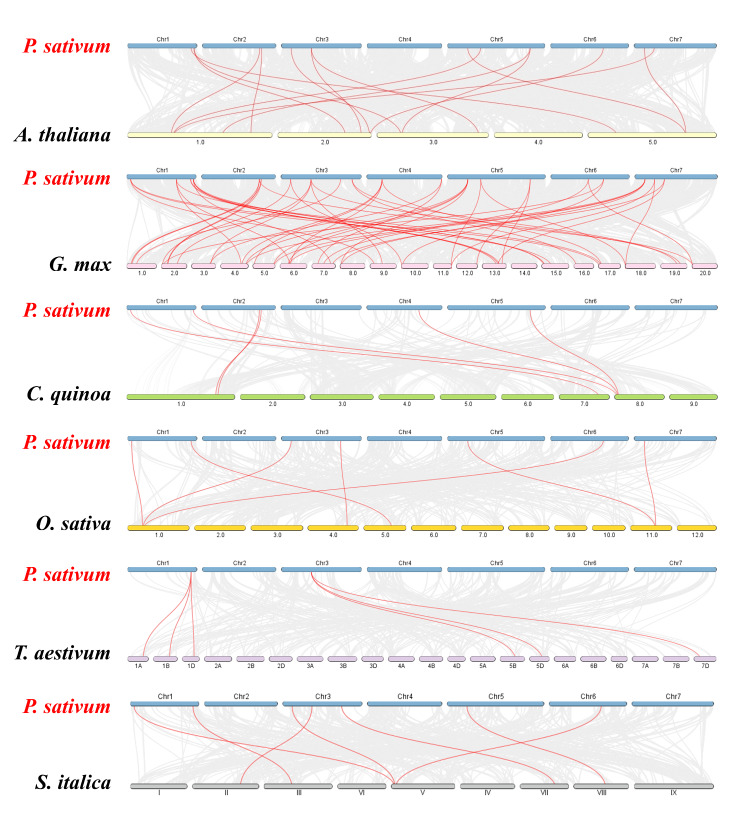
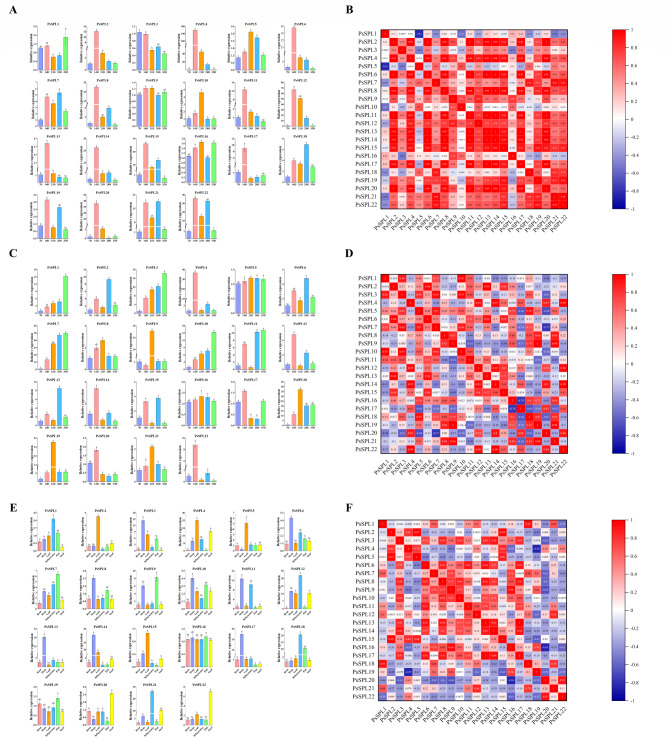
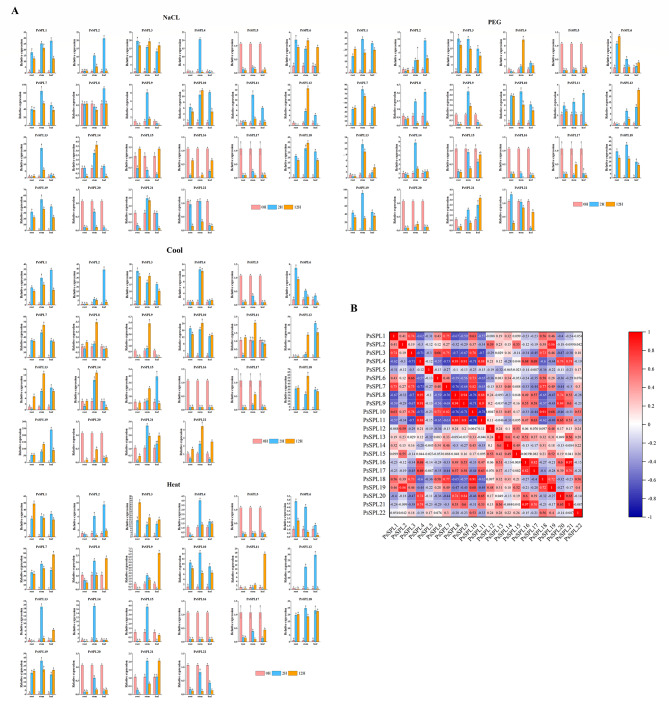
Squamous promoter binding protein-like (SPL) genes encode plant-specific transcription factors (TFs) that play essential roles in modulating plant growth, development, and stress response. Pea (Pisum sativum L.) is a coarse grain crop of great importance in food production, biodiversity conservation and molecular genetic research, providing genetic information and nutritional resources for improving agricultural production and promoting human health. However, only limited researches on the structure and functions of SPL genes exist in pea (PsSPLs). In this study, we identified 22 PsSPLs and conducted a genome-wide analysis of their physical characteristics, chromosome distribution, gene structure, phylogenetic evolution and gene expression patterns. As a result, the PsSPLs were unevenly distributed on the seven chromosomes of pea and harbored the SBP domain, which is composed of approximately 76 amino acid residues. The phylogenetic analysis revealed that the PsSPLs clustered into eight subfamilies and showed high homology with SPL genes in soybean. Further analysis showed the presence of segmental duplications in the PsSPLs. The expression patterns of 22 PsSPLs at different tissues, developmental stages and under various stimulus conditions were evaluated by qRT-PCR method. It was found that the expression patterns of PsSPLs from the same subfamily were similar in different tissues, the transcripts of most PsSPLs reached the maximum peak value at 14 days after anthesis in the pod. Abiotic stresses can cause significantly up-regulated PsSPL19 expression with spatiotemporal specificity, in addition, four plant hormones can cause the up-regulated expression of most PsSPLs including PsSPL19 in a time-dependent manner. Therefore, PsSPL19 could be a key candidate gene for signal transduction during pea growth and development, pod formation, abiotic stress and plant hormone response. Our findings should provide insights for the elucidating of development regulation mechanism and breeding for resistance to abiotic stress pea.
Keywords: Pisum sativum. L; PsSPL19; SPL genes; Abiotic stress; Genome-wide analysis; Growth and development; Plant hormone response.
© 2024. The Author(s).
Conflict of interest statement
The authors declare that there are no competing interests.
Figures


Similar articles
-
Genome-wide identification, structural characterization and gene expression analysis of the WRKY transcription factor family in pea (Pisum sativum L.).BMC Plant Biol. 2024 Feb 16;24(1):113. doi: 10.1186/s12870-024-04774-6. BMC Plant Biol. 2024. PMID: 38365619 Free PMC article.
-
Genome-wide identification and expression analysis of the SPL gene family and its response to abiotic stress in barley (Hordeum vulgare L.).BMC Genomics. 2024 Sep 9;25(1):846. doi: 10.1186/s12864-024-10773-6. BMC Genomics. 2024. PMID: 39251952 Free PMC article.
-
Genome-wide identification, expression analysis, and functional study of the bZIP transcription factor family and its response to hormone treatments in pea (Pisum sativum L.).BMC Genomics. 2023 Nov 22;24(1):705. doi: 10.1186/s12864-023-09793-5. BMC Genomics. 2023. PMID: 37993794 Free PMC article.
-
Genome-wide identification and expression analysis of the Dof gene family reveals their involvement in hormone response and abiotic stresses in sunflower (Helianthus annuus L.).Gene. 2024 Jun 5;910:148336. doi: 10.1016/j.gene.2024.148336. Epub 2024 Mar 4. Gene. 2024. PMID: 38447680 Review.
-
Pea Breeding for Resistance to Rhizospheric Pathogens.Plants (Basel). 2022 Oct 10;11(19):2664. doi: 10.3390/plants11192664. Plants (Basel). 2022. PMID: 36235530 Free PMC article. Review.
Cited by
-
Functional Genomics: From Soybean to Legume.Int J Mol Sci. 2025 Jun 30;26(13):6323. doi: 10.3390/ijms26136323. Int J Mol Sci. 2025. PMID: 40650105 Free PMC article. Review.
-
Identification and Characterization of SQUAMOSA Promoter Binding Protein-like Transcription Factor Family Members in Zanthoxylum bungeanum and Their Expression Profiles in Response to Abiotic Stresses.Plants (Basel). 2025 Feb 8;14(4):520. doi: 10.3390/plants14040520. Plants (Basel). 2025. PMID: 40006777 Free PMC article.
References
-
- Pandey AK, Rubiales D, Wang Y, Fang P, Sun T, Liu N, Xu P. Omics resources and omics-enabled approaches for achieving high productivity and improved quality in pea (Pisum sativum L.). TAG theoretical and applied genetics Theoretische Und Angewandte Genetik 2021, 134(3):755–76. - PubMed
-
- Jarambasa T, Regon P, Jyoti SY, Gupta D, Panda SK, Tanti B. Genome-wide identification and expression analysis of the Pisum sativum (L.) APETALA2/ethylene-responsive factor (AP2/ERF) gene family reveals functions in drought and cold stresses. Genetica. 2023;151(3):225–39. doi: 10.1007/s10709-023-00190-0. - DOI - PubMed
-
- Singh T, Raturi H, Uniyal SP. Effect of Biofertilizer and Mulch on Growth, Yield, Quality and Economics of pea (Pisum sativum L). Indian J Agricultural Res 2021.
MeSH terms
Substances
LinkOut - more resources
Full Text Sources
Research Materials
