. 2024 May 31;29(1):82.
doi: 10.1186/s11658-024-00596-4.

Lipotoxic hepatocyte derived LIMA1 enriched small extracellular vesicles promote hepatic stellate cells activation via inhibiting mitophagy

Affiliations

Lipotoxic hepatocyte derived LIMA1 enriched small extracellular vesicles promote hepatic stellate cells activation via inhibiting mitophagy

Shihui Li et al. Cell Mol Biol Lett. .

Abstract

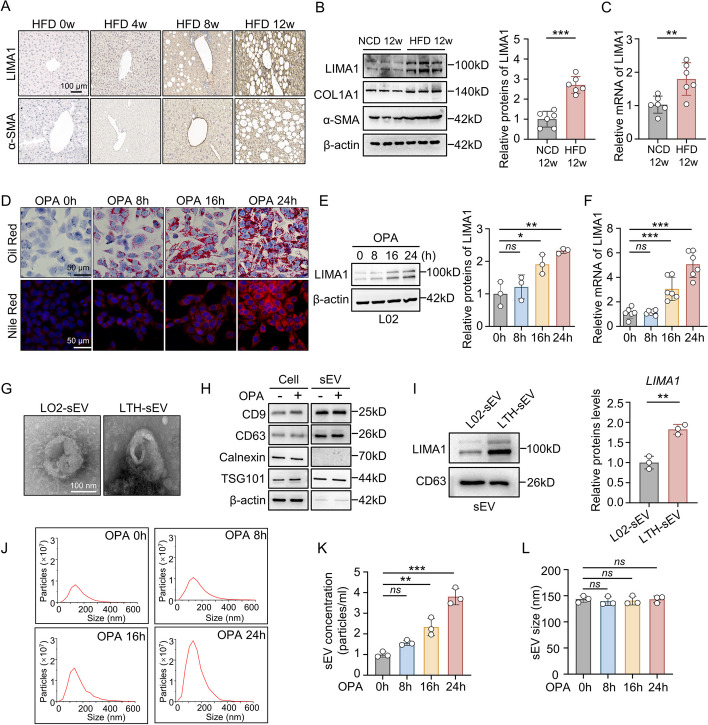
Background: Hepatic stellate cells (HSCs) play a crucial role in the development of fibrosis in non-alcoholic fatty liver disease (NAFLD). Small extracellular vesicles (sEV) act as mediators for intercellular information transfer, delivering various fibrotic factors that impact the function of HSCs in liver fibrosis. In this study, we investigated the role of lipotoxic hepatocyte derived sEV (LTH-sEV) in HSCs activation and its intrinsic mechanisms.

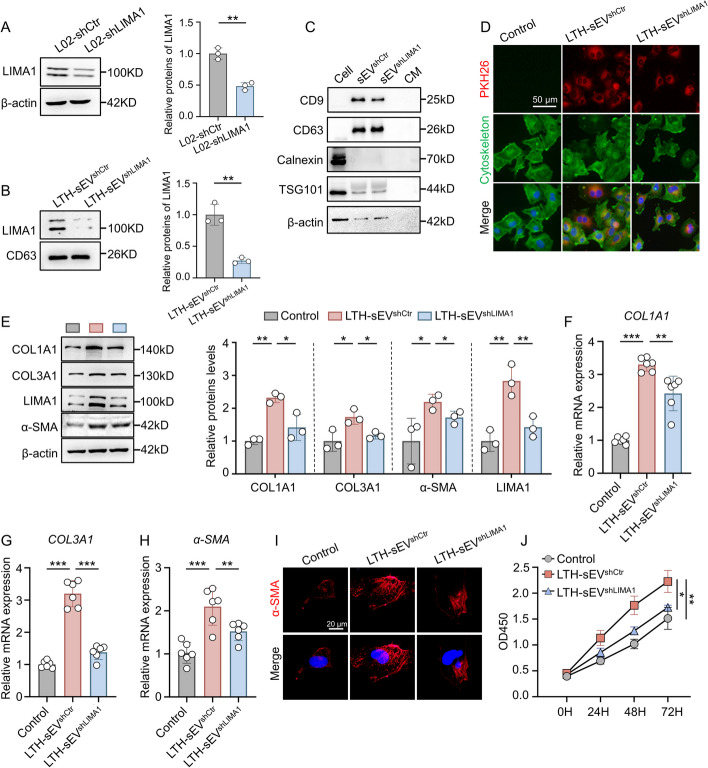
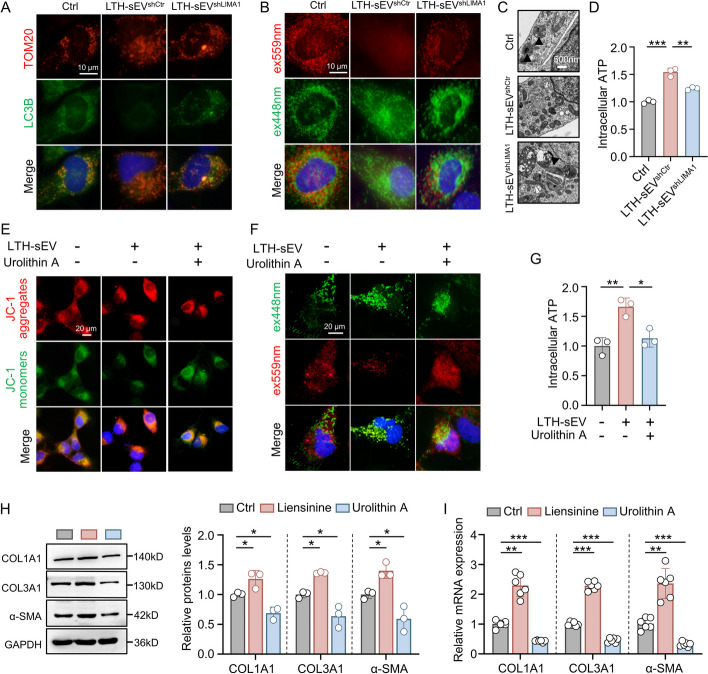
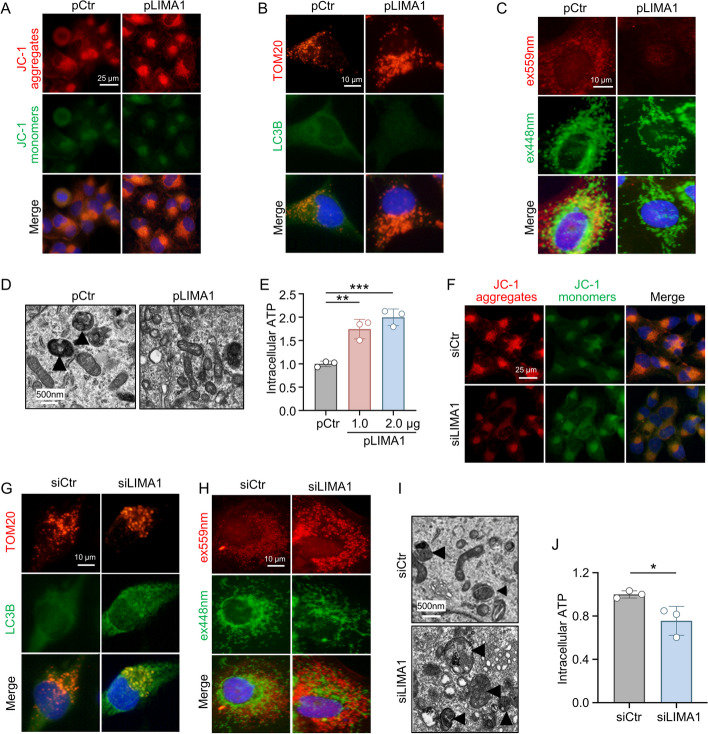
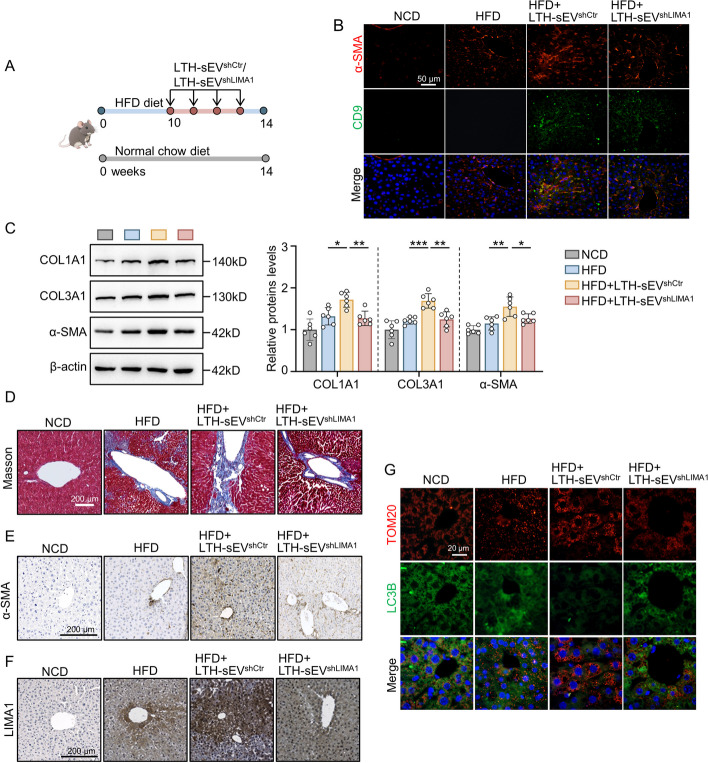
Methods: High-fat diet (HFD) mice model was constructed to confirm the expression of LIMA1. The relationship between LIMA1-enriched LTH-sEV and LX2 activation was evaluated by measurement of fibrotic markers and related genes. Levels of mitophagy were detected using mt-keima lentivirus. The interaction between LIMA1 and PINK1 was discovered through database prediction and molecular docking. Finally, sEV was injected to investigate whether LIMA1 can accelerate HFD induced liver fibrosis in mice.

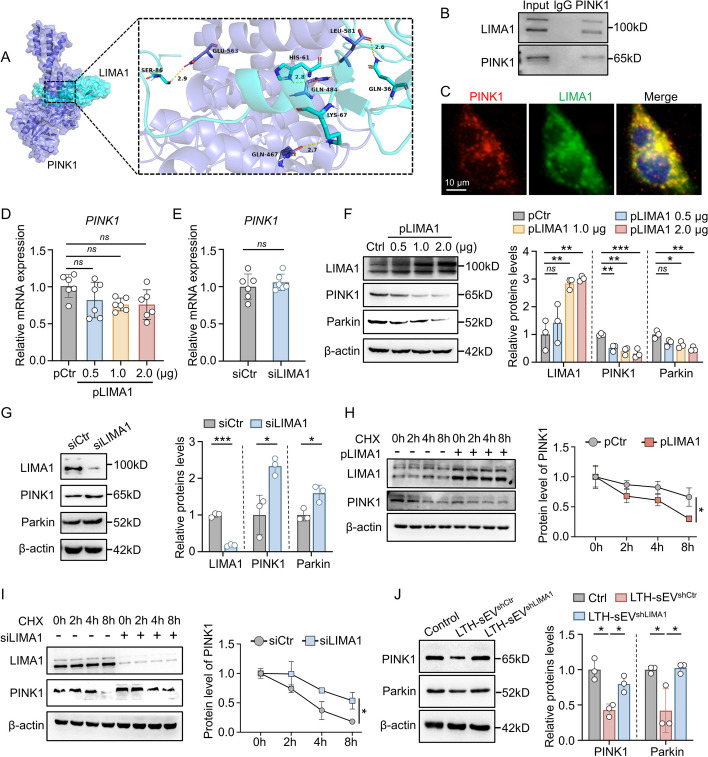
Results: LIMA1 expression was upregulated in lipotoxic hepatocytes and was found to be positively associated with the expression of the HSCs activation marker α-SMA. Lipotoxicity induced by OPA led to an increase in both the level of LIMA1 protein in LTH-sEV and the release of LTH-sEV. When HSCs were treated with LTH-sEV, LIMA1 was observed to hinder LX2 mitophagy while facilitating LX2 activation. Further investigation revealed that LIMA1 derived from LTH-sEV may inhibit PINK1-Parkin-mediated mitophagy, consequently promoting HSCs activation. Knocking down LIMA1 significantly attenuates the inhibitory effects of LTH-sEV on mitophagy and the promotion of HSCs activation.

Conclusions: Lipotoxic hepatocyte-derived LIMA1-enriched sEVs play a crucial role in promoting HSCs activation in NAFLD-related liver fibrosis by negatively regulating PINK1 mediated mitophagy. These findings provide new insights into the pathological mechanisms involved in the development of fibrosis in NAFLD.

Keywords: Hepatic stellate cells; LIMA1; Mitophagy; Nonalcoholic fatty liver disease; Small extracellular vesicles.


Conflict of interest statement

The authors declare that they have no competing or financial interest.

Figures

Fig. 1
Fig. 1
LIMA1 is upregulated in lipotoxic hepatocyte and lipotoxic hepatocyte-derived sEV. A Immunohistochemistry of LIMA1 and α-SMA in livers from HFD mice at 0, 4, 8, and 12 weeks. Scale bar = 100 μm, (n = 6 mice per group). B Western blot of LIMA1, α-SMA and COL1A1 in livers from HFD mice, (n = 6 mice per group). C qRT-PCR of LIMA1 mRNA in livers from NCD and HFD mice at 12 weeks, (n = 6 mice per group). D Oil Red O and Nile Red staining of intracellular lipid droplets in OPA treated L02 cells at 0, 8, 16, and 24 h. Scale bar = 50 μm. E Western blot of LIMA1 in OPA treated cells. F qRT-PCR of LIMA1 mRNA expression in OPA treated L02 cells. G TEM of sEV isolated from normal L02 cells (L02-sEV) and OPA-treated L02 cells (LTH-sEV). Scale bar = 100 nm. H Western blot of sEV markers CD9, CD63, TSG101 and endoplasmic reticulum marker Calnexin in LTH-sEV. I Western blot of LIMA1 and CD63 in LTH-sEV and L02-sEV. J The size and concentration of LTH-sEV were determined by nanoparticle tracking analysis. K The concentration of LTH-sEV after OPA treatment of L02 for different times. L Size distribution of LTH-sEV after OPA treatment of L02 for different times. All data were expressed as the means ± SD of at least 3 independent experiments, ns: no significance; *P < 0.05; **P < 0.01; ***P < 0.001
Fig. 2
Fig. 2
LTH-sEV induce LX2 activation and LIMA1 expression. A Schematic diagram of the sEV stimulation experiment in vitro. B Immunofluorescence staining of α-SMA (green) and LIMA1 (red) in LX2 after accepting LTH-sEV. Scale bar = 20 μm. C-F qRT-PCR of LIMA1, COL1A1, COL3A1 and α-SMA mRNA in LX2 treated with LTH-sEV. G Western blot of LIMA1, COL1A1, COL3A1 and α-SMA in LX2 treated with LTH-sEV. H LX2 treated with LTH-sEV was detected by CCK-8 assay as indicated. I-L qRT-PCR of LIMA1, COL1A1, COL3A1 and α-SMA mRNA expression in LX2 treated with L02-sEV. M Western blot of LIMA1, COL1A1, COL3A1 and α-SMA expression in LX2 treated with L02-sEV. N LX2 treated with L02-sEV was detected by CCK-8 assay as indicated. All data were expressed as the means ± SD of at least 3 independent experiments, ns: no significance; *P < 0.05; **P < 0.001
Fig. 3
Fig. 3
LTH-sEV activates LX2 by transferring LIMA1 to LX2. A Western blot of LIMA1 in L02-shCtr and L02-shLIMA1. B Western blot of LIMA1 in LTH-sEVshCtr and LTH-sEVshLIMA1. C Western blot of sEV markers CD9, CD63, TSG101 and endoplasmic reticulum marker Calnexin in LTH-sEVshCtr and LTH-sEVshLIMA1. D Internalization of LTH-sEVshCtr and LTH-sEVshLIMA1 labeled with PKH26 into LX2. Scale bar = 50 μm. E Western blot of COL1A1, COL3A1, α-SMA and LIMA1 in LX2 treated with LTH-sEVshCtr or LTH-sEVshLIMA1. F–H qRT-PCR of COL1A1, COL3A1 and α-SMA mRNA in LX2 treated with LTH-sEVshCtr or LTH-sEVshLIMA1. I Immunofluorescence staining of α-SMA (red) in LX2 after accepting LTH-sEVshCtr or LTH-sEVshLIMA1. Scale bar = 20 μm. J Cell proliferation of LX2 treated with LTH-sEVshCtr or LTH-sEVshLIMA1 were determined by CCK-8 assays. All data were expressed as the means ± SD of at least 3 independent experiments, * P < 0.05; **P < 0.01; ***P < 0.001
Fig. 4
Fig. 4
LIMA1 overexpression and knockdown promote or inhibit HSCs activation. A Western blot of COL1A1, COL3A1, α-SMA and LIMA1 in LIMA1-overexpressing plasmid-transfected LX2. BE qRT-PCR of LIMA1, COL1A1, COL3A1 and α-SMA mRNA in LIMA1-overexpressing plasmid-transfected LX2. F Cell viability detection of LX2 overexpressing LIMA1 were determined by CCK-8 assays. G Western blot of COL1A1, COL3A1, α-SMA and LIMA1 in LIMA1-knockdown LX2. HK qRT-PCR of LIMA1, COL1A1, COL3A1 and α-SMA mRNA in LIMA1-knockdown LX2. L Cell viability detection of LIMA1-knockdown LX2 were determined by CCK-8 assays. All data were expressed as the means ± SD of at least 3 independent experiments, *P < 0.05; **P < 0.01; ***P < 0.001
Fig. 5
Fig. 5
LTH-sEV derived LIMA1 inhibits mitophagy in LX2. A Immunofluorescence staining showing LC3B (green) and TOM20 (red) in LX2 treated with LTH-sEVshCtr or LTH-sEVshLIMA1. Scale bar = 10 μm. B LTH-sEVshCtr or LTH-sEVshLIMA1 treated LX2 were transfected with mitochondrially targeted mKeima and excitation at 550 nm (red) and 438 nm (green) by microscopy. Scale bar = 10 µm. C Autophagic microstructures in LX2 mitochondria were examined by transmission electron microscopy. Scale bars, 500 nm. Black arrowheads, mitophagy. D ATP content in LX2 treated with LTH-sEVshCtr or LTH-sEVshLIMA1 were measured. E The mitochondrial membrane potential of LX2 was determined by JC-1 staining. Scale bar = 20 μm. F Different treated LX2 were transfected with mitochondrially targeted mKeima and excitation at 550 nm (red) and 438 nm (green) by microscopy. Scale bar = 20 µm. G ATP levels of LX2 were determined using an ATP determination kit. H Western blot of COL1A1, COL3A1 and α-SMA in LX2 treated with Liensinine or Urolithin A. I qRT-PCR of COL1A1, COL3A1 and α-SMA mRNA in LX2 treated with Liensinine or Urolithin A. All data were expressed as the means ± SD of at least 3 independent experiments, *P < 0.05; **P < 0.01; ***P < 0.001; ****P < 0.0001
Fig. 6
Fig. 6
LIMA1 overexpression and knockdown promote or inhibit HSCs mitophagy. A Mitochondrial membrane potential of LX2 overexpressing LIMA1 was measured by JC-1 staining. Scale bar = 25 μm. B Immunofluorescence staining shows LC3B (green) and TOM20 (red) fluorescence of LX2 overexpressing LIMA1. Scale bar = 10 μm. C LX2 overexpressing LIMA1 was transfected with mitochondria-targeted mKeima and microscopically excited at 550 nm (red) and 438 nm (green). Scale bar = 10 µm. D Autophagic microstructures in LX2 overexpressing LIMA1 mitochondria were examined by transmission electron microscopy. Scale bars = 500 nm. Black arrowheads, mitophagy. E ATP levels of LX2 overexpressing LIMA1 were determined using an ATP determination kit. F The mitochondrial membrane potential of LIMA1-knockdown LX2 was determined by JC-1 staining. Scale bar = 25 μm. G Autophagic microstructures in LIMA1-knockdown LX2 mitochondria were examined by transmission electron microscopy. Scale bars = 500 nm. H Immunofluorescence staining showing LC3B (green) and TOM20 (red) in LIMA1-knockdown LX2. Scale bar = 10 μm. I LIMA1-knockdown LX2 were transfected with mitochondrially targeted mKeima and excitation at 550 nm (red) and 438 nm (green) by microscopy. Scale bar = 10 µm. J ATP levels of LIMA1-knockdown LX2 were determined using an ATP determination kit. All data were expressed as the means ± SD of at least 3 independent experiments, *P < 0.05; **P < 0.01; ***P < 0.001
Fig. 7
Fig. 7
LIMA1 regulates mitochondrial autophagy and reduces its stability by interacting with PINK1. A Graphical representation of three-dimensional structures of the interaction model of LIMA1 with PINK1. B Co-IP analysis of the endogenous interaction of LIMA1 and PINK1 in LX2. C The co-localization between LIMA1 (green) with PINK1 (red) was analyzed by confocal microscopy in LX2. Scale bar = 10 μm. D qRT-PCR of PINK1 mRNA in LX2 with LIMA1 overexpression. Expression of PINK1 mRNA was quantified relative to β-actin. E qRT-PCR of PINK1 mRNA in LX2 with LIMA1 knockdown. F Western blot of PINK1 and Parkin in LIMA1-overexpressing plasmid-transfected LX2. G Western blot of PINK1 and Parkin in LIMA1-knockdown LX2. H LX2 overexpressing LIMA1 were treated with CHX to inhibit protein synthesis, and PINK1 protein turnover was analyzed over time. I Similarly, LX2 with knockdown of LIMA1 were also treated with CHX and to measure PINK1 protein levels. J Western blot of PINK1 and Parkin in LTH-sEVshCtr or LTH-sEVshLIMA1 treated LX2. All data were expressed as the means ± SD of at least 3 independent experiments, ns: no significance; *P < 0.05; **P < 0.01; ***P < 0.001
Fig. 8
Fig. 8
LTH-sEV derived LIMA1 transplantation worsens hepatic fibrosis in NAFLD mice. A C57BL/6 mice were placed normal chow diet or on high-fat diet and injected with LTH-sEVshCtr or LTH-sEVshLIMA1 from the 10th week to the 14th week of HFD feeding. B Immunofluorescence staining of sEV marker CD9 (Red) and HSCs activation marker α-SMA (Green) in LTH-sEVshCtr or LTH-sEVshLIMA1 treated mice livers. Scale bars = 50 μm, (n = 6 mice per group). C Western blot of COL1A1, COL3A1 and α-SMA in NCD group, HFD group, HFD + LTH-sEVshCtr group and HFD + LTH-sEVshLIMA1 group (n = 6 mice per group). D Representative images of Masson staining in mice liver sections. Scale bars = 200 μm, (n = 6 mice per group). E Representative images of α-SMA immunohistochemical staining in mice liver sections. Scale bars = 200 μm, (n = 6 mice per group). F Representative images of LIMA1 immunohistochemical staining in mice liver sections. Scale bars = 200 μm, (n = 6 mice per group). G TOM20 (red IF) and LC3B (green IF) proteins were detected via IF staining. Scale bar = 20 μm, (n = 6 mice per group). All data were expressed as the means ± SD of at least 3 independent experiments, *P < 0.05; **P < 0.01

Similar articles

Cited by

References

    1. Younossi ZM, Golabi P, Paik J, Henry A, Dongen CV, Henry L. The global epidemiology of nonalcoholic fatty liver disease (NAFLD) and nonalcoholic steatohepatitis (NASH): a systematic review. Hepatology. 2023;77(4):1335–1347. doi: 10.1097/HEP.0000000000000004. - DOI - PMC - PubMed
    1. Dulai PS, Singh S, Patel J, Soni M, Prokop LJ, Younossi Z, et al. Increased risk of mortality by fibrosis stage in nonalcoholic fatty liver disease: systematic review and meta-analysis. Hepatology. 2017;65(5):1557–1565. doi: 10.1002/hep.29085. - DOI - PMC - PubMed
    1. Paternostro R, Trauner M. Current treatment of non-alcoholic fatty liver disease. J Intern Med. 2022;292(2):190–204. doi: 10.1111/joim.13531. - DOI - PMC - PubMed
    1. Dorairaj V, Sulaiman SA, Abu N, Murad NAA. Extracellular vesicles in the development of the non-alcoholic fatty liver disease: an update. Biomolecules. 2020;10(11):1494. doi: 10.3390/biom10111494. - DOI - PMC - PubMed
    1. Nakao Y, Fukushima M, Mauer AS, Liao CY, Ferris A, Dasgupta D, et al. A comparative proteomic analysis of extracellular vesicles associated with lipotoxicity. Front Cell Dev Biol. 2021;9:735001. doi: 10.3389/fcell.2021.735001. - DOI - PMC - PubMed

MeSH terms

Substances