. 2024 May 31;20(1):80.
doi: 10.1186/s13007-024-01213-3.

ScAnalyzer: an image processing tool to monitor plant disease symptoms and pathogen spread in Arabidopsis thaliana leaves

Affiliations

ScAnalyzer: an image processing tool to monitor plant disease symptoms and pathogen spread in Arabidopsis thaliana leaves

Misha Paauw et al. Plant Methods. .

Abstract

Background: Plants are known to be infected by a wide range of pathogenic microbes. To study plant diseases caused by microbes, it is imperative to be able to monitor disease symptoms and microbial colonization in a quantitative and objective manner. In contrast to more traditional measures that use manual assignments of disease categories, image processing provides a more accurate and objective quantification of plant disease symptoms. Besides monitoring disease symptoms, computational image processing provides additional information on the spatial localization of pathogenic microbes in different plant tissues.

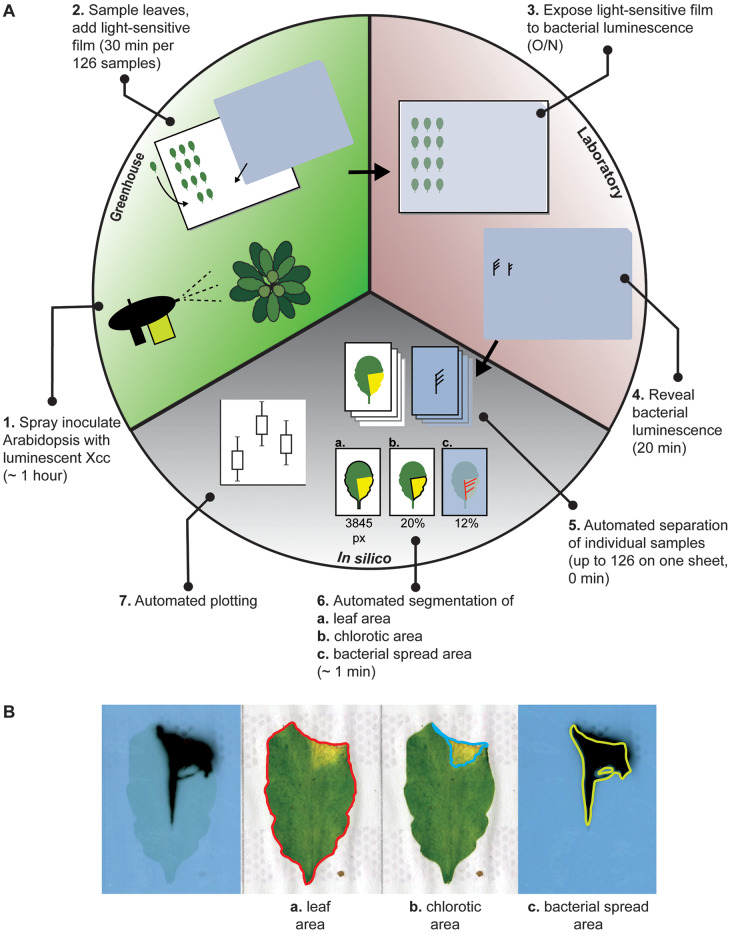
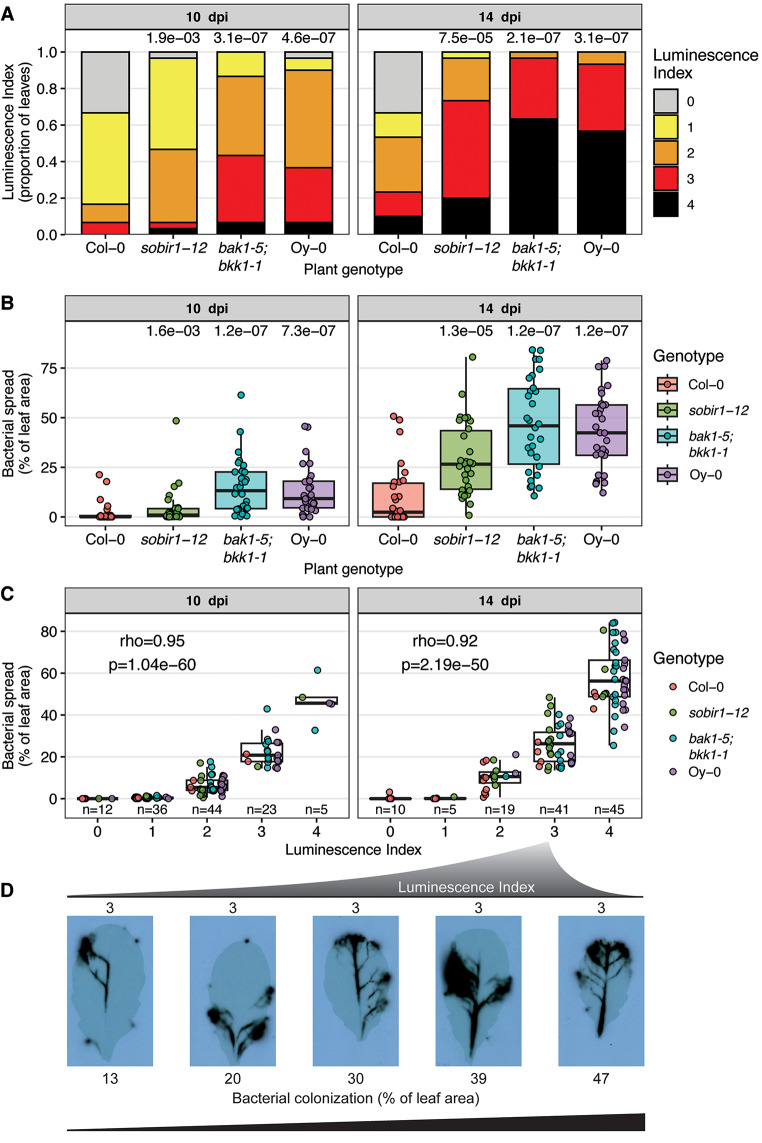
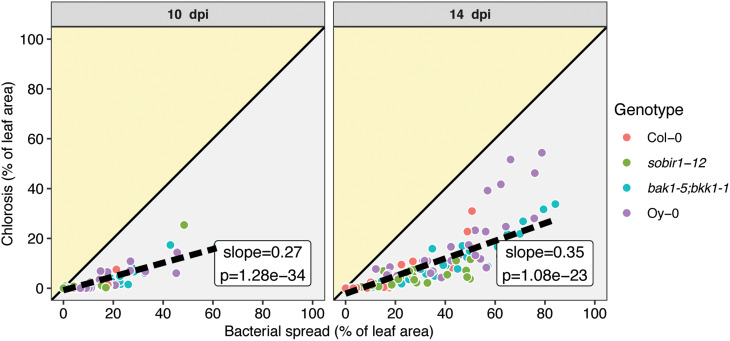
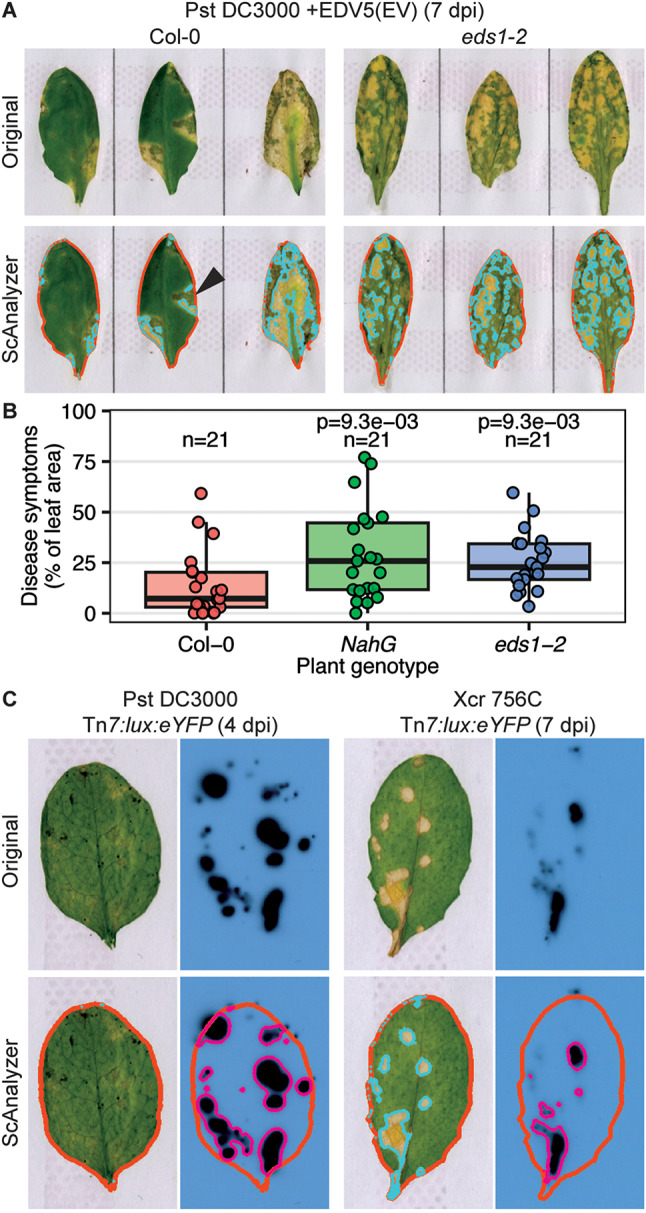
Results: Here we report on an image analysis tool called ScAnalyzer to monitor disease symptoms and bacterial spread in Arabidopsis thaliana leaves. Thereto, detached leaves are assembled in a grid and scanned, which enables automated separation of individual samples. A pixel color threshold is used to segment healthy (green) from chlorotic (yellow) leaf areas. The spread of luminescence-tagged bacteria is monitored via light-sensitive films, which are processed in a similar manner as the leaf scans. We show that this tool is able to capture previously identified differences in susceptibility of the model plant A. thaliana to the bacterial pathogen Xanthomonas campestris pv. campestris. Moreover, we show that the ScAnalyzer pipeline provides a more detailed assessment of bacterial spread within plant leaves than previously used methods. Finally, by combining the disease symptom values with bacterial spread values from the same leaves, we show that bacterial spread precedes visual disease symptoms.

Conclusion: Taken together, we present an automated script to monitor plant disease symptoms and microbial spread in A. thaliana leaves. The freely available software ( https://github.com/MolPlantPathology/ScAnalyzer ) has the potential to standardize the analysis of disease assays between different groups.

Keywords: Arabidopsis thaliana; Xanthomonas campestris; Bioluminescence; Black rot disease; Digital phenotyping; Image processing; Plant disease.


Conflict of interest statement

HvdB is employed by Keygene N.V., Wageningen, The Netherlands. Keygene was not involved in any part of this study.

Figures

Fig. 1
Fig. 1
ScAnalyzer: an image analysis pipeline to quantify both chlorosis as proxy for disease symptom severity and bacterial spread. (A). Overview of the experimental workflow. Steps are separated by location: greenhouse (green, steps 1 and 2), laboratory (red, steps 3 and 4), and in silico (grey, steps 5–7). The greenhouse and laboratory parts are similar to van Hulten et al., (2019) with minor modifications (Table S1). The in silico part includes ScAnalyzer and represents a major adaptation of the protocol of van Hulten et al. (2019). (B) Example of an infected leaf analyzed with ScAnalyzer pipeline: automated overlay of leaf and detected bacterial luminescence. Based on the thresholds that segment the images, ScAnalyzer extracts the (a) total leaf surface area, while excluding contaminating objects such as soil particles, (b) chlorotic leaf area, and (c) the bacterial spread area, within the leaf boundaries. This example is from a clip-inoculated leaf. The grey dots on the paper are the result of glue roller used to attach the individual leaves on paper
Fig. 2
Fig. 2
Benchmarking ScAnalyzer against the previous method for assessing disease severity. (A) Luminescence index distribution of Xcc ΔxopAC Tn7:lux: mTq2 colonization in Arabidopsis lines. Data from two independent experiments were combined, resulting in a total sample size of n = 30 leaves for each treatment. The multiple-testing corrected p-value of pairwise Wilcoxon tests between the mutants and control group Col-0 are reported above the bars. (B) Quantification of the bacterial spread using the ScAnalyzer script, of the same leaves displayed in (A). (C) Correlation between the luminescence index scores and proportion of colonized leaf detected by ScAnalyzer. The number of samples (n) in each luminescence index is indicated above the x-axis. Spearman’s Rho and p-value of the correlation between luminescence index and bacterial colonization is shown in the panel. (D) Xcc-infected Arabidopsis leaves with luminescence index 3 (indicated above pictures) and bacterial spread ranging from 13–47% of the leaf area (indicated below pictures) reveals subtle differences in bacterial colonization of leaves within luminescence index 3
Fig. 3
Fig. 3
Bacterial spread precedes leaf chlorosis. Correlation between bacterial spread values and chlorotic leaf area reveals that all tested leaves show a higher bacterial spread than chlorotic leaf area, in % of total leaf area. Shaded areas indicate whether the chlorotic area is greater than the area colonized by bacteria (yellow highlight) or vice versa (grey area). The solid black line follows y = x, or, bacterial spread = chlorosis. The dashed black line follows the regression line of the samples, and the inset shows the slope and p value of this line
Fig. 4
Fig. 4
ScAnalyzer captures disease symptoms and bacterial luminescence caused by stomatal pathogens. (A) Representative images of Arabidopsis leaves of accession Col-0 and eds1-2 mutant in Col-0 background infected by Pst DC3000 (carrying empty vector EDV5) at 7 dpi. Top row shows original samples, bottom row shows ScAnalyzer results. Red border: total leaf area. Light-blue border: chlorotic leaf area. Arrow highlights a dark green lesion not detected by ScAnalyzer. (B) Quantification of the symptomatic leaf area of leaves of three Arabidopsis lines infected by Pst DC3000 (carrying empty vector EDV5) at 7 dpi. (C) Examples of Arabidopsis accession Oy-0 leaves infected with luminescent reporter strains of Pst and Xcr. Top row shows original samples, bottom row shows the ScAnalyzer results. Red border: total leaf area. Light-blue border: chlorotic and necrotic leaf area

References

    1. Bock C, Poole G, Parker P, Gottwald T. Plant disease severity estimated visually, by digital photography and image analysis, and by hyperspectral imaging. Crit Rev Plant Sci. 2010;29(2):59–107. doi: 10.1080/07352681003617285. - DOI
    1. Lindow S. Estimating disease severity of single plants. Phytopathology. 1983;73(11):1576–81. doi: 10.1094/Phyto-73-1576. - DOI
    1. Karisto P, Hund A, Yu K, Anderegg J, Walter A, Mascher F, et al. Ranking quantitative resistance to Septoria Tritici blotch in elite wheat cultivars using automated image analysis. Phytopathology. 2018;108(5):568–81. doi: 10.1094/PHYTO-04-17-0163-R. - DOI - PubMed
    1. Pavicic M, Overmyer K, Rehman AU, Jones P, Jacobson D, Himanen K. Image-based methods to score fungal pathogen symptom progression and severity in excised Arabidopsis leaves. Plants. 2021;10(1):158. doi: 10.3390/plants10010158. - DOI - PMC - PubMed
    1. McDonald SC, Buck J, Li Z. Automated, image-based disease measurement for phenotyping resistance to soybean frogeye leaf spot. Plant Methods. 2022;18(1):103. doi: 10.1186/s13007-022-00934-7. - DOI - PMC - PubMed

LinkOut - more resources