. 2024 May 31;13(1):58.
doi: 10.1186/s40164-024-00521-7.

Multi-model analysis of gallbladder cancer reveals the role of OxLDL-absorbing neutrophils in promoting liver invasion

Affiliations

Multi-model analysis of gallbladder cancer reveals the role of OxLDL-absorbing neutrophils in promoting liver invasion

Dongning Rao et al. Exp Hematol Oncol. .

Abstract

Background: Gallbladder cancer (GBC) is the most common and lethal malignancy of the biliary tract that lacks effective therapy. In many GBC cases, infiltration into adjacent organs or distant metastasis happened long before the diagnosis, especially the direct liver invasion, which is the most common and unfavorable way of spreading.

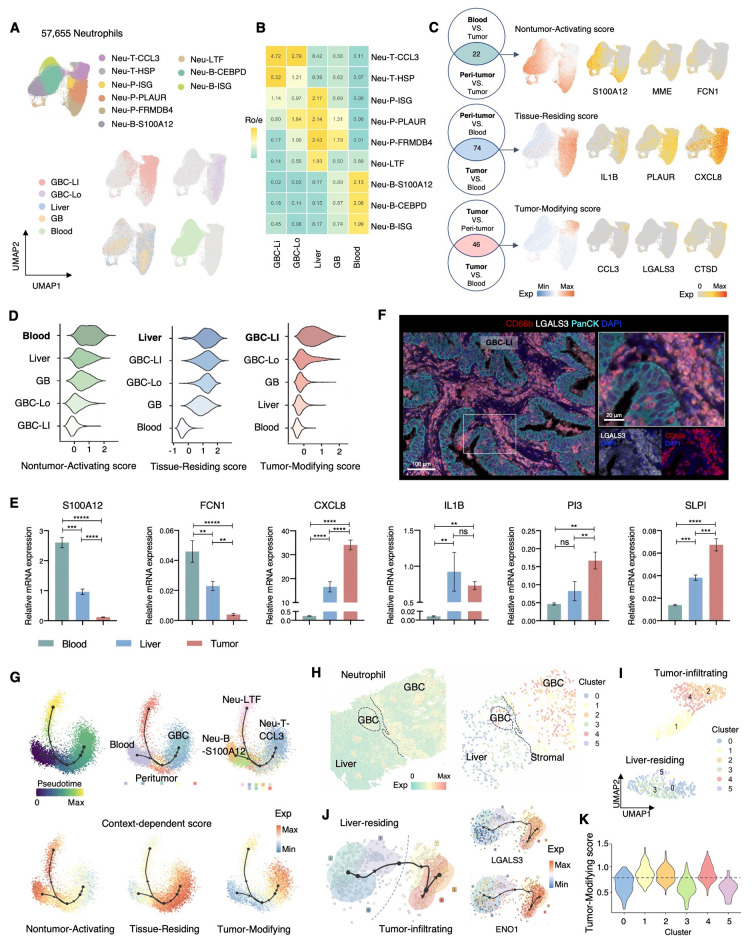
Methods: Single-cell RNA sequencing (scRNA-seq), spatial transcriptomics (ST), proteomics, and multiplexed immunohistochemistry (mIHC) were performed on GBC across multiple tumor stages to characterize the tumor microenvironment (TME), focusing specifically on the preferential enrichment of neutrophils in GBC liver invasion (GBC-LI).

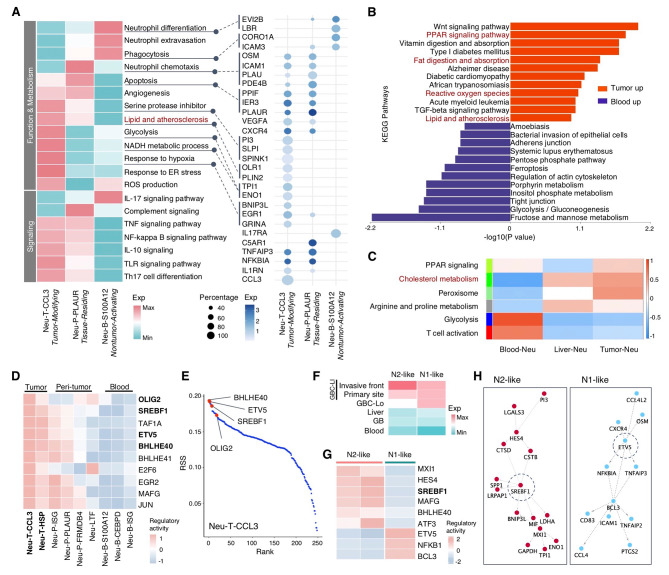
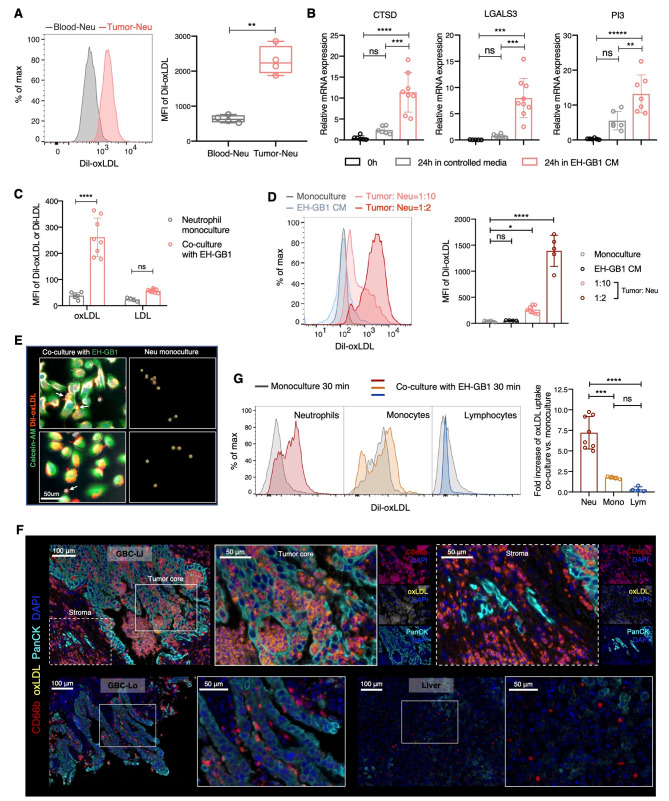
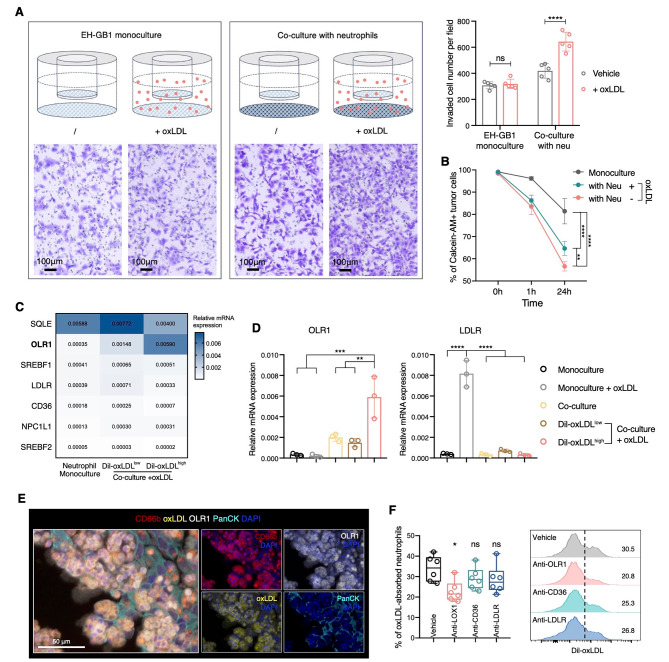
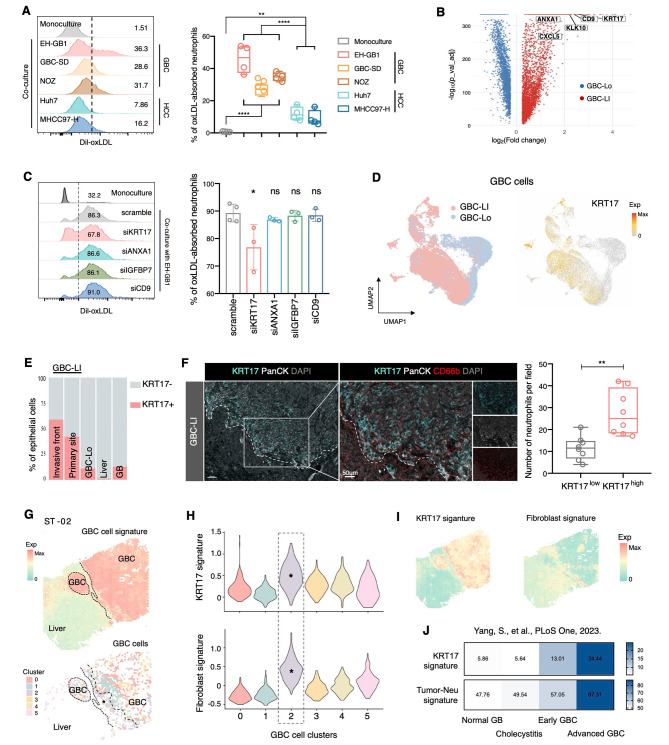
Results: Multi-model Analysis reveals the immunosuppressive TME of GBC-LI that was characterized by the enrichment of neutrophils at the invasive front. We identified the context-dependent transcriptional states of neutrophils, with the Tumor-Modifying state being associated with oxidized low-density lipoprotein (oxLDL) metabolism. In vitro assays showed that the direct cell-cell contact between GBC cells and neutrophils led to the drastic increase in oxLDL uptake of neutrophils, which was primarily mediated by the elevated OLR1 on neutrophils. The oxLDL-absorbing neutrophils displayed a higher potential to promote tumor invasion while demonstrating lower cancer cytotoxicity. Finally, we identified a neutrophil-promoting niche at the invasive front of GBC-LI that constituted of KRT17+ GBC cells, neutrophils, and surrounding fibroblasts, which may help cultivate the oxLDL-absorbing neutrophils.

Conclusions: Our study reveals the existence of a subset of pro-tumoral neutrophils with a unique ability to absorb oxLDL via OLR1, a phenomenon induced through cell-cell contact with KRT17+ GBC cells in GBC-LI.

Keywords: Gallbladder cancer; Metastasis; Neutrophils; OLR1; Oxidized low-density lipoprotein; Tumor microenvironment.


Conflict of interest statement

The authors declare no competing interests.

Figures

Fig. 1
Fig. 1
An immunosuppressive environment enriched with neutrophils in GBC liver invasion. (A) Schematic overview of the scRNA analysis workflow. (B) UMAP of immune cells from GBC patients colored by cell types (left) and sample origin (top right), and the expression of representative genes (bottom right). (C) DotPlot represent the expression level and percentage of the top differentially expressed genes in each type of immune cells. (D) The proportion of each immune cell type among different tissues. (E) The proportion of neutrophils in tumor-infiltrated myeloid cells among GBC tumor samples of different T stages according to the tumor, lymph node, metastasis (TNM) staging (The Eighth Edition AJCC Cancer Staging). Statistical analyses were performed using one-way ANOVA with Tukey’s multiple comparisons test. (F) Representative mIHC images and quantification of the CD66b+ neutrophils on the tissue sections of GBC-Lo and GBC-LI. GBC cells were stained with PanCK. The dash line separated the tumor and non-tumor area. Scale bars, 100 μm. CD66b+ neutrophils were counted in different GBC regions at 20x field-of-view. Comparison was performed using two-tailed unpaired t-test. (G) Heatmap showing the top immune subsets enriched in each sample type and their percentage in according to cell types from each sample type. in each sample. (H) Heatmap of functional scores for T lymphocytes (top) and macrophages (bottom) Data are presented as mean with SD. *P < 0.05, **P < 0.01, ***P < 0.001, ****P < 0.0001 See also Figure S1
Fig. 2
Fig. 2
The context-dependent transcriptional states of neutrophils in GBC. (A) UMAP of neutrophils from 15 GBC patients, colored by cluster identity (top) and tissue origin (bottom). (B) Tissue preference of neutrophil clusters was estimated by the ratio of observed to expected cell numbers (Ro/e) [65]. (C) Left, Venn Diagrams showing the number of shared differentially-expressed genes of each sample type for generating the context-dependent scores: Nontumor-Activating, Tissue-Residing, and Tumor-Modifying score; right, UMAP plots showing the expression of overall genes and the representative genes of the context-dependent scores. (D) Violin plots displaying the expression of Nontumor-Activating (left), Tissue-Residing (middle), and Tumor-Modifying (right) scores among sample types, ordered by the descending level of expression. (E) Relative mRNA expression of representative genes in neutrophils isolated from the blood, peritumoral liver, and tumor samples of GBC-LI patients as measured by qRT-PCR. Statistical analyses were performed using one-way ANOVA with Bonferroni’s multiple comparisons test. (F) Representative mIHC images of LGALS3 + neutrophils in the tumor area of GBC-LI. (G) Slingshot trajectory plots of all neutrophils showing the pseudotime, tissue origins, cluster identities, and expression of the context-dependent scores. (H-K) Analysis of neutrophils on ST-02. Expression of neutrophil signature and the extracted neutrophil spots (H). Unsupervised clustering of neutrophil spots (I). Slingshot trajectory of neutrophil spots showing the clusters and the expression of Tumor-Modifying genes LGALS3 and ENO1 (J). Violin plot showing the expression level of Tumor-Modifying score in each neutrophil cluster (K) Data are presented as mean with SD. *P < 0.05, **P < 0.01, ***P < 0.001, ****P < 0.0001 See also Figure S2
Fig. 3
Fig. 3
A tumor-modifying state of neutrophils associated with cholesterol metabolism. (A) Left, heatmap showing the expression of pathways enriched in the representative neutrophil clusters; right, DotPlot displaying the expression level and percentage of relevant genes. (B and C) Mass spectrometry-based proteomic data of neutrophils from 3 GBC-LI patients. Top upregulated and downregulated pathways enriched in neutrophils from tumor and blood (B). Heatmap of the Module-Trait relationship for neutrophils of blood, liver, and tumor (C). (D and E) SCENIC analysis of neutrophil clusters based on scRNA-seq data. Heatmap displaying the predicted regulatory activity of top 10 regulons for Neu-T-CCL3 (D). RSS for Neu-T-CCL3, the top transcriptional factors were annotated (E). (F-H) Analysis of N1- and N2-like neutrophils within purified Tumor-Modifying neutrophils. Heatmap showing expression of the N1- and N2-like score for neutrophils of different sites (F). Heatmap displaying the top regulons for N1- and N2- like neutrophils, colored by the regulatory activity based on SCENIC analysis (G). Representative transcriptional factors related to N2-like and N1-like phenotypes and their targeted genes (H) See also Figures S3 and S4
Fig. 4
Fig. 4
GBC-neutrophil contact induces oxLDL uptake in neutrophils. (A) Representative histogram and quantification showing the oxLDL uptake by neutrophils from tumor and blood of GBC patients (n = 4) as measured by flow cytometry. Comparison was performed using two-tailed unpaired t-test. (B) Relative mRNA expression of CTSD, LGALS3 and PI3 in blood neutrophils before and after cultured in controlled media or EH-GB1 conditioned media (CM) for 24 h as measured by qRT-PCR. Statistical analyses were performed using one-way ANOVA with Tukey’s multiple comparisons test. (C) Quantification of oxLDL or LDL uptake by neutrophils after monoculture or co-cultured with EH-GB1 for 30 min as measured by flow cytometry. Statistical analyses were performed using two-way ANOVA with Sidak’s multiple comparisons test. (D) Representative histogram and quantification showing the oxLDL uptake of neutrophils after monoculture, cultured in EH-GB1 CM, or co-cultured with EH-GB1 at different Tumor: Neu ratio for 30 min as measured by flow cytometry. One-way ANOVA with Tukey’s multiple comparisons test. (E) Representative microscopic images of oxLDL-absorbing neutrophils (white arrow). EH-GB1 cells were pre-labeled with calcein-AM. (F) Representative mIHC staining of oxLDL-absorbing neutrophils on tissue sections of GBC patients. (G) Representative histogram and quantification showing the oxLDL uptake of neutrophils, monocytes, and lymphocytes after monoculture or co-cultured with EH-GB1 for 30 min as measured by flow cytometry. One-way ANOVA with Bonferroni’s multiple comparisons test Data are presented as mean with SD. *P < 0.05, **P < 0.01, ***P < 0.001, ****P < 0.0001 See also Figure S5
Fig. 5
Fig. 5
OLR1 mediates the oxLDL uptake of pro-tumor neutrophils. (A) Transwell invasion assay, showing the representative images and quantification of the invaded GBC cells. Cells were counted in each 20x field-of-view image. Two-way ANOVA with Sidak’s multiple comparisons test. (B) Percentage of viable GBC cells labeled with calcein-AM after monoculture or co-cultured with neutrophils with or without oxLDL supplement for 1 h and 24 h as measured by flow cytometry. Two-way ANOVA with Sidak’s multiple comparisons test. (C) Heatmap displaying the relative mRNA expression of cholesterol-related genes in monoculture neutrophils, Dil-oxLDLlow, and Dil-oxLDLhigh neutrophils as measured by qRT-PCR. (D) Quantification of relative mRNA expression of OLR1 and LDLR in neutrophils when monoculture or co-culture with or without oxLDL addition. Statistical analyses were performed using one-way ANOVA with Tukey’s multiple comparisons test. (E) Representative mIHC staining of OLR1 + oxLDL-absorbing neutrophils on sections of GBC-LI. (F) Representative histogram and quantification showing the percentage of oxLDL-absorbing neutrophil when co-cultured with EH-GB1 cells with treatment of different antibodies of common receptors for cholesterol. One-way ANOVA with Tukey’s multiple comparisons test Data are presented as mean with SD. *P < 0.05, **P < 0.01, ***P < 0.001, ****P < 0.0001 See also Figure S6
Fig. 6
Fig. 6
KRT17+ GBC cells cultivate the oxLDL-absorbing neutrophils. (A) Representative histogram and quantification showing the percentage of oxLDL-absorbing neutrophils induced by different GBC and HCC cell lines. One-way ANOVA with Tukey’s multiple comparisons test. (B) Volcano plot showing the differentially expressed genes between tumor cells from GBC-LI and GBC-Lo as measured by scRNA-seq analysis. The fold change of gene expression (GBC-LI versus GBC-Lo) and adjusted P values (Benjamini-Hochberg method) are shown. (C) Representative histograms and quantifications showing the percentage of oxLDL-absorbing neutrophils induced by monoculture or co-culture with EH-GB1 of siRNA knockdown of KRT17, ANXA1, IGFBP7, and CD9 respectively. Statistical analyses were performed using one-way ANOVA with Bonferroni’s multiple comparisons test. (D) UMAP of GBC cells colored by sample origin (left) and showing the expression of KRT17 (right). (E) Percentage of KRT17+ and KRT17- cells in all epithelial cells from different types of samples. (F) Left, representative mIHC images of KRT17+ GBC cells and CD66b+ neutrophils on section of GBC-LI (n = 5). The dash line separated the tumor and non-tumor area. Right, quantification of the neutrophil numbers in each KRT17high and KRT17low region (20x field-of-view, stratified by the 50% staining of KRT17 in PanCK+ GBC cells). Comparison was performed using two-tailed unpaired t-test. (G-I) Analysis of GBC cells on ST-02. Expression of GBC cell signature (top) and the extracted GBC cell spots (colored by cluster identity) (bottom) (G). Violin plots showing the expression of KRT17 signature (top) and fibroblast signature (bottom) in each GBC cell cluster, the annotated cluster is the KRT17-Fibroblast high cluster (H). Expression of KRT17 and fibroblast signature (I). (J) Histograms showing the average expression of KRT17 signature and Tumor-Modifying score of neutrophils in different tissue samples (normal GB, n = 3, chronic cholecystitis, n = 4; early GBC, n = 5; advanced GBC, n = 5) Data are presented as mean with SD. *P < 0.05, **P < 0.01, ***P < 0.001, ****P < 0.0001 See also Figure S7 and Figure S8

Similar articles

Cited by

References

    1. Zheng GX, Terry JM, Belgrader P, Ryvkin P, Bent ZW, Wilson R, Ziraldo SB, Wheeler TD, McDermott GP, Zhu J, et al. Massively parallel digital transcriptional profiling of single cells. Nat Commun. 2017;8:14049. doi: 10.1038/ncomms14049. - DOI - PMC - PubMed
    1. Aran D, Looney AP, Liu L, Wu E, Fong V, Hsu A, Chak S, Naikawadi RP, Wolters PJ, Abate AR, et al. Reference-based analysis of lung single-cell sequencing reveals a transitional profibrotic macrophage. Nat Immunol. 2019;20(2):163–72. doi: 10.1038/s41590-018-0276-y. - DOI - PMC - PubMed
    1. Satija R, Farrell JA, Gennert D, Schier AF, Regev A. Spatial reconstruction of single-cell gene expression data. Nat Biotechnol. 2015;33(5):495–502. doi: 10.1038/nbt.3192. - DOI - PMC - PubMed
    1. Patel AP, Tirosh I, Trombetta JJ, Shalek AK, Gillespie SM, Wakimoto H, Cahill DP, Nahed BV, Curry WT, Martuza RL, et al. Single-cell RNA-seq highlights intratumoral heterogeneity in primary glioblastoma. Science. 2014;344(6190):1396–401. doi: 10.1126/science.1254257. - DOI - PMC - PubMed
    1. Yu G, Wang LG, Han Y, He QY. clusterProfiler: an R package for comparing biological themes among gene clusters. OMICS. 2012;16(5):284–7. doi: 10.1089/omi.2011.0118. - DOI - PMC - PubMed

LinkOut - more resources