. 2024 Aug 7;32(8):2778-2797.
doi: 10.1016/j.ymthe.2024.05.038. Epub 2024 May 31.

PDIA3 orchestrates effector T cell program by serving as a chaperone to facilitate the non-canonical nuclear import of STAT1 and PKM2

Affiliations

PDIA3 orchestrates effector T cell program by serving as a chaperone to facilitate the non-canonical nuclear import of STAT1 and PKM2

Chun-Liang Yang et al. Mol Ther. .

Abstract

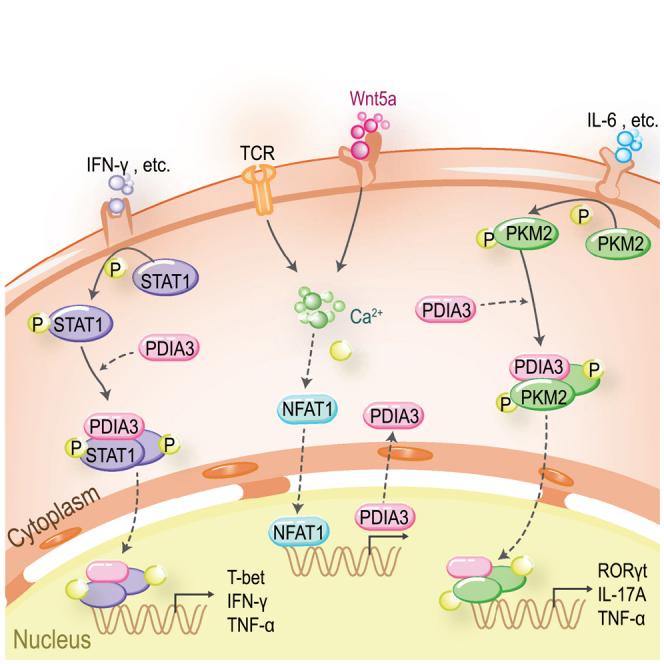
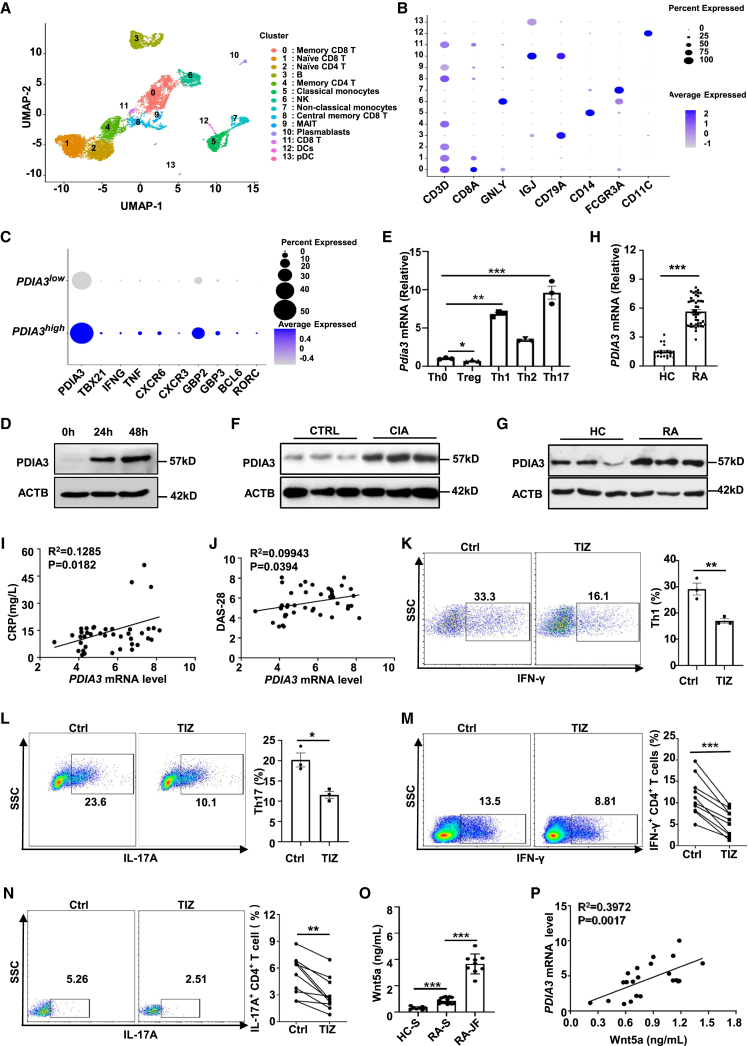
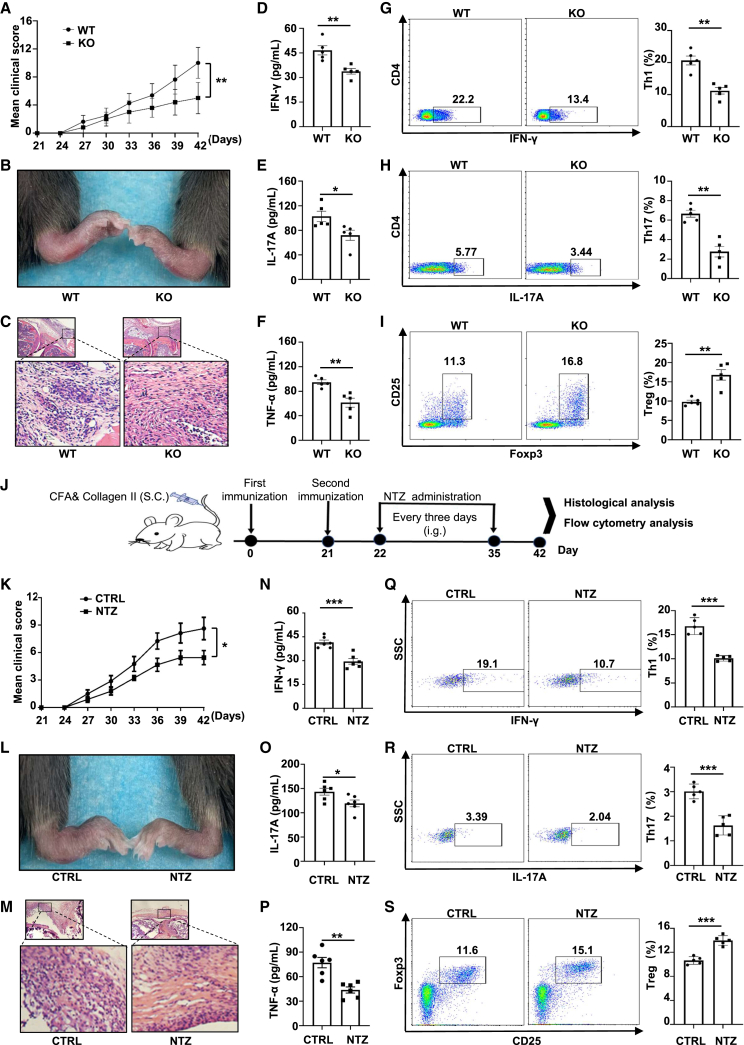
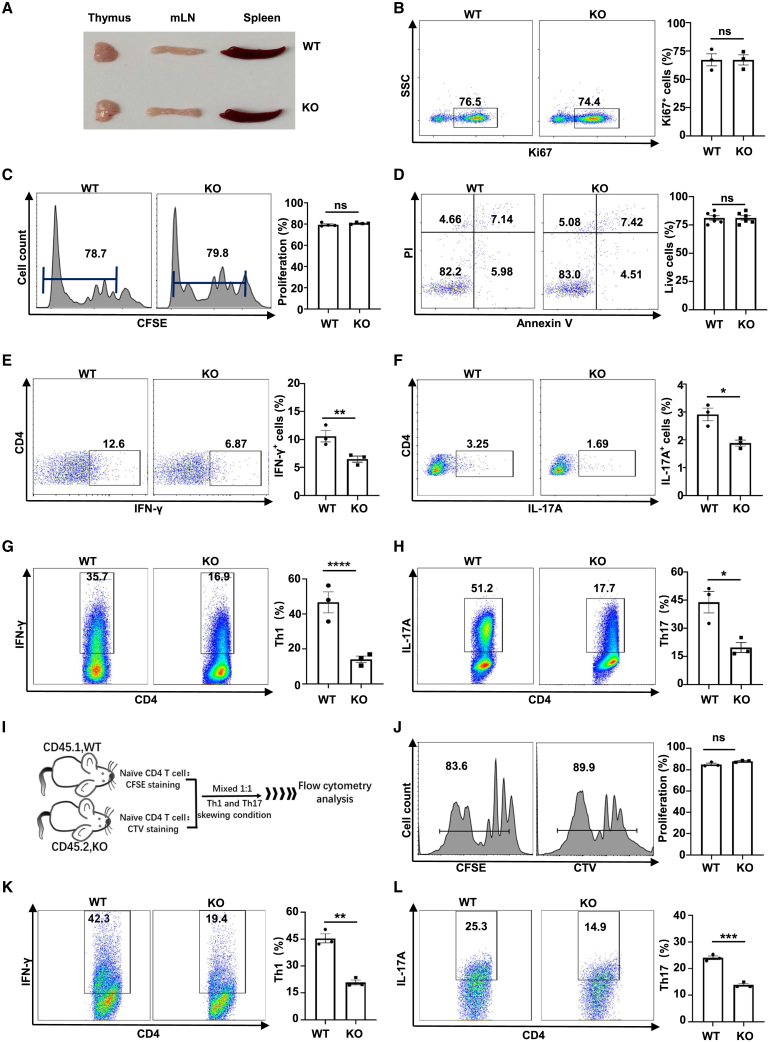
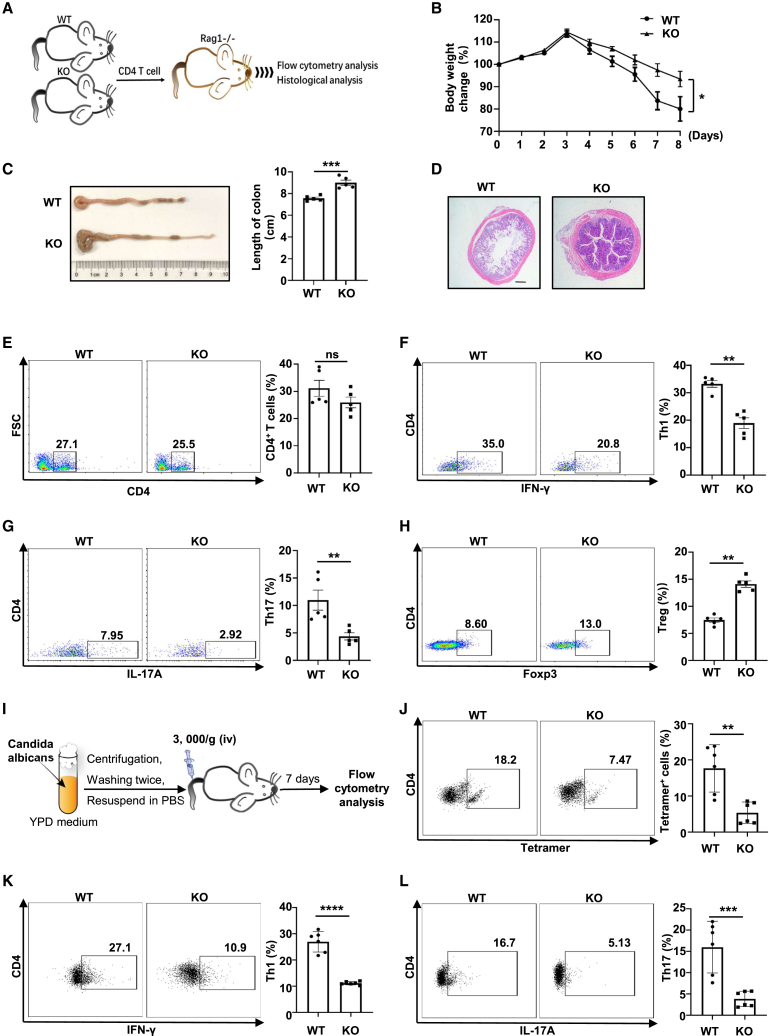
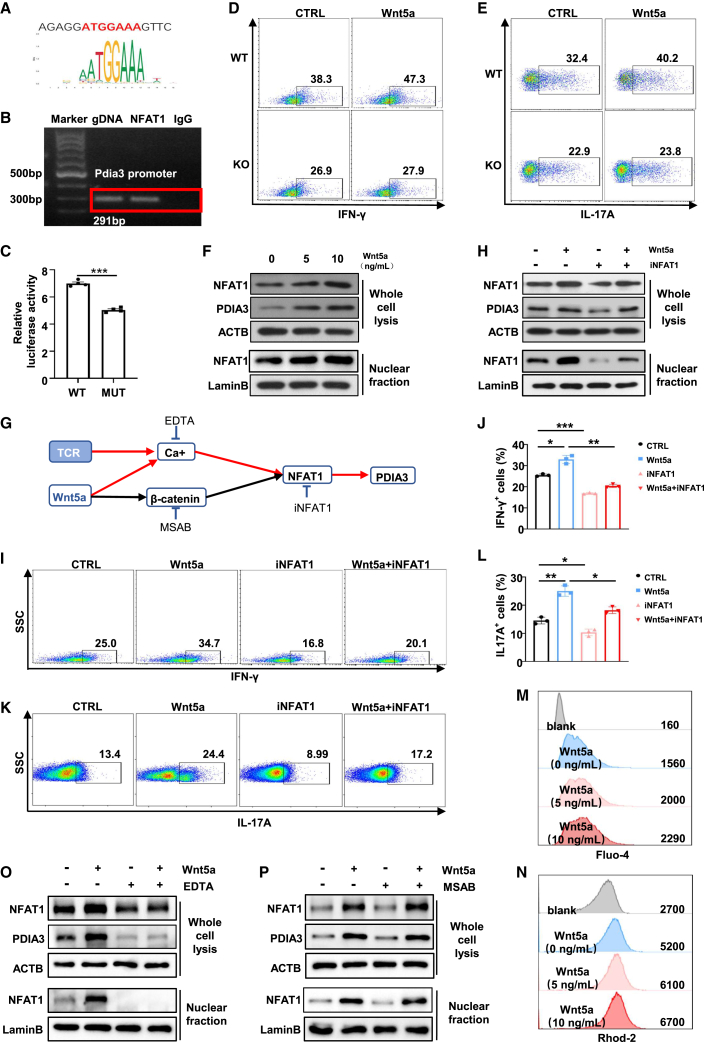
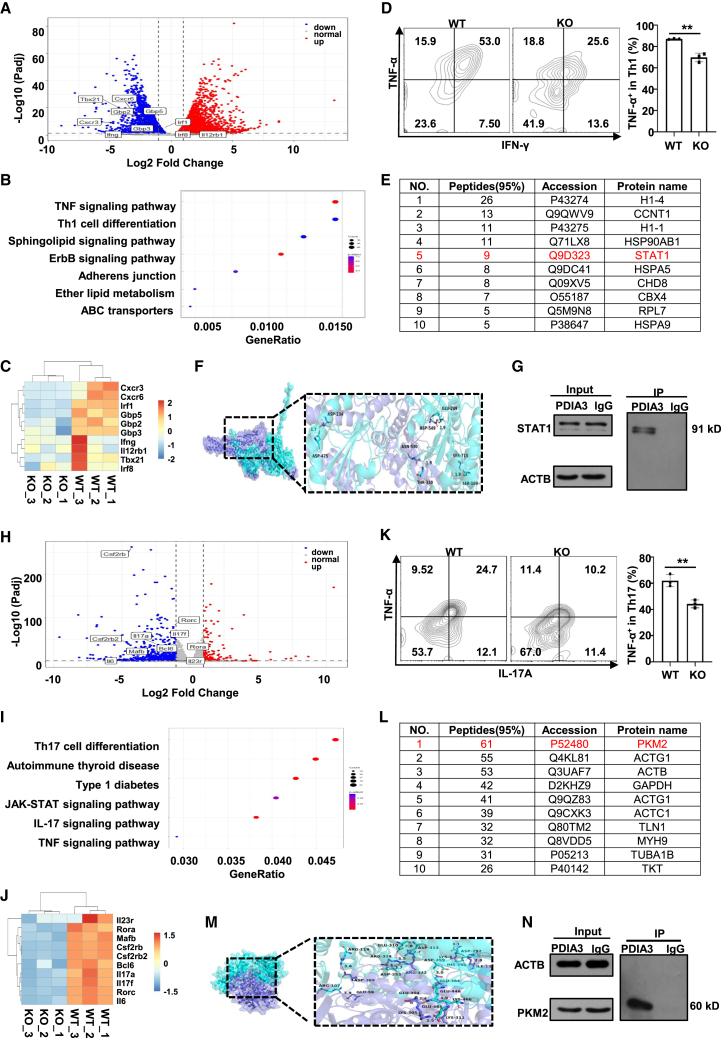
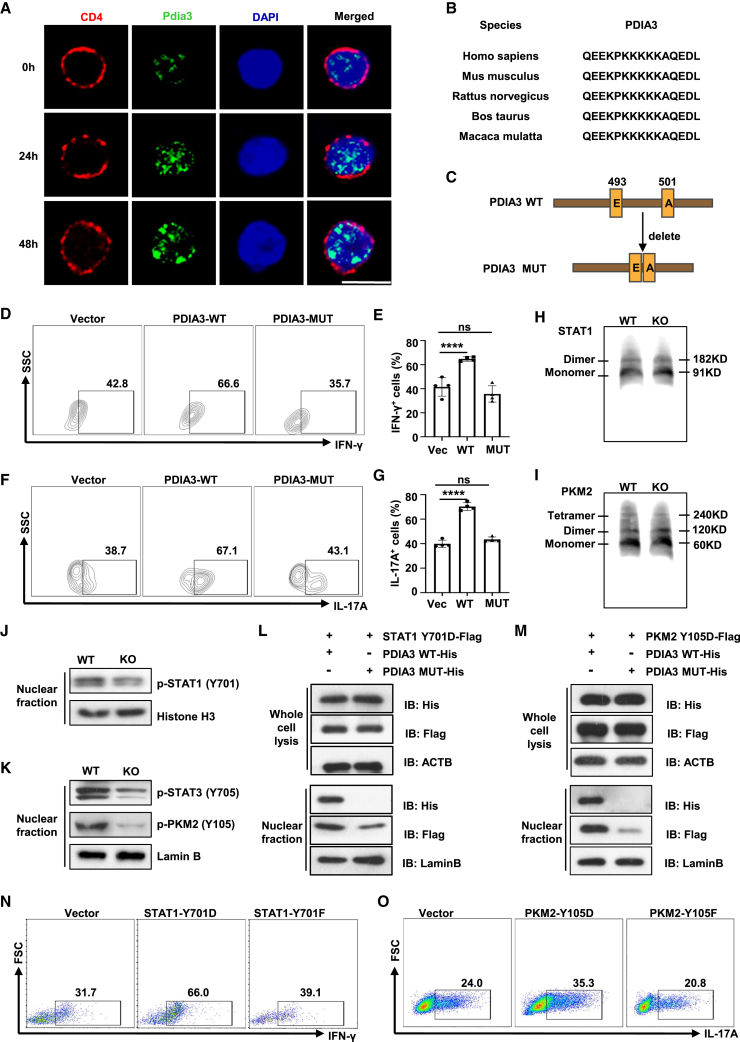
Dysregulated T cell activation underpins the immunopathology of rheumatoid arthritis (RA), yet the machineries that orchestrate T cell effector program remain incompletely understood. Herein, we leveraged bulk and single-cell RNA sequencing data from RA patients and validated protein disulfide isomerase family A member 3 (PDIA3) as a potential therapeutic target. PDIA3 is remarkably upregulated in pathogenic CD4 T cells derived from RA patients and positively correlates with C-reactive protein level and disease activity score 28. Pharmacological inhibition or genetic ablation of PDIA3 alleviates RA-associated articular pathology and autoimmune responses. Mechanistically, T cell receptor signaling triggers intracellular calcium flux to activate NFAT1, a process that is further potentiated by Wnt5a under RA settings. Activated NFAT1 then directly binds to the Pdia3 promoter to enhance the expression of PDIA3, which complexes with STAT1 or PKM2 to facilitate their nuclear import for transcribing T helper 1 (Th1) and Th17 lineage-related genes, respectively. This non-canonical regulatory mechanism likely occurs under pathological conditions, as PDIA3 could only be highly induced following aberrant external stimuli. Together, our data support that targeting PDIA3 is a vital strategy to mitigate autoimmune diseases, such as RA, in clinical settings.

Keywords: PDIA3; effector T cell program; non-canonical function; nuclear transport; rheumatoid arthritis.


Conflict of interest statement

Declaration of interests The authors declare that they have no conflict of interest.

Figures

None
Graphical abstract
Figure 1
Figure 1
PDIA3 is upregulated in arthritogenic CD4 T cells and positively correlates with RA severity (A) UMAP on PBMCs from an RA patient. Cell type annotations were labeled for each cluster. DC, dendritic cell; MAIT, mucosal-associated invariant T cell; NK, natural killer cell; pDC, plasmacytoid dendritic cell. (B) Dot plot of key markers used to define the identified cell populations. The color of dot represents the average expression, while the size of the dot represents the percent expression. (C) Dot plot of hallmark genes in PDIA3low and PDIA3high CD4 T cells. (D) Western blots showing PDIA3 expression in murine CD4 T cells stimulated with anti-CD3/CD28 antibodies at the indicated time points. (E) Quantification of Pdia3 mRNA in different T cell subsets by qRT-PCR. (F) Western blot analysis of PDIA3 expression in CD4 T cells from 8- to 10-week-old control and CIA mice. (G) Representative western blot analysis of PDIA3 expression in CD4 T cells from RA patients and healthy controls. (H) Quantification of PDIA3 mRNA levels in CD4 T cells from healthy controls (HCs) (n = 21) versus those from RA patients (n = 43). (I and J) The correlation between PDIA3 mRNA expression levels in CD4 T cells from RA patients (n = 43) with CRP (I) and disease activity score 28 (DAS-28) (J). (K and L) Tn cells from WT mice were cultured in the presence or absence of 5 μM TIZ in Th1- or Th17-skewed conditions. Flow cytometry data for IFN-γ (K, left) and IL-17A (L, left) staining, and the percentages of IFN-γ+ Th1 (K, right) and IL-17A+ Th17 (L, right) cells. (M and N) PBMCs from RA patients were cultured in vitro for 48 h in the presence or absence of TIZ. CD4+IFN-γ+ (M) and CD4+IL-17A+ (N) T cells were then evaluated by flow cytometry. (O) The concentration of Wnt5a in the serum from healthy individuals (n = 8), RA patients (n = 15), as well as in the RA synovial fluid (n = 9) measured by ELISA. HC-S, sera from healthy controls; RA-S, sera from RA patients; RA-JF, joint fluid from RA patients. (P) The correlation between Wnt5a expression levels in the serum and PDIA3 expression levels in CD4 T cells from RA patients (n = 22). Data are expressed as mean ± SEM and images are representative of at least three independent experiments. Statistical significance was calculated by unpaired Student’s t test. The correlation determined by Pearson’s correlation analysis was for (I), (J), and (P). ∗p < 0.05, ∗∗p < 0.01, ∗∗∗p < 0.001. ns, not significant.
Figure 2
Figure 2
Pharmacological inhibition or genetic ablation of PDIA3 protects mice against collagen-induced arthritis (A) Clinical scores in WT and KO mice after collagen-induced arthritis. (B) Representative picture of the ankle of WT and KO mice at day 42 after CIA induction. (C) Hematoxylin and eosin (H&E) staining of the ankle section from the arthritic mice. (D–F) Plasma IFN-γ (D), IL-17A (E), and TNF-α (F) levels in WT and KO arthritic mice 42 days after CIA induction. (G–I) Axillary lymph nodes from WT and KO arthritic mice were harvested at the same time and subjected to flow cytometry analysis. The frequencies of CD4+IFN-γ+ (Th1) (G), CD4+IL-17A+ (Th17) (H), and CD4+Foxp3+ (Treg) (I) subsets are shown as representative dot plot graphs. (J) The scheme for the RA mouse model with NTZ administration. (K) Clinical scores in control and NTZ-treated mice after collagen-induced arthritis. (L) Representative picture of the ankle of the arthritic mice day 42 after CIA induction. (M) H&E staining of ankle sections from the arthritic mice. (N–P) Plasma IFN-γ (N), IL-17A (O), and TNF-α (P) levels in WT and KO arthritic mice on 42 days after CIA induction. (Q–S) Axillary lymph nodes from these arthritic mice were harvested and subjected to flow cytometry analysis. The frequencies of CD4+IFN-γ+ (Th1) (Q), CD4+IL-17A+ (Th17) (R), and CD4+Foxp3+ (Treg) (S) subsets are shown as representative dot plot graphs. Data are expressed as mean ± SEM (n = 5 per group) and images are representative of at least three independent experiments. Statistical significance was calculated by unpaired Student’s t test. ∗p < 0.05, ∗∗p < 0.01, ∗∗∗p < 0.001. ns, not significant.
Figure 3
Figure 3
Pdia3 deficiency intrinsically impairs Th1 and Th17 program (A) Representative pictures of the thymus, mesenteric lymph nodes (mLN), and spleen from 8- to 12-week-old WT and KO mice. (B–F) Splenic Tn cells isolated from WT and KO mice aged 10 weeks were activated with plate-coated anti-CD3/CD28 (10 μg/mL) antibodies for 72 h. (B and C) The percentage of proliferated CD4 T cells was defined by Ki67 staining (B) and CFSE assay (C). (D) Apoptosis of T cells was determined by Annexin V/PI staining. (E and F) Expression of IFN-γ (E) and IL-17A (F) was examined in activated CD4 T cells. (G and H) Tn cells purified from WT and KO mice were cultured under Th1- or Th17-polarized conditions in vitro. Flow cytometry analysis of Th1 (G) and Th17 (H) cell frequencies. (I) The scheme for the co-culture experiments. (J) The percentage of proliferated CD4 T cells was defined by CFSE or cell-trace violet (CTV) staining. (K and L) The percentage of IFN-γ-producing Th1 cells (K) and IL-17A-producing Th17 cells (L) after co-culturing. The experiments were repeated at least three times.
Figure 4
Figure 4
Pdia3-deficient CD4 T cells are comprised in Th1 and Th17 program in vivo (A) The scheme for the adoptive transfer experiments. (B) The percentage of body weight change of WT and KO CD4 T cell recipients. (C) Representative colon images at day 9 after adoptive transfer and quantitative analysis of colon length. (D) Hematoxylin and eosin (H&E) staining of representative distal colon sections. (E–H) Mesenteric lymph nodes from WT and KO colitic mice were harvested and subjected to flow cytometry analysis. Frequencies of CD4+ T(E), CD4+IFN-γ+ (Th1) (F), CD4+IL-17A+ (Th17) (G), and CD4+Foxp3+ (Treg) (H) subsets are shown as representative dot plot graphs. (I) The scheme for C. albicans infection mouse model. (J–L) Splenocytes from infected WT and KO mice were analyzed by flow cytometry. Frequencies of CD4+ I-Ab OVA323-339 Tetramer+ CD4 T cells (J), CD4+ IFN-γ+ Th1 (K), and CD4+ IL-17A+ Th17 (L) subsets were shown as representative dot plot graphs. Data are expressed as mean ± SEM. Statistical significance was calculated by unpaired Student’s t test. ∗p < 0.05, ∗∗p < 0.01, ∗∗∗p < 0.001, ∗∗∗∗p < 0.0001. ns, not significant.
Figure 5
Figure 5
PDIA3 is upregulated in CD4 T cells via the TCR/Wnt5a-Ca2+-NFAT1 axis (A) The putative binding site in the Pdia3 promoter region for NFAT1 was predicted with a relative profile score threshold of 80%. (B) ChIP-PCR analysis of the NFAT1 binding activity to the Pdia3 promoter. (C) Luciferase reporter assays for the Pdia3 promoter conducted in HEK 293T cells. (D and E) Tn cells from WT and KO mice polarized to Th1(D) and Th17(E) cells in the presence of recombinant Wnt5a. (F) The expression of NFAT1 and PDIA3 was measured by immunoblotting in the presence of recombinant Wnt5a at the indicated concentrations. (G) The scheme to validate the upstream pathway of PDIA3. (H) The expression of NFAT1 and PDIA3 detected by Western blot analysis in the presence of recombinant Wnt5a and/or iNFAT1. (I–L) Tn cells from WT mice were skewed to Th1 (I and J) and Th17 (K and L) in the presence of recombinant Wnt5a and/or iNFAT1. (M and N) Flow cytometry analysis of calcium ions by detecting Fluo-4 (M) and Rhod-2 (N). (O) Western blot results of NFAT1 and PDIA3 expression in the presence of recombinant Wnt5a and/or EDTA. (P) The protein levels of NFAT1 and PDIA3 in the presence of recombinant Wnt5a and/or MSAB.
Figure 6
Figure 6
PDIA3 interacts with STAT1 or PKM2 in effector T cells (A–C) RNA-seq revealed differentially expressed genes (DEGs) in WT vs. KO Th1 cells. (A) Volcano plot showing DEGs between WT and KO Th1 cells. (B) KEGG pathway analysis on DEGs between WT and KO Th1 cells. (C) Representative heatmap results for selected DEGs between WT and KO Th1 cells. (D) Representative flow cytometry staining of INF-γ and TNF-α in differentiated Th1 cells from WT and KO mice. (E) Top 10 candidate binding partners of PDIA3 in Th1 cells. (F) Representative image of autodocking between PDIA3 and STAT1 protein. (G) Immunoprecipitation assay of the lysates of WT Th1 cells using anti-PDIA3 antibody. (H–J) RNA-seq revealed differentially expressed genes (DEGs) in WT vs. KO Th17 cells. (H) Volcano plot showing DEGs between WT vs. KO Th17 cells. (I) KEGG pathway analysis on DEGs between WT vs. KO Th17 cells. (J) Representative heatmap results for selected DEGs between WT vs. KO Th17 cells. (K) Representative flow cytometry results of IL-17A and TNF-α in differentiated Th17 cells from WT and KO mice. (L) Top 10 candidate binding partners of PDIA3 in Th17 cells. (M) Representative image of autodocking between PDIA3 and PKM2 protein. (N) Immunoprecipitation assay of the lysates of WT Th17 cells using anti-PDIA3 antibody. All in vitro studies were repeated at least three times. Data are expressed as mean ± SEM. Statistical significance was analyzed by unpaired Student’s t test. ∗∗p < 0.01.
Figure 7
Figure 7
PDIA3 facilitates STAT1 and PKM2 nuclear import to favor the effector T cell program (A) Confocal microscopy of PDIA3 (green) in Tn cells stimulated with anti-CD3/CD28 antibodies at the indicated time points. Scale bar, 10 μm. (B) Alignment of NLS sequences of PDIA3 among different species. (C) PDIA3 mutation with deletion of its NLS was established based on the NLS_mapper prediction. (D–G) Tn cells were transduced with vector, PDIA3-WT, or PDIA3-MUT retroviruses under Th1- and Th17-polarizing conditions. Flow cytometry data for IFN-γ (D) and IL-17A (F) staining, and the percentages of IFN-γ+ Th1 (E) and IL-17A+ Th17 (G) cells. (H and I) WT and KO CD4 T cells were exposed to IL-12 (H) or IL-6 (I) for 6 h and then analyzed by native PAGE. (J) Western blot analysis of p-STAT1 in nuclear fraction from WT and KO CD4 T cells following IL-12 stimulation for 30 min. (K) Western blot analysis of p-PKM2 and p-STAT3 in the nuclear fraction from WT and KO CD4 T cells following IL-6 stimulation for 30 min. (L) HEK 293T cells were transfected with a Flag tag-labeled STAT1-Y701D plasmid combined with a His tag-labeled WT Pdia3 plasmid (PDIA3 WT-His) or a His tag-labeled mutant Pdia3 plasmid (PDIA3 MUT-His). Western blot analysis of PDIA3 and STAT1 in whole cell lysate and nuclear fraction, respectively. (M) HEK 293T cells were transfected with Flag tag-labeled PKM2-Y105D plasmid combined with PDIA3 WT-His or PDIA3 MUT-His, respectively. Western blot analysis of PDIA3 and PKM2 in whole cell lysate and nuclear fraction. (N) KO Tn cells were transduced with Vector, Retro-STAT1-Y701D or Retro-STAT1-Y701F and cultured under Th1 condition for 3 days. The frequencies of IFN-γ+ Th1 cells were shown in representative dot plots. (O) KO Tn cells were transduced with vector, Retro-PKM2-Y105D, or Retro-PKM2-Y105F and cultured under Th17 condition for 3 days. The frequencies of IL-17A+ Th17 cells are shown in representative dot plots. All in vitro studies were repeated at least three times.

References

    1. Scherer H.U., Häupl T., Burmester G.R. The etiology of rheumatoid arthritis. J. Autoimmun. 2020;110 doi: 10.1016/j.jaut.2019.102400. - DOI - PubMed
    1. Cross M., Smith E., Hoy D., Carmona L., Wolfe F., Vos T., Williams B., Gabriel S., Lassere M., Johns N., et al. The global burden of rheumatoid arthritis: estimates from the global burden of disease 2010 study. Ann. Rheum. Dis. 2014;73:1316–1322. doi: 10.1136/annrheumdis-2013-204627. - DOI - PubMed
    1. Becede M., Alasti F., Gessl I., Haupt L., Kerschbaumer A., Landesmann U., Loiskandl M., Supp G.M., Smolen J.S., Aletaha D. Risk profiling for a refractory course of rheumatoid arthritis. Semin. Arthritis Rheum. 2019;49:211–217. doi: 10.1016/j.semarthrit.2019.02.004. - DOI - PubMed
    1. Ehrenstein M.R., Evans J.G., Singh A., Moore S., Warnes G., Isenberg D.A., Mauri C. Compromised function of regulatory T cells in rheumatoid arthritis and reversal by anti-TNFalpha therapy. J. Exp. Med. 2004;200:277–285. doi: 10.1084/jem.20040165. - DOI - PMC - PubMed
    1. Yamanaka H., Tanaka E., Nakajima A., Furuya T., Ikari K., Taniguchi A., Inoue E., Harigai M. A large observational cohort study of rheumatoid arthritis, IORRA: Providing context for today's treatment options. Mod. Rheumatol. 2020;30:1–6. doi: 10.1080/14397595.2019.1660028. - DOI - PubMed

MeSH terms