. 2024 Jul;242(7):1773-1786.
doi: 10.1007/s00221-024-06852-5. Epub 2024 Jun 1.

Non-additive effects of electrical stimulation of the dorsolateral prefrontal cortex and the vestibular system on muscle sympathetic nerve activity in humans

Affiliations

Non-additive effects of electrical stimulation of the dorsolateral prefrontal cortex and the vestibular system on muscle sympathetic nerve activity in humans

Brendan McCarthy et al. Exp Brain Res. 2024 Jul.

Abstract

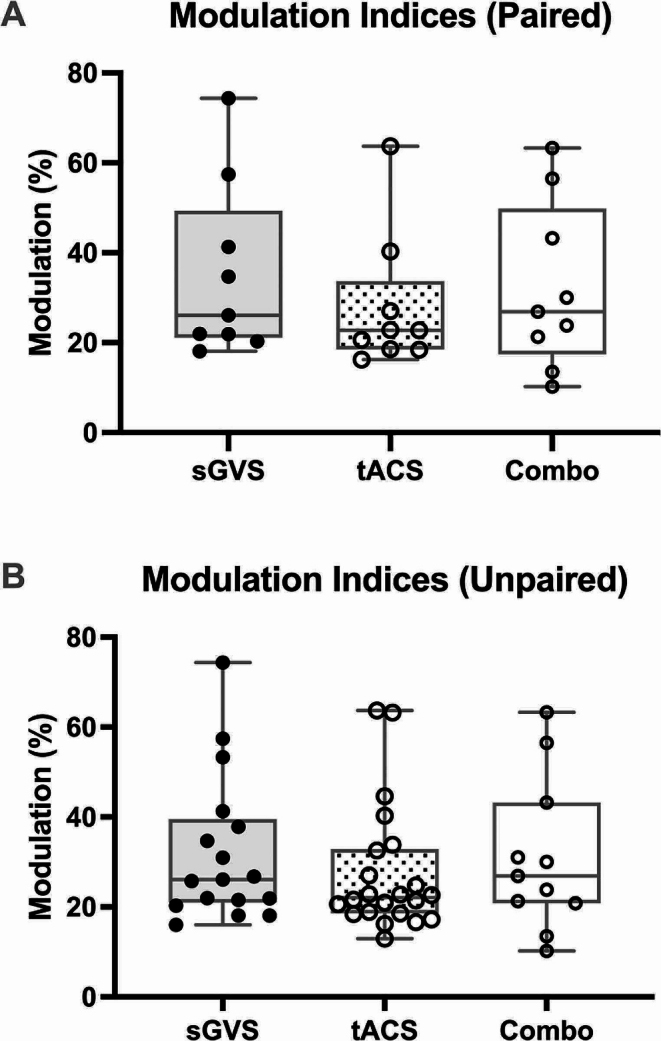
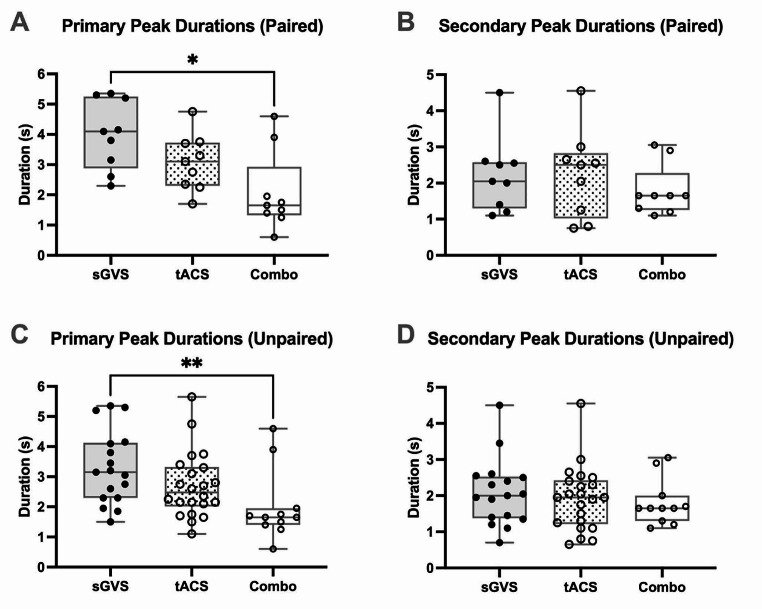
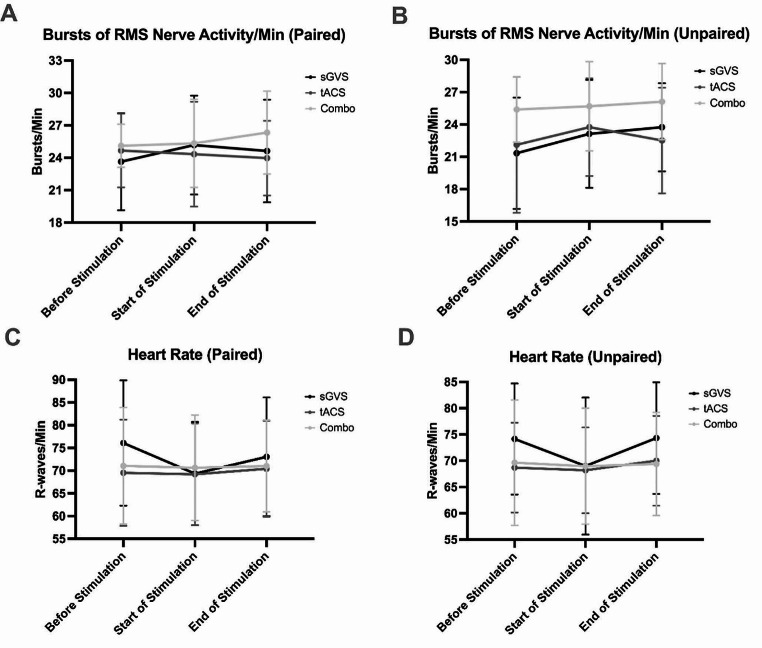
Sinusoidal galvanic vestibular stimulation (sGVS) induces robust modulation of muscle sympathetic nerve activity (MSNA) alongside perceptions of side-to-side movement, sometimes with an accompanying feeling of nausea. We recently showed that transcranial alternating current stimulation (tACS) of the dorsolateral prefrontal cortex (dlPFC) also modulates MSNA, but does not generate any perceptions. Here, we tested the hypothesis that when the two stimuli are given concurrently, the modulation of MSNA would be additive. MSNA was recorded from 11 awake participants via a tungsten microelectrode inserted percutaneously into the right common peroneal nerve at the fibular head. Sinusoidal stimuli (± 2 mA, 0.08 Hz, 100 cycles) were applied in randomised order as follows: (i) tACS of the dlPFC at electroencephalogram (EEG) site F4 and referenced to the nasion; (ii) bilateral sGVS applied to the vestibular apparatuses via the mastoid processes; and (iii) tACS and sGVS together. Previously obtained data from 12 participants supplemented the data for stimulation protocols (i) and (ii). Cross-correlation analysis revealed that each stimulation protocol caused significant modulation of MSNA (modulation index (paired data): 35.2 ± 19.4% for sGVS; 27.8 ± 15.2% for tACS), but there were no additive effects when tACS and sGVS were delivered concurrently (32.1 ± 18.5%). This implies that the vestibulosympathetic reflexes are attenuated with concurrent dlPFC stimulation. These results suggest that the dlPFC is capable of blocking the processing of vestibular inputs through the brainstem and, hence, the generation of vestibulosympathetic reflexes.

Keywords: Dorsolateral prefrontal cortex; Muscle sympathetic nerve activity; Rostral ventrolateral medulla; Transcranial electrical stimulation; Vestibular system.


Conflict of interest statement

All authors declare no conflict of interest.

Figures

Fig. 1
Fig. 1
Cross-correlation histogram data obtained from a single female participant. (A) displays muscle sympathetic nerve activity (MSNA) data generated during sinusoidal galvanic vestibular stimulation (sGVS), (B) displays MSNA data obtained from transcranial alternating current stimulation (tACS) of the dorsolateral prefrontal cortex (dlPFC) and (C) displays MSNA data from combined stimulation measures. The black line overlayed on each graph denotes the smoothed polynomial and is set to the right Y-axis, while the left Y-axis represents raw data in 50 ms time bins. Data across a recording period were pooled to generate average activity at time zero, with average bursts prior and subsequent to this time point occurring during the negative and positive time periods, respectively
Fig. 2
Fig. 2
Modulation indices of primary peaks during each stimulation procedure. (A) shows the modulation of MSNA, as a percentage, specifically in the nine participants who underwent all three stimuli (Friedman test, P = 0.3977). P values for the paired data comparisons are as follows: sGVS vs. tACS, P = 0.4719; sGVS vs. Combo, P > 0.9999; tACS vs. Combo, P > 0.9999. (B) shows percentage of modulation of MSNA from every participant (n = 23), regardless of whether or not they underwent all three stimulation protocols (n = 17 for sGVS; n = 22 for tACS of the dlPFC; n = 11 for combined stimulation) (Kruskal-Wallis test, P = 0.5287). P values for the unpaired data comparisons are as follows: sGVS vs. tACS, P = 0.8552; sGVS vs. Combo, P > 0.9999; tACS vs. Combo, P > 0.9999. ‘Combo’ refers to combined sGVS and tACS stimulation. The box plots indicate the median, 25% and 75% confidence intervals. Error bars denote data points outside the interquartile range (IQR). No statistically significance (P > 0.05) differences were found between each group in either data set
Fig. 3
Fig. 3
Latency of MSNA peak expression. (A) denotes the paired data (n = 9) for the time taken (seconds) for a primary peak of MSNA to appear during each stimulation procedure, with reference to cross-correlation histograms (RM one-way ANOVA, P = 0.2992). P values for the comparisons between stimulations are as follows: sGVS vs. tACS, P = 0.9752; sGVS vs. Combo, P = 0.2251; tACS vs. Combo, P = 0.4429. (B) presents paired data (n = 9) of the latency for secondary peaks (RM one-way ANOVA, P = 0.9305). P values for the comparisons between stimulations are as follows: sGVS vs. tACS, P = 0.9990; sGVS vs. Combo, P = 0.9556; tACS vs. Combo, P = 0.9497. Unpaired (n = 17 for sGVS; n = 22 for tACS of the dlPFC; n = 11 for combo) primary peak latency is depicted in (C) (ordinary one-way ANOVA, P = 0.6037), alongside unpaired secondary peak latency in (D) (ordinary one-way ANOVA, P = 0.2146). P values for the unpaired primary peak comparisons are as follows: sGVS vs. tACS, P = 0.9766; sGVS vs. Combo, P = 0.5994; tACS vs. Combo, P = 0.6834. P values for the unpaired secondary peak comparisons are as follows: sGVS vs. tACS, P = 0.9933; sGVS vs. Combo, P = 0.2463; tACS vs. Combo, P = 0.2542. ‘Combo’ refers to combined sGVS and tACS stimulation. The box plots indicate the median, 25% and 75% confidence intervals. Error bars denote data points outside the IQR. No significant (P > 0.05) differences were observed between each method of stimulation in both the paired and unpaired data sets
Fig. 4
Fig. 4
Durations of expression of MSNA peaks. (A) shows paired data (n = 9) of the duration, in seconds, of primary peaks of MSNA in each of the three stimuli (RM one-way ANOVA, P = 0.0139). P values for the comparisons between stimulations are as follows: sGVS vs. tACS, P = 0.0797; sGVS vs. Combo, P = 0.0318; tACS vs. Combo, P = 0.2384. (B) presents the duration of the secondary peaks from the same data sets (n = 9) (Friedman test, P = 0.9712). P values for the comparisons between stimulations are as follows: sGVS vs. tACS, P > 0.9999; sGVS vs. Combo, P > 0.9999; tACS vs. Combo, P > 0.9999. Peak duration is calculated as the time between the apex and trough of the peak of MSNA modulation, generated via cross-correlation histograms. A significant difference was found between sGVS and combined stimulation primary peaks in this paired data set (*P = 0.0318). (C) and (D) display unpaired primary (Kruskal-Wallis test, P = 0.0067) and secondary (Kruskal-Wallis test, P = 0.6785) peak duration, respectively, across all acquired data from the 23 experiments. P values for the unpaired primary peak comparisons are as follows: sGVS vs. tACS, P = 0.4363; sGVS vs. Combo, P = 0.0046; tACS vs. Combo, P = 0.1228. P values for the unpaired secondary peak comparisons are as follows: sGVS vs. tACS, P > 0.9999; sGVS vs. Combo, P > 0.9999; tACS vs. Combo, P > 0.9999. A significant difference was found between sGVS and combined stimulation primary peaks in this unpaired data set (**P = 0.0046). ‘Combo’ refers to combined sGVS and tACS stimulation. The box plots indicate the median, 25% and 75% confidence intervals. Error bars denote data points outside the IQR
Fig. 5
Fig. 5
Relationships between MSNA peaks and sine waves. The charts in (A) and (B) display the occurrence of primary and secondary peaks of MSNA, respectively, with regards to the phase of the sinusoidal stimulation during sGVS (n = 17). (C) shows primary and (D) shows secondary peaks of MSNA during tACS of the dlPFC (n = 22). Primary and secondary peaks of MSNA during combined stimulation (n = 11) are seen in charts (E) and (F). MSNA peaks were defined as occurring during the peak of the sine wave, the trough of the sine wave or approximately midway between the peak and trough, as seen via cross-correlation histograms. Analysis (paired data: Friedman test, P = 0.7212; unpaired data: Kruskal-Wallis test, P = 0.5709) of the patterns of occurrence revealed no statistical significance (P > 0.05) between each group
Fig. 6
Fig. 6
MSNA burst frequency and heart rate. Each graph represents three-minute time periods before, at the start, and at the end of each sGVS, tACS of the dlPFC, and combined stimulation protocol. (A) displays MSNA bursts per minute (calculated from the root mean square (RMS) of the raw nerve activity) in the paired (n = 9) data set (RM one-way ANOVA, P = 0.6080), while (B) represents unpaired sGVS (n = 17), tACS (n = 22), and combined stimulation (n = 11) data (ordinary one-way ANOVA, P = 0.1022). Paired (RM one-way ANOVA, P = 0.0895) and unpaired (ordinary one-way ANOVA, P = 0.5041) heart rate data are shown in (C) and (D), respectively. No significant (P > 0.05) differences were found at any time across or between any of the stimulation protocols. Data are presented as mean values with error bars denoting standard deviation (SD)

Similar articles

Cited by

References

    1. Agarwal S, Gelsema A, Calaresu F. Neurons in rostral VLM are inhibited by chemical stimulation of caudal VLM in rats. Am J Physiol Regul Integr Compar Physiol. 1989;257:R265–R270. doi: 10.1152/ajpregu.1989.257.2.R265. - DOI - PubMed
    1. Agarwal S, Gelsema A, Calaresu F. Inhibition of rostral VLM by baroreceptor activation is relayed through caudal VLM. Am J Physiol Regul Integr Compar Physiol. 1990;258:R1271–R1278. doi: 10.1152/ajpregu.1990.258.5.R1271. - DOI - PubMed
    1. Akbarian S, Grüsser O-J, Guldin WO. Corticofugal projections to the vestibular nuclei in squirrel monkeys: further evidence of multiple cortical vestibular fields. J Compar Neurol. 1993;332:89–104. doi: 10.1002/cne.903320107. - DOI - PubMed
    1. Alekseichuck I, Falchier AY, Linn G, Xu T, Milham MP, Schroeder CE, Opitz A. Electric field dynamics in the brain during multi-electrode transcranial electric stimulation. Nat Commun. 2019;10:2573. doi: 10.1038/s41467-019-10581-7. - DOI - PMC - PubMed
    1. Bent LR, Bolton PS, Macefield VG. Modulation of muscle sympathetic bursts by sinusoidal galvanic vestibular stimulation in human subjects. Exp Brain Res. 2006;174:701–711. doi: 10.1007/s00221-006-0515-6. - DOI - PubMed

LinkOut - more resources