Spatial profiles of the bacterial microbiota throughout the gastrointestinal tract of dairy goats
- PMID: 38822843
- PMCID: PMC11144141
- DOI: 10.1007/s00253-024-13200-8
Spatial profiles of the bacterial microbiota throughout the gastrointestinal tract of dairy goats
Abstract
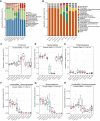
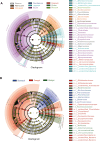
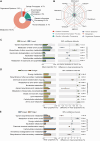
The gastrointestinal tract (GIT) is stationed by a dynamic and complex microbial community with functions in digestion, metabolism, immunomodulation, and reproduction. However, there is relatively little research on the composition and function of microorganisms in different GIT segments in dairy goats. Herein, 80 chyme samples were taken from ten GIT sites of eight Xinong Saanen dairy goats and then analyzed and identified the microbial composition via 16S rRNA V1-V9 amplicon sequencing. A total of 6669 different operational taxonomic units (OTUs) were clustered, and 187 OTUs were shared by ten GIT segments. We observed 264 species belonging to 23 different phyla scattered across ten GITs, with Firmicutes (52.42%) and Bacteroidetes (22.88%) predominating. The results revealed obvious location differences in the composition, diversity, and function of the GIT microbiota. In LEfSe analysis, unidentified_Lachnospiraceae and unidentified_Succinniclassicum were significantly enriched in the four chambers of stomach, with functions in carbohydrate fermentation to compose short-chain fatty acids. Aeriscardovia, Candidatus_Saccharimonas, and Romboutsia were significantly higher in the foregut, playing an important role in synthesizing enzymes, amino acids, and vitamins and immunomodulation. Akkermansia, Bacteroides, and Alistipes were significantly abundant in the hindgut to degrade polysaccharides and oligosaccharides, etc. From rumen to rectum, α-diversity decreased first and then increased, while β-diversity showed the opposite trend. Metabolism was the major function of the GIT microbiome predicted by PICRUSt2, but with variation in target substrates along the regions. In summary, GIT segments play a decisive role in the composition and functions of microorganisms. KEY POINTS: • The jejunum and ileum were harsh for microorganisms to colonize due to the presence of bile acids, enzymes, faster chyme circulation, etc., exhibiting the lowest α-diversity and the highest β-diversity. • Variability in microbial profiles between the three foregut segments was greater than four chambers of stomach and hindgut, with a higher abundance of Firmicutes dominating than others. • Dairy goats dominated a higher abundance of Kiritimatiellaeota than cows, which was reported to be associated with fatty acid synthesis.
Keywords: 16S rRNA; Dairy goats; Diversity; GIT; Microbial profiles.
© 2024. The Author(s).
Conflict of interest statement
The authors declare no competing interests.
Figures


Similar articles
-
Characterizing the bacterial community across the gastrointestinal tract of goats: Composition and potential function.Microbiologyopen. 2019 Sep;8(9):e00820. doi: 10.1002/mbo3.820. Epub 2019 Mar 3. Microbiologyopen. 2019. PMID: 30829000 Free PMC article.
-
Characterizing the bacterial microbiota in different gastrointestinal tract segments of the Bactrian camel.Sci Rep. 2018 Jan 12;8(1):654. doi: 10.1038/s41598-017-18298-7. Sci Rep. 2018. PMID: 29330494 Free PMC article.
-
Spatial heterogeneity determines the gastrointestinal microbiome signatures and ecological processes that govern bacterial community assembly in sheep.Microbiol Spectr. 2025 Feb 4;13(2):e0111024. doi: 10.1128/spectrum.01110-24. Epub 2024 Dec 23. Microbiol Spectr. 2025. PMID: 39714160 Free PMC article.
-
Characterising the bacterial microbiota across the gastrointestinal tracts of dairy cattle: membership and potential function.Sci Rep. 2015 Nov 3;5:16116. doi: 10.1038/srep16116. Sci Rep. 2015. PMID: 26527325 Free PMC article.
-
Defining the human microbiome.Nutr Rev. 2012 Aug;70 Suppl 1(Suppl 1):S38-44. doi: 10.1111/j.1753-4887.2012.00493.x. Nutr Rev. 2012. PMID: 22861806 Free PMC article. Review.
Cited by
-
Absolute quantitative metagenomic analysis reveals unique gut bacteria underlying berberine and metformin's anti-metabolic disorders effects.Microbiol Spectr. 2025 Sep 2;13(9):e0008425. doi: 10.1128/spectrum.00084-25. Epub 2025 Jul 31. Microbiol Spectr. 2025. PMID: 40744840 Free PMC article.
-
Dynamic Changes in Intestinal Microorganisms and Hematological Indices in Giraffes of Different Ages, and the Effect of Diarrhea on Intestinal Microbiota.Animals (Basel). 2024 Nov 24;14(23):3379. doi: 10.3390/ani14233379. Animals (Basel). 2024. PMID: 39682345 Free PMC article.
-
Detection of Gastrointestinal Pathogens with Zoonotic Potential in Horses Used in Free-Riding Activities during a Countrywide Study in Greece.Animals (Basel). 2024 Sep 3;14(17):2566. doi: 10.3390/ani14172566. Animals (Basel). 2024. PMID: 39272351 Free PMC article.
References
-
- Amin AB, Zhang L, Zhang J, Mao S (2023) Metagenomics analysis reveals differences in rumen microbiota in cows with low and high milk protein percentage. Appl Microbiol Biotechnol 107:4887–4902. 10.1007/s00253-023-12620-2 - PubMed
-
- Aziz Q, Dore J, Emmanuel A, Guarner F, Quigley EM (2013) Gut microbiota and gastrointestinal health: current concepts and future directions. Neurogastroenterol Motil 25:4–15. 10.1111/nmo.12046 - PubMed
-
- Baars A, Oosting A, Lohuis M, Koehorst M, El Aidy S, Hugenholtz F, Smidt H, Mischke M, Boekschoten MV, Verkade HJ, Garssen J, van der Beek EM, Knol J, de Vos P, van Bergenhenegouwen J, Fransen F (2018) Sex differences in lipid metabolism are affected by presence of the gut microbiota. Sci Rep 8:13426. 10.1038/s41598-018-31695-w - PMC - PubMed
-
- Binda C, Lopetuso LR, Rizzatti G, Gibiino G, Cennamo V, Gasbarrini A (2018) Actinobacteria: a relevant minority for the maintenance of gut homeostasis. Dig Liver Dis 50:421–428. 10.1016/j.dld.2018.02.012 - PubMed
MeSH terms
Substances
Grants and funding
LinkOut - more resources
Full Text Sources

