

Apixaban plasma concentrations in patients with obesity
- PMID: 38822847
- PMCID: PMC11303434
- DOI: 10.1007/s00228-024-03696-4
Apixaban plasma concentrations in patients with obesity
Abstract
Purpose: Routine therapeutic drug monitoring of apixaban is currently not recommended but may however be warranted in some situations and for some patient groups to provide better and safer treatment. Due to limited data on apixaban concentrations in different subpopulations, it is still unclear which group of patients could possibly gain from monitoring. The purpose of this study was to examine apixaban exposure in patients with obesity compared with normal-weight patients.
Methods: Forty patients with obesity (mean BMI 39.4 kg/m2) and 40 controls with normal weight (mean BMI 23.4 kg/m2), treated with apixaban 5 mg twice daily were included. The patients were matched for age, sex, and renal function. Trough and peak apixaban concentrations were measured with LC‒MS/MS methodology.
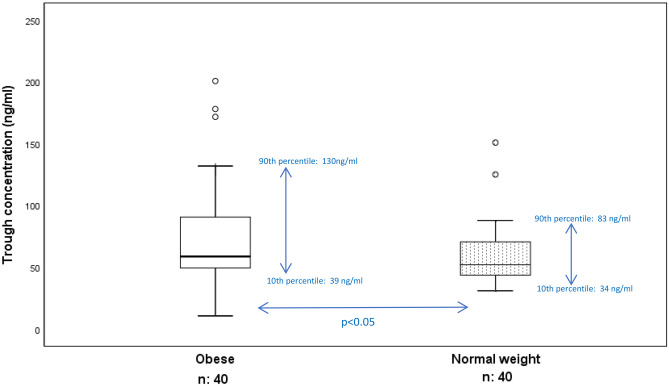
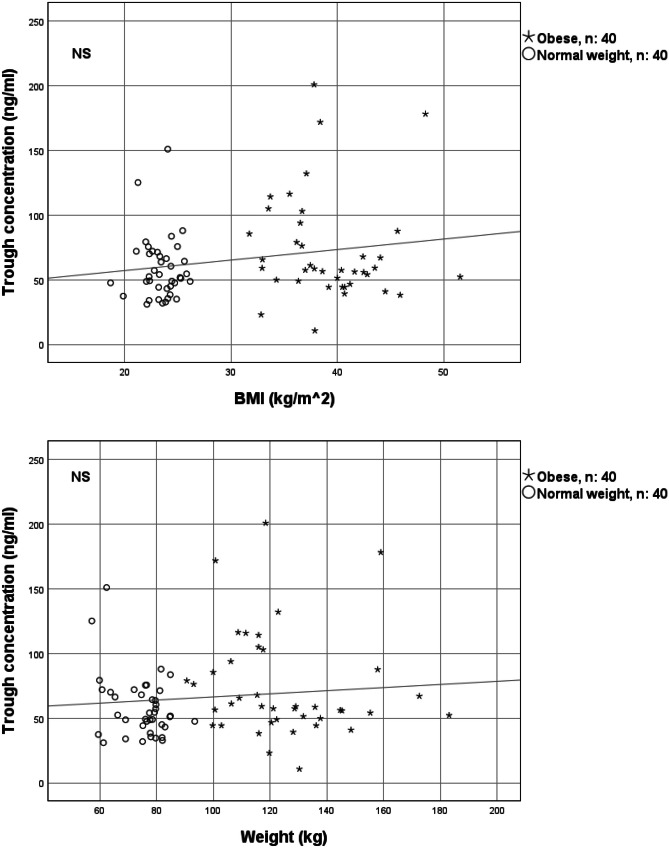
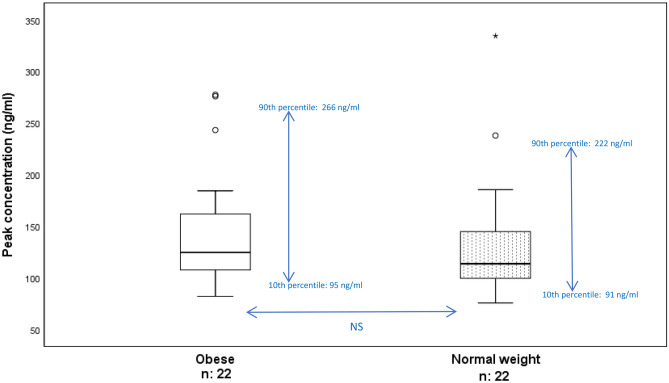
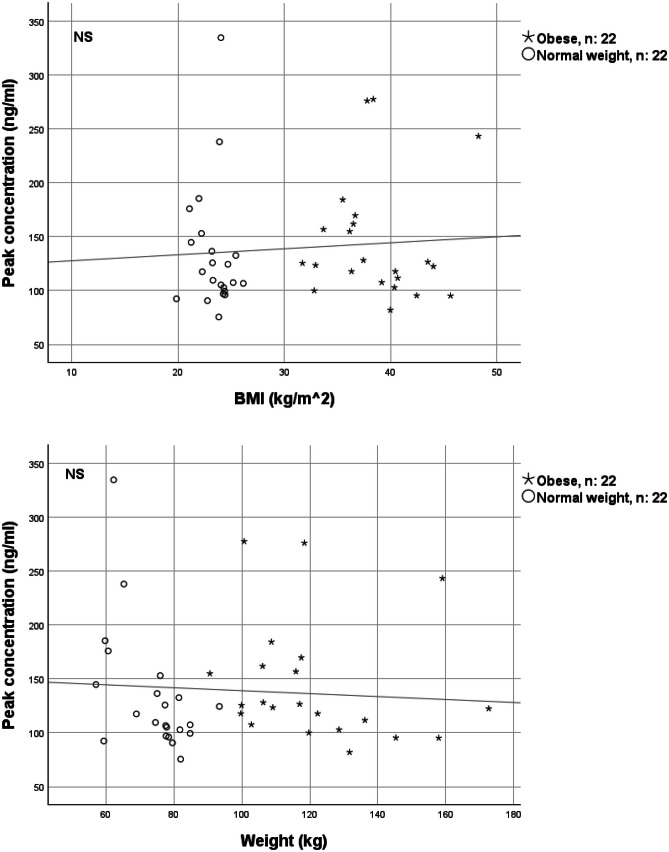
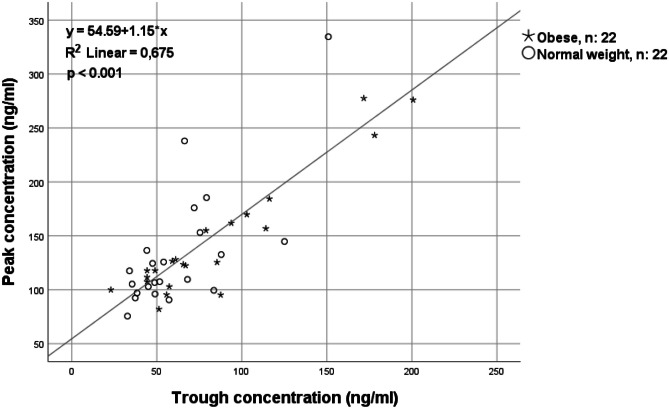
Results: The median trough concentrations in patients with obesity (58.7, range 10.7-200.7 ng/ml) were slightly higher than those in patients with normal weight (52.0, range 31.0-150.9 ng/ml) (p < 0.05). Notably, the variability in trough concentration was considerably higher in patients with obesity. Peak concentrations were similar in both groups, with a median of 124.5 ng/ml (range 82.0-277.5) and 113.5 ng/ml (range 75.5-334.6) in patients with obesity and normal weight, respectively.
Conclusion: Apixaban exposure did not vary substantially between obese and normal weight matched controls, implying that general dose adjustments are not required. However, vast interindividual variability was observed in patients with obesity, suggesting that measuring the concentrations could be valuable for specific patients. Further research is needed to identify which specific patients may benefit from this approach.
Keywords: Apixaban; Body weight; Obesity; Plasma concentration; Therapeutic drug monitoring.
© 2024. The Author(s).
Conflict of interest statement
The authors declare no competing interests.
Figures
Similar articles
-
The Influence of High Body Mass Index (BMI > 35 kg/m2) on Apixaban Plasma Concentration in Patients with Atrial Fibrillation.Am J Cardiovasc Drugs. 2025 Jan;25(1):113-123. doi: 10.1007/s40256-024-00678-w. Epub 2024 Oct 18. Am J Cardiovasc Drugs. 2025. PMID: 39424747 Free PMC article.
-
Apixaban trough concentrations in atrial fibrillation patients with reduced renal function.Biomed Pharmacother. 2024 Nov;180:117613. doi: 10.1016/j.biopha.2024.117613. Epub 2024 Oct 28. Biomed Pharmacother. 2024. PMID: 39467471
-
Clinical evaluation of laboratory methods to monitor apixaban treatment in patients with atrial fibrillation.Thromb Res. 2015 Jul;136(1):148-53. doi: 10.1016/j.thromres.2015.04.030. Epub 2015 Apr 30. Thromb Res. 2015. PMID: 25981142
-
Apixaban plasma concentrations before and after catheter ablation for atrial fibrillation.PLoS One. 2024 Jul 31;19(7):e0308022. doi: 10.1371/journal.pone.0308022. eCollection 2024. PLoS One. 2024. PMID: 39083480 Free PMC article.
-
Pharmacodynamics, pharmacokinetics and clinical efficacy of apixaban in the treatment of thrombosis.Expert Opin Drug Metab Toxicol. 2016 May;12(5):575-80. doi: 10.1517/17425255.2016.1164692. Epub 2016 Apr 1. Expert Opin Drug Metab Toxicol. 2016. PMID: 26982962 Review.
Cited by
-
The Influence of High Body Mass Index (BMI > 35 kg/m2) on Apixaban Plasma Concentration in Patients with Atrial Fibrillation.Am J Cardiovasc Drugs. 2025 Jan;25(1):113-123. doi: 10.1007/s40256-024-00678-w. Epub 2024 Oct 18. Am J Cardiovasc Drugs. 2025. PMID: 39424747 Free PMC article.
References
-
- World Health Organization (2019) Obesity and overweight. https://www.who.int/news-room/fact-sheets/detail/obesity-and-overweight. Accessed 15 Sept 2023
-
- World Health Organization (2019) Obesity. https://www.who.int/health-topics/obesity#tab=tab_1. Accessed 15 Sept 2023
MeSH terms
Substances
LinkOut - more resources
Full Text Sources
Medical
