. 2024 Jun 25;43(6):114296.
doi: 10.1016/j.celrep.2024.114296. Epub 2024 May 31.

Quantitative trait loci mapping provides insights into the genetic regulation of dendritic cell numbers in mouse tissues

Affiliations

Quantitative trait loci mapping provides insights into the genetic regulation of dendritic cell numbers in mouse tissues

Thiago Y Oliveira et al. Cell Rep. .

Abstract

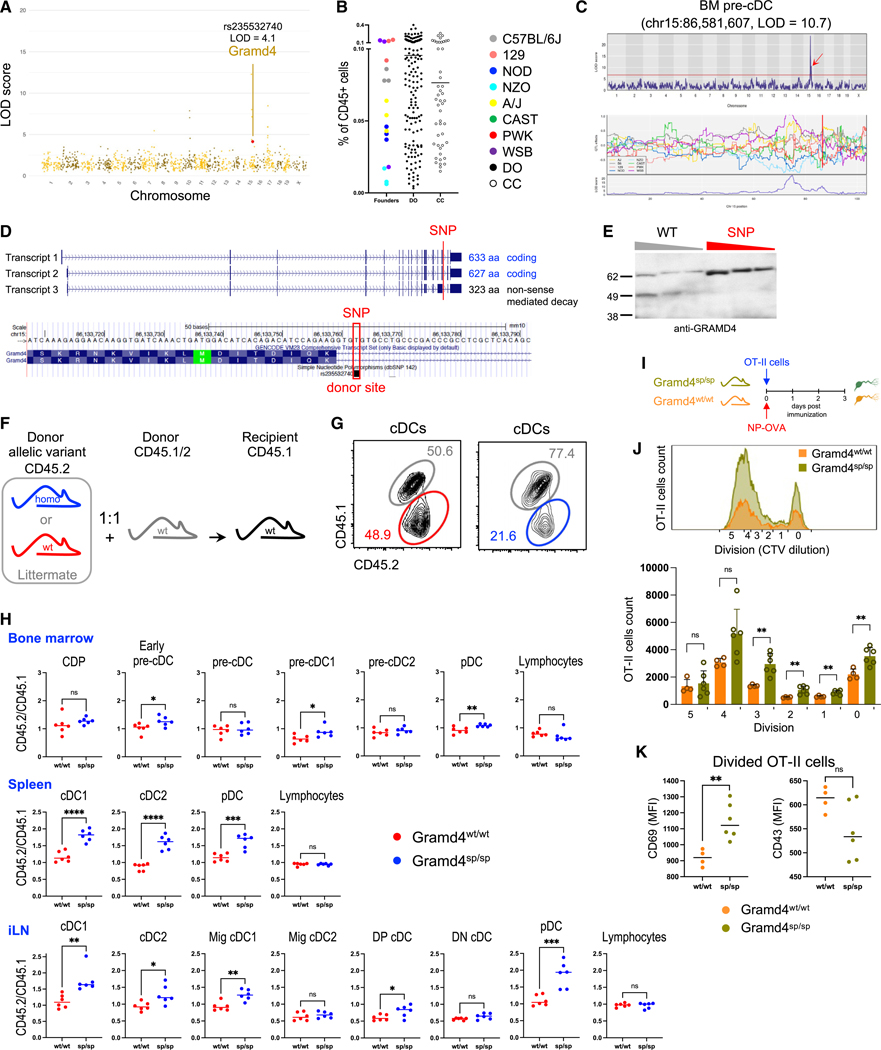
To explore the influence of genetics on homeostatic regulation of dendritic cell (DC) numbers, we present a screen of DCs and their progenitors in lymphoid and non-lymphoid tissues in Collaborative Cross (CC) and Diversity Outbred (DO) mice. We report 30 and 71 loci with logarithm of the odds (LOD) scores >8.18 and ranging from 6.67 to 8.19, respectively. The analysis reveals the highly polygenic and pleiotropic architecture of this complex trait, including many of the previously identified genetic regulators of DC development and maturation. Two SNPs in genes potentially underlying variation in DC homeostasis, a splice variant in Gramd4 (rs235532740) and a missense variant in Orai3 (rs216659754), are confirmed by gene editing using CRISPR-Cas9. Gramd4 is a central regulator of DC homeostasis that impacts the entire DC lineage, and Orai3 regulates cDC2 numbers in tissues. Overall, the data reveal a large number of candidate genes regulating DC homeostasis in vivo.

Keywords: CP: Immunology; Collaborative Cross; DCpoiesis; Diversity Outbred; QTL mapping; dendritic cell homeostasis; dendritic cell lineage; dendritic cell progenitors; dendritic cell subsets; immunogenetics; tissue distribution.


Conflict of interest statement

Declaration of interests The authors declare no competing interests.

Figures

Figure 1.
Figure 1.. CC and DO mice show DC frequency variation
(A) Variation in frequency of spleen cDC1, cDC2, and pDC in C57BL/6J (gray; n = 3), 129 (pink; n = 3), NOD (blue; n = 3), NZO (cyan; n = 3), A/J (yellow; n = 3), CAST (green; n = 3), PWK (red; n = 3), WSB (purple; n = 3), DO (black; n = 189), and CC-RI (open; n = 61) mice (see Figure S2A for frequencies of 49 immunophenotypes). (B) Non-lymphoid tissues show greater DC frequency variation than lymphoid tissues. Comparison of frequency variation along the lineage progression from BM committed progenitor to mature resident and migratory cDC1 and cDC2 as well as pDC across tissues (see Figure S2B for frequencies of 49 immunophenotypes). The gating strategy for DC progenitors and subsets identification in lymphoid and non-lymphoid tissues is shown in Figure S1. Populations included in cDC1 and cDC2 lineages are listed in Table S1. (C) Uniform Manifold Approximation and Projection (UMAP) analysis using 49 immunophenotypes shows great overall phenotypic diversity across the CC and DO mice.
Figure 2.
Figure 2.. DC subset composition is largely a function of the tissue site
(A) Distribution of DC progenitors and subsets across tissues (BM, spleen, inguinal LN, large intestine LN, small intestine LN, intestine, lung, kidney, and liver). Bar graph shows the percentage of the different BM progenitors (CDPs, early pre-cDCs, pre-cDCs, pre-cDC1s, and pre-cDC2s) as well as the composition of cDC1s, cDC2s, Mig cDC1s, Mig cDC2s, DP cDCs, DN cDCs, and pDCs across mouse tissues in the pool of DCs. Data are representative of C57BL/6J mice, with three mice per group. Number on the right is the percentage of total DC progenitors or subsets in CD45+ cells. (B) Pairwise Pearson correlations among 49 immunophenotypes in CC (n = 61) and DO (n = 189) mice ordered by tissue. Each block represents the correlation between two phenotypes. Correlation is based on between 217 and 250 paired observations, depending on phenotype (see Table S3). (C) Pairwise Pearson correlations for pDCs (9 immunophenotypes) (extracted from correlation heatmap in B) in CC (n = 61) and DO (n = 189) mice ordered by tissue. Each block represents the correlation between two phenotypes. Correlation is based on between 217 and 250 paired observations, depending on phenotype (see Table S3). iLN (inguinal LN), lintLN (large intestine LN), sintLN (small intestine LN).
Figure 3.
Figure 3.. High-resolution QTL mapping in the CC and DO mice
(A) QTL map for the 49 traits tested show 101 QTLs with an LOD score >6.67 spread throughout the genome. Each QTL is denoted by a vertical bar; color denotes the QTL distribution in the 95th percentile (red; LOD score >8.19), the 85th percentile (purple; LOD score >7.47), and the 62nd percentile (green; LOD score >6.67). (B) QTL distribution per tissue (BM, inguinal LN, spleen, large intestine LN, small intestine LN, kidney, lung, liver, and intestine). Red indicates QTLs in the 95th percentile, purple for QTLs in the 85th percentile, and green for QTLs in the 62nd percentile. The number in the inner circle indicates the total number of QTLs for each tissue. (C) Bar graph shows the number of QTLs for each of the traits tested. QTLs were identified in 44 of the 49 traits tested. (D) Heatmap showing the number of QTLs per tissue as well as the LOD score for each QTL in the cDC1, cDC2, and pDC lineages. Populations included in cDC1, cDC2, and pDC lineages are listed in Table S1. iLN (inguinal LN), lintLN (large intestine LN), sintLN (small intestine LN).
Figure 4.
Figure 4.. Genetic architecture of DC homeostasis complex trait
(A) Manhattan plot showing all mouse annotated SNPs. For each SNP, the best p value observed among all assessed traits is plotted on a –log10 scale (y axis), according to its genomic coordinates (x axis). (B) Pie chart show the proportion of associated SNPs identified in 44 phenotypes that map in intergenic (red), intron (purple), or coding/flanking/regulatory (lilac) regions as well as structural variants (orange). The number in the inner circle indicates the total number of associated SNPs. Violin plots show the LOD score distribution of SNPs in intergenic (n = 2,618), intron (n = 3,694), coding/flanking/regulatory (n = 2,283) regions, and structural variants (n = 150). (C) Bar graph showing the number of SNP-associated genes for each cell type: all genes (blue), genes with LOD >6 (red), genes with LOD >3 (orange), and genes with LOD >2 (green). (D) Heatmap showing trait-associated gene pleiotropy. Shading indicates the number of pleiotropic genes shared by two cell subsets. Colors depict the pleiotropic loci. (E) Violin plots showing the LOD score distribution of associated SNPs across tissues. (F) Violin plots showing the LOD score distribution of associated SNPs across cell type. (G) Distribution of coding/flanking regions and regulatory element variants identified in 44 phenotypes: ncRNA (blue), upstream (purple), 5′ UTR (cyan), downstream (red), 3′ UTR (orange), splice (yellow), synonymous (light green), and missense (green) variants. The violin plot shows LOD score distribution, and pie chart shows repartition. The number in the inner circle indicates the total number of associated SNPs. (H) Circos plot showing selected candidate genes. To narrow the search for candidate genes, we focused on coding/flanking variants that have an LOD score >2.5. Colors indicate the type of SNP variant: upstream (purple), downstream (red), 5′ UTR (cyan), 3′ UTR (orange), splice (yellow), and missense (green) variants. If a gene contains multiple SNPs, the type of SNP is displayed as a colored circle. See a list of selected candidate genes in Table S5. Importantly, DP cDCs are the major and more mature cDC2 subset in the small intestinal lamina propria; therefore, we included Mig DP cDCs and not Mig cDC2s in the analysis in Figures 4F and 4H (see Table S1). iLN (inguinal LN), lintLN (large intestine LN), sintLN (small intestine LN).
Figure 5.
Figure 5.. A QTL in chromosome 15 reveals Gramd4 as a central regulator of DC homeostasis
(A) Manhattan plot showing all splice variant SNPs across the 49 phenotypes. For each splice variant, the best p value observed among all assessed traits is plotted on a –log10 scale (y axis), according to its genomic coordinates (x axis). Gramd4 splice variant chosen for validation is highlighted in red. (B) Variation in frequency of BM pre-cDCs in C57BL/6J (gray; n = 3), 129 (pink; n = 3), NOD (blue; n = 3), NZO (cyan; n = 3), A/J (yellow; n = 3), WSB (purple; n = 3), DO (black; n = 170), and CC-RI (open; n = 47) mice. (C) A QTL driving the frequency of BM pre-cDCs found within chromosome 15 (chr15:86,581,607, LOD = 10.7) that appears to be driven by an A/J and NZO founder effect. (D) Gramd4 gene structure and schematic representation of alternative splicing (UCSC Genome Browser). SNP localization is shown in red. (E) Western blot on total splenocytes from Gramd4w/w and Gramd4sp/sp mice showing alternative splicing. (F) Schematic representation of mixed BM chimera experiment. (G) Representative flow cytometry plot for mixed BM experiment. (H) Frequencies of DC progenitors and subsets in mixed BM chimera mice due to differential expression of Gramd4 SNP variant in BM, spleen, and inguinal LN. Chimerism is expressed as the ratio between the number of CD45.2 and CD45.1/CD45.2 cells for each cell population. Representative of 2 independent experiments; each dot represents one mouse, n = 6 per group, Gramd4w/w (red) and Gramd4sp/sp (blue), and horizontal lines represent means. (I) Schematic representation of the experimental setup in (J) and (K). (J) Representative flow cytometry plot for OT-II CD4+ T cell activation (CTV dilution after immunization with OVA328–339 peptide in alum) in popliteal LN of Gramd4w/w and Gramd4sp/sp recipient mice. Graph shows the absolute numbers of OT-II cells in popliteal lymph nodes and the x axis the number of divisions after immunization. (K) CD69 and CD43 expression of divided OT-II T cells in popliteal LN of Gramd4w/w and Gramd4sp/sp recipient mice. Each dot represents one mouse, n = 6 per group, Gramd4w/w (orange) and Gramd4sp/sp (green), and horizontal lines represent means (J and K). Student’s t test, *p < 0.05, **p < 0.01, ***p < 0.001, ****p < 0.0001. iLN (inguinal LN).
Figure 6.
Figure 6.. Orai3 drives the frequency of migratory cDC2s
(A) Manhattan plot showing all missense variant SNPs across the 49 phenotypes. For each missense variant, the best p value observed among all assessed traits is plotted on a –log10 scale (y axis), according to its genomic coordinates (x axis). Orai3 missense variant chosen for validation is highlighted in red. (B) Variation in frequency of kidney Mig DP cDCs in C57BL/6J (gray; n = 3), 129 (pink; n = 3), NOD (blue; n = 3), NZO (cyan; n = 3), A/J (yellow; n = 3), PWK (red; n = 3), WSB (purple; n = 3), DO (black; n = 181), and CC-RI (open; n = 59) mice. (C) A QTL driving the frequency of kidney Mig DP cDCs found within chromosome 7 (chr7:127,953,525, LOD = 10.0) driven largely by a CAST founder effect. (D) Orai3 gene structure and schematic representation of alternative transcript (UCSC Genome Browser). SNP localization is shown in red. (E) Frequencies of DC progenitors and subsets in mixed BM chimera mice due to differential expression of Orai3 SNP variant in BM, spleen, and inguinal LN. Chimerism is expressed as the ratio between the number of CD45.2 and CD45.1/CD45.2 cells for each cell population. See schematic representation of the experimental setup in Figures 5F and 5G. Representative of 2 independent experiments; each circle represents one mouse, n = 6 per group, Orai3w/w (red) and Orai3snp/snp (blue), and horizontal lines represent means. (F) Representative flow cytometry plot for OT-II CD4+ T cell activation (CTV dilution after immunization with OVA328–339 peptide in alum) in popliteal LN of Orai3w/w and Orai3sp/sp recipient mice. Graph shows the absolute numbers of OT-II cells in popliteal lymph nodes and the x axis the number of divisions after immunization. See schematic representation of the experimental setup in Figure 5I. (G) Plots show the ratio of fully divided (division 5) to undivided (division 0) OT-II cells in popliteal LN of Orai3w/w and Orai3sp/sp recipient mice. Each dot represents one mouse, n = 6 per group, Orai3w/w (orange) and Orai3sp/sp (green), and horizontal lines represent means (F and G). Student’s t test, *p < 0.05, **p < 0.01, ***p < 0.001, ****p < 0.0001. iLN (inguinal LN).

Similar articles

Cited by

References

    1. Cabeza-Cabrerizo M, Cardoso A, Minutti CM, Pereira da Costa M, and Reis e Sousa C. (2021). Dendritic Cells Revisited. Annu. Rev. Immunol 39, 131–166. 10.1146/annurev-immunol-061020-053707. - DOI - PubMed
    1. Durai V, and Murphy KM (2016). Functions of Murine Dendritic Cells. Immunity 45, 719–736. - PMC - PubMed
    1. Merad M, Sathe P, Helft J, Miller J, and Mortha A. (2013). The dendritic cell lineage: ontogeny and function of dendritic cells and their subsets in the steady state and the inflamed setting. Annu. Rev. Immunol 31, 563–604. - PMC - PubMed
    1. Steinman RM, Bonifaz L, Fujii S.i., Liu K, Bonnyay D, Yamazaki S, Pack M, Hawiger D, Iyoda T, Inaba K, and Nussenzweig MC (2005). The innate functions of dendritic cells in peripheral lymphoid tissues. Adv. Exp. Med. Biol 560, 83–97. 10.1007/0-387-24180-9_12. - DOI - PubMed
    1. Banchereau J, and Steinman RM (1998). Dendritic cells and the control of immunity. Nature 392, 245–252. 10.1038/32588. - DOI - PubMed

Publication types

LinkOut - more resources