. 2024 Jun:104:105170.
doi: 10.1016/j.ebiom.2024.105170. Epub 2024 Jun 1.

Ebola virus-induced eye sequelae: a murine model for evaluating glycoprotein-targeting therapeutics

Affiliations

Ebola virus-induced eye sequelae: a murine model for evaluating glycoprotein-targeting therapeutics

Ha-Na Lee et al. EBioMedicine. 2024 Jun.

Abstract

Background: Ebola virus disease (EVD) survivors experience ocular sequelae including retinal lesions, cataracts, and vision loss. While monoclonal antibodies targeting the Ebola virus glycoprotein (EBOV-GP) have shown promise in improving prognosis, their effectiveness in mitigating ocular sequelae remains uncertain.

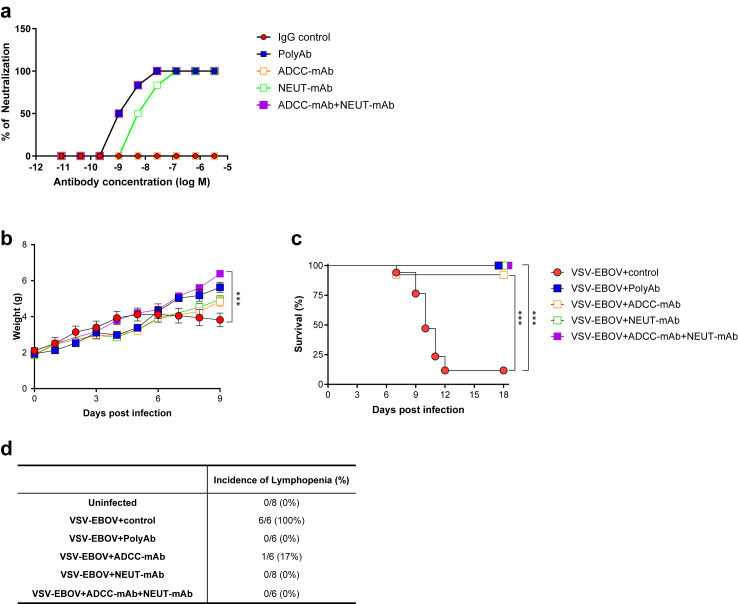
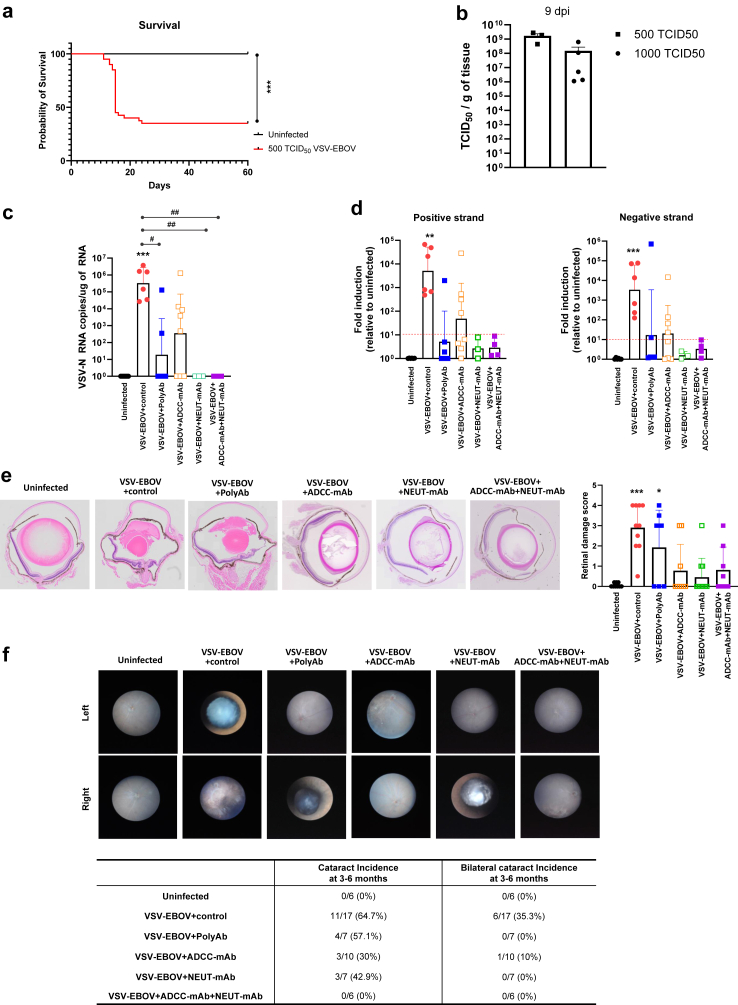
Methods: We developed and characterized a BSL-2-compatible immunocompetent mouse model to evaluate therapeutics targeting EBOV-GP by inoculating neonatal mice with vesicular stomatitis virus expressing EBOV-GP (VSV-EBOV). To examine the impact of anti-EBOV-GP antibody treatment on acute retinitis and ocular sequelae, VSV-EBOV-infected mice were treated with polyclonal antibodies or monoclonal antibody preparations with antibody-dependent cellular cytotoxicity (ADCC-mAb) or neutralizing activity (NEUT-mAb).

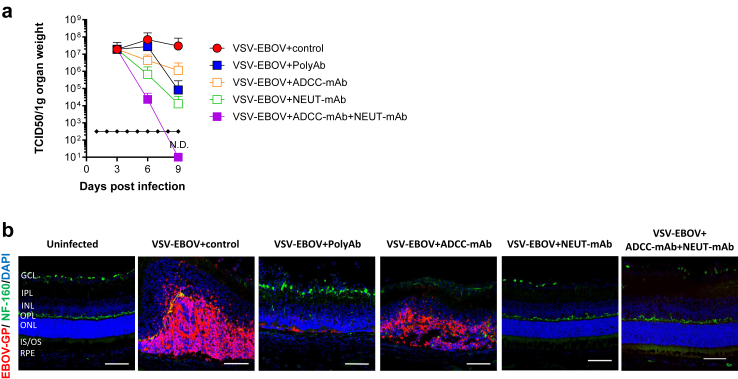
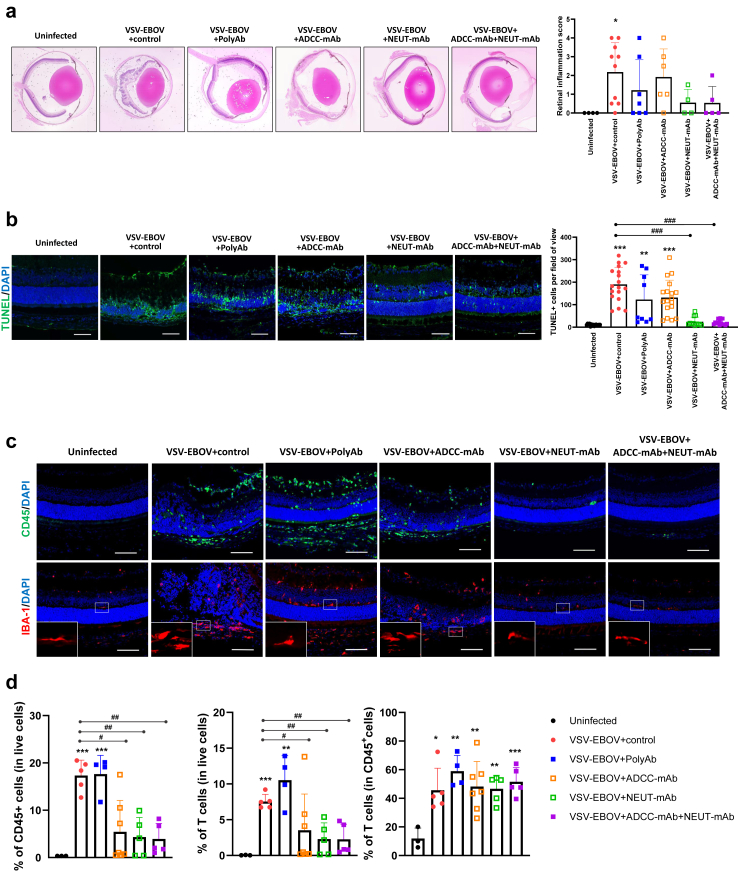
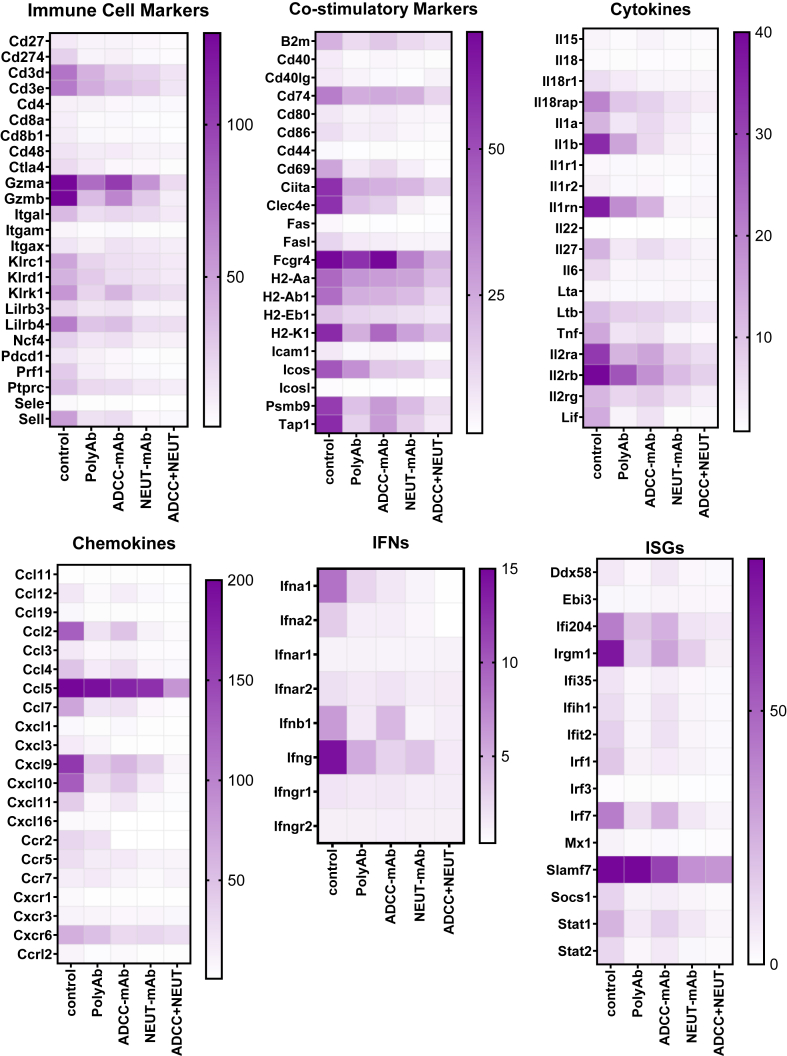
Findings: Treatment with all anti-EBOV-GP antibodies tested dramatically reduced viremia and improved survival. Further, all treatments reduced the incidence of cataracts. However, NEUT-mAb alone or in combination with ADCC-mAb reduced viral load in the eyes, downregulated the ocular immune and inflammatory responses, and minimized retinal damage more effectively.

Interpretation: Anti-EBOV-GP antibodies can improve survival among EVD patients, but improved therapeutics are needed to reduce life altering sequelae. This animal model offers a new platform to examine the acute and long-term effect of the virus in the eye and the relative impact of therapeutic candidates targeting EBOV-GP. Results indicate that even antibodies that improve systemic viral clearance and survival can differ in their capacity to reduce acute ocular inflammation, and long-term retinal pathology and corneal degeneration.

Funding: This study was partly supported by Postgraduate Research Fellowship Awards from ORISE through an interagency agreement between the US DOE and the US FDA.

Keywords: Anti-EBOV-GP antibodies; BSL-2 model; EBOV glycoprotein (EBOV-GP); EBOV-GP pseudotyped vesicular stomatitis virus (VSV-EBOV); Ebola virus (EBOV); Ocular sequelae; Retinitis.


Conflict of interest statement

Declaration of interests All authors have read and confirmed the manuscript and accepted the responsibility to submit it for publication. The authors declare that they have no known competing financial interests or personal relationships that could have appeared to influence the work reported in this paper.

Figures

Fig. 1
Fig. 1
Therapeutic effects of anti-EBOV-GP antibodies on weight change, survival and lymphopenia in VSV-EBOV-infected mice. (a) Virus neutralization by antibodies: SAB-139 (polyAb), REGN3478 (ADCC-mAb), and REGN3481 (NEUT-mAb) or the combination of ADCC-mAb and NEUT-mAb using VERO E6 cells infected with replicating VSV-EBOV (MOI 0.1). Data are representative of three independent experiments. (bd) P3 C57BL/6 mice were subcutaneously (s.c.) infected with 1000 TCID50 of VSV-EBOV and intraperitoneally (i.p.) treated with human IgG isotype controls (IgG control; 100 mg/kg, (b) n = 9, (c) n = 17, or (d) n = 6, respectively), polyAb (100 mg/kg, (b) n = 3, (c) n = 12, or (d) n = 6), ADCC-mAb (100 mg/kg, (b) n = 10, (c) n = 13, or (d) n = 6), NEUT-mAb (100 mg/kg, (b) n = 8, (c) n = 12, or (d) n = 8) or the combination of ADCC-mAb and NEUT-mAb (50 mg/kg, each, (b) n = 11, (c) n = 10, or (d) n = 6) at 3 dpi. Mice were monitored for weight changes (b) and survival (c). Data are shown as mean ± standard deviation (SD). Statistical significance was determined using a two-way ANOVA (mixed-effects model with the Geisser-Greenhouse correction) (b) and the log-rank test (c), respectively. ∗∗∗P < 0.001 compared to infected mice treated with IgG control. (d) Hematological assessment at 9 dpi. Table shows incidence of lymphopenia by 9 dpi.
Fig. 2
Fig. 2
Viral burden in the eyes of VSV-EBOV-infected mice treated with anti-EBOV-GP antibodies. P3 C57BL/6 mice were infected s.c. with 1000 TCID50 of VSV-EBOV and treated IgG control (100 mg/kg, (a) n = 5 or (b) n = 6), polyAb (100 mg/kg, (a) n = 6 or (b) n = 3), ADCC-mAb (100 mg/kg, (a) n = 3 or (b) n = 6), NEUT-mAb (100 mg/kg, (a) n = 3 or (b) n = 4) or the combination of ADCC-mAb and NEUT-mAb (50 mg/kg, each, (a) n = 3 or (b) n = 5) at 3 dpi. (a) Viral loads in the eyes of mice were evaluated by TCID50 at 3, 6 and 9 dpi. Data are shown as mean + SD. N.D., not detectable. (b) Viral antigen in the eyes of uninfected mice (n = 5) and VSV-EBOV-infected mice treated as above at 3 dpi and sacrificed at 9 dpi. The images show representative immunofluorescence images of eye sections stained for EBOV-GP antigen (red), NF-160 (green) and DAPI (blue). Scale bar: 50 μm. GCL, ganglion cell layer; IPL, inner plexiform layer; INL, inner nuclear layer; OPL, outer plexiform layer; ONL, outer nuclear layer; IS/OS, inner/outer segment junction; RPE, retinal pigment epithelium. Images of the full eye can be found in Supplementary Figure S6.
Fig. 3
Fig. 3
Therapeutic effects of anti-EBOV-GP antibodies on acute retinal inflammation in VSV-EBOV-infected mice. P3 C57BL/6 mice were infected, treated as above at 3 dpi, and sacrificed at 9 dpi. (a) Histopathology of the eyes of uninfected mice (n = 4) and VSV-EBOV-infected treated with IgG control (n = 10), polyAb (n = 7), ADCC-mAb (n = 6), NEUT-mAb (n = 4) or the combination of ADCC-mAb and NEUT-mAb (n = 5). Left images show representative H&E staining of eyes. Right graph shows the retinal inflammation score. Data are shown as mean + SD. (b) Left images show representative immunofluorescence staining for TUNEL (green) and DAPI (blue) in eye sections from uninfected mice (n = 5) and VSV-EBOV-infected mice treated with IgG control (n = 6), polyAb (n = 3), ADCC-mAb (n = 6), NEUT-mAb (n = 4) or the combination of ADCC-mAb and NEUT-mAb (n = 5). Scale bar: 50 μm. Images of the full eye can be found in Supplementary Figure 6. Right graph shows the quantification of TUNEL + cells per field of view (3 fields per eye section). Data are shown as mean + S.D. (n = 9–18 fields for each group). (c) The images show representative immunofluorescence staining for CD45 (green), IBA (red) and DAPI (blue) in eye sections from uninfected mice (n = 5) and VSV-EBOV-infected mice treated with IgG control (n = 6), polyAb (n = 3), ADCC-mAb (n = 6), NEUT-mAb (n = 4) or the combination of ADCC-mAb and NEUT-mAb (n = 5). The bottom close-up images show representative microglia morphology observed in eyes. Scale bar: 50 μm. Images of the full eye can be found in Supplementary Figure S6. (d) Flow cytometry analysis of cells isolated from the eyes collected at 9 dpi. The graphs show the percentage of infiltrating immune cells (CD45+) and T cells (CD45+CD3+NK1.1) in the eyes from uninfected mice (n = 3) and VSV-EBOV-infected mice treated with IgG control (n = 5), polyAb (n = 4), ADCC-mAb (n = 7), NEUT-mAb (n = 5) or the combination of ADCC-mAb and NEUT-mAb (n = 5). Data are shown as mean + SD. ∗P < 0.05, ∗∗P < 0.01, ∗∗∗P < 0.001 compared to uninfected mice. #P < 0.05 and ##P < 0.01 compared to VSV-EBOV-infected mice treated with IgG control.
Fig. 4
Fig. 4
Pattern of inflammation in the eyes of VSV-EBOV-infected mice treated with IgG control or anti-EBOV-GP-antibodies. Heat map of mRNA expression genes selected from a 591 gene array in the eyes at 9 dpi from VSV-EBOV-infected mice treated with IgG control (n = 8), polyAb (n = 7), ADCC-mAb (n = 3), NEUT-mAb (n = 3) or the combination of ADCC-mAb and NEUT-mAb (n = 3). RNA expression was assessed by NanoString using the nCounter mouse Immunology panel. Expression levels were normalized to the mean value of the uninfected group (n = 3). Results from the full gene array can be found in Supplementary Figure S7.
Fig. 5
Fig. 5
Sequelae of VSV-EBOV-infected mice treated with IgG control or anti-EBOV-GP antibodies. (a and b) P3 neonatal mice were uninfected (n = 19) or infected s.c. with 500 TCID50 of VSV-EBOV (n = 42) and monitored for survival (a) for 60 days. Statistical significance was determined using the log-rank test. ∗∗∗P < 0.001 compared to uninfected mice. (b) Comparison of viral load in the eyes from mice challenged with 500 TCID50 (n = 3) or 1000 TCID50 (n = 5) of VSV-EBOV by TCID50 analysis at 9 dpi. Data are shown as mean + SD. (cf) P3 C57BL/6 mice were uninfected (n = 8) or infected with 500 TCID50 of VSV-EBOV and treated with IgG control (n = 6), polyAb (n = 6), ADCC-mAb (n = 8), NEUT-mAb (n = 3) or the combination of ADCC-mAb and NEUT-mAb (n = 4) at 3 dpi, and sacrificed at 3–6 months post infection (mpi). RNA from eyes of uninfected and convalescent mice was tested for the expression of VSV-N (c), VSV-EBOV-positive sense RNA (d, left) and VSV-EBOV-negative sense RNA (d, right) in the eyes. Ct values normalized to housekeeping gene (GAPDH). Data are shown as mean + SD. The red dashed lines indicate the limit of detection. (e) Histopathology of the eyes at 3–6 mpi. Left images show representative H&E staining of eyes from uninfected mice (n = 9) and VSV-EBOV-infected mice treated with IgG control (n = 10), polyAb (n = 7), ADCC-mAb (n = 9), NEUT-mAb (n = 11) or the combination of ADCC-mAb and NEUT-mAb (n = 8). Right graph shows the retinal inflammation score. Data are shown as mean + SD. (f) Fundus images of the eyes showing cataract development at 3–6 mpi. Right table shows cataract incidence by eyes.

Similar articles

Cited by

References

    1. Murray M.J. Ebola virus disease: a review of its past and present. Anesth Analg. 2015;121(3):798–809. - PubMed
    1. Kadanali A., Karagoz G. An overview of Ebola virus disease. North Clin Istanb. 2015;2(1):81–86. - PMC - PubMed
    1. Gao J.W., Guo Z.Y., Li W., Zhang X.W., Zhang X.E., Cui Z.Q. Ebola virus disrupts the inner blood-retinal barrier by induction of vascular endothelial growth factor in pericytes. PLoS Pathog. 2023;19(1) - PMC - PubMed
    1. Feldmann H., Geisbert T.W. Ebola haemorrhagic fever. Lancet. 2011;377(9768):849–862. - PMC - PubMed
    1. Leligdowicz A., Fischer W.A., 2nd, Uyeki T.M., et al. Ebola virus disease and critical illness. Crit Care. 2016;20(1):217. - PMC - PubMed

MeSH terms