. 2024 Jun;103(2):151424.
doi: 10.1016/j.ejcb.2024.151424. Epub 2024 May 25.

Targeting F-actin stress fibers to suppress the dedifferentiated phenotype in chondrocytes

Affiliations

Targeting F-actin stress fibers to suppress the dedifferentiated phenotype in chondrocytes

Mandy M Schofield et al. Eur J Cell Biol. 2024 Jun.

Abstract

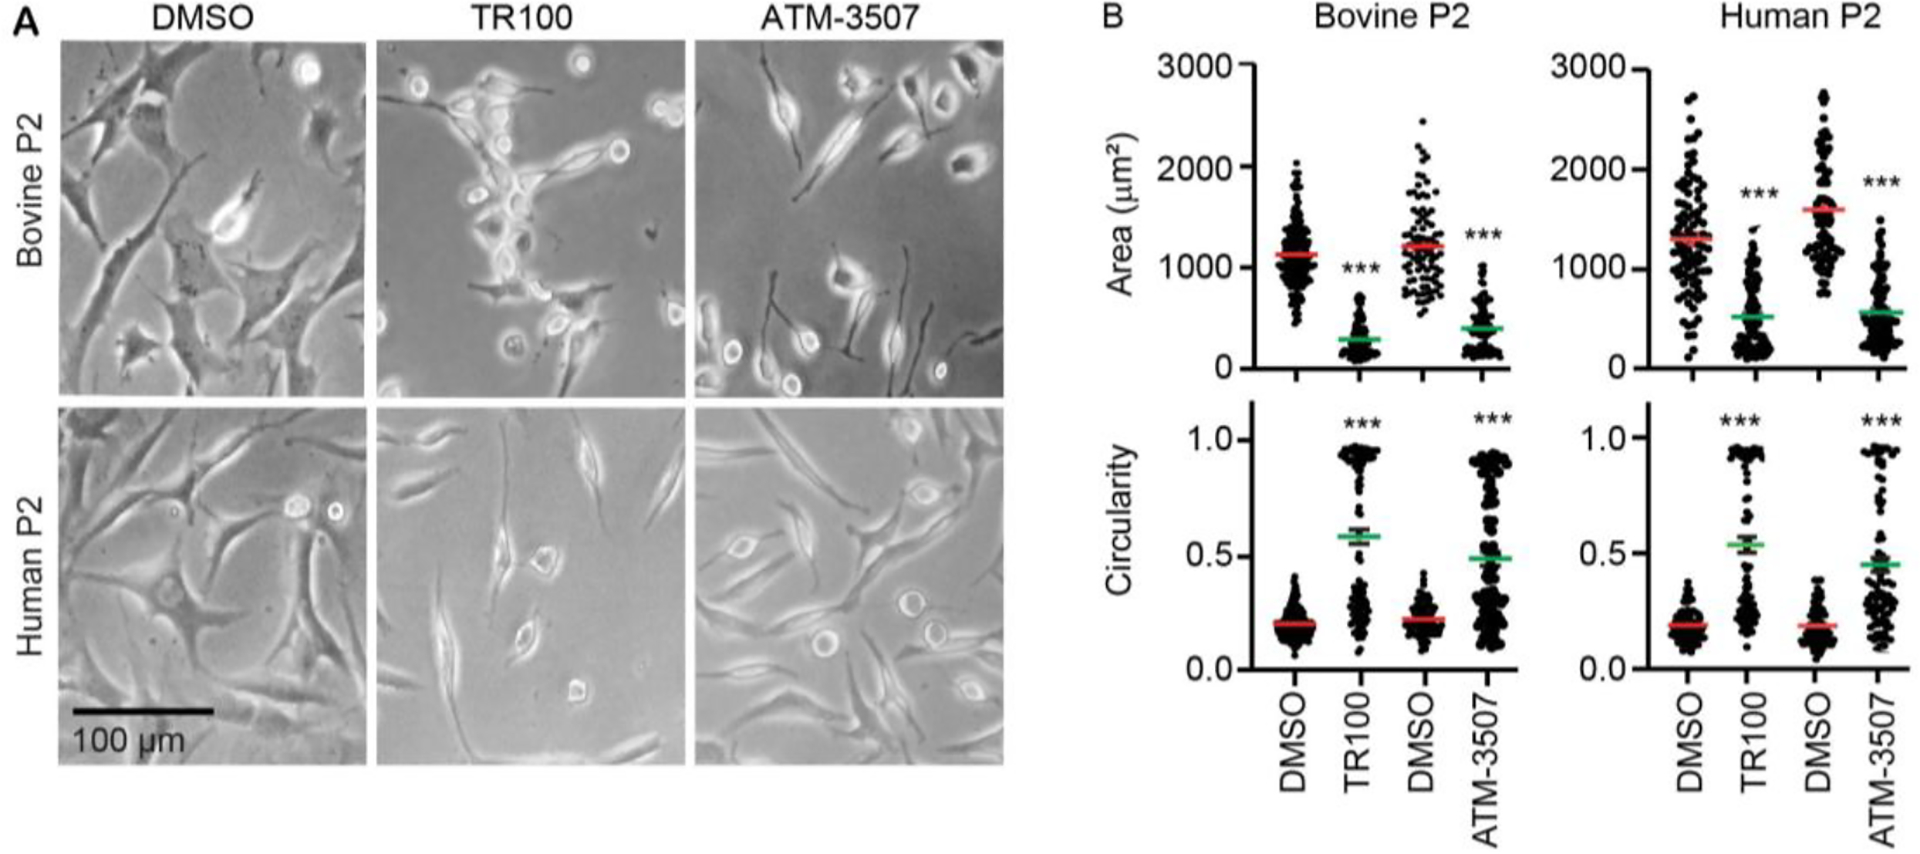
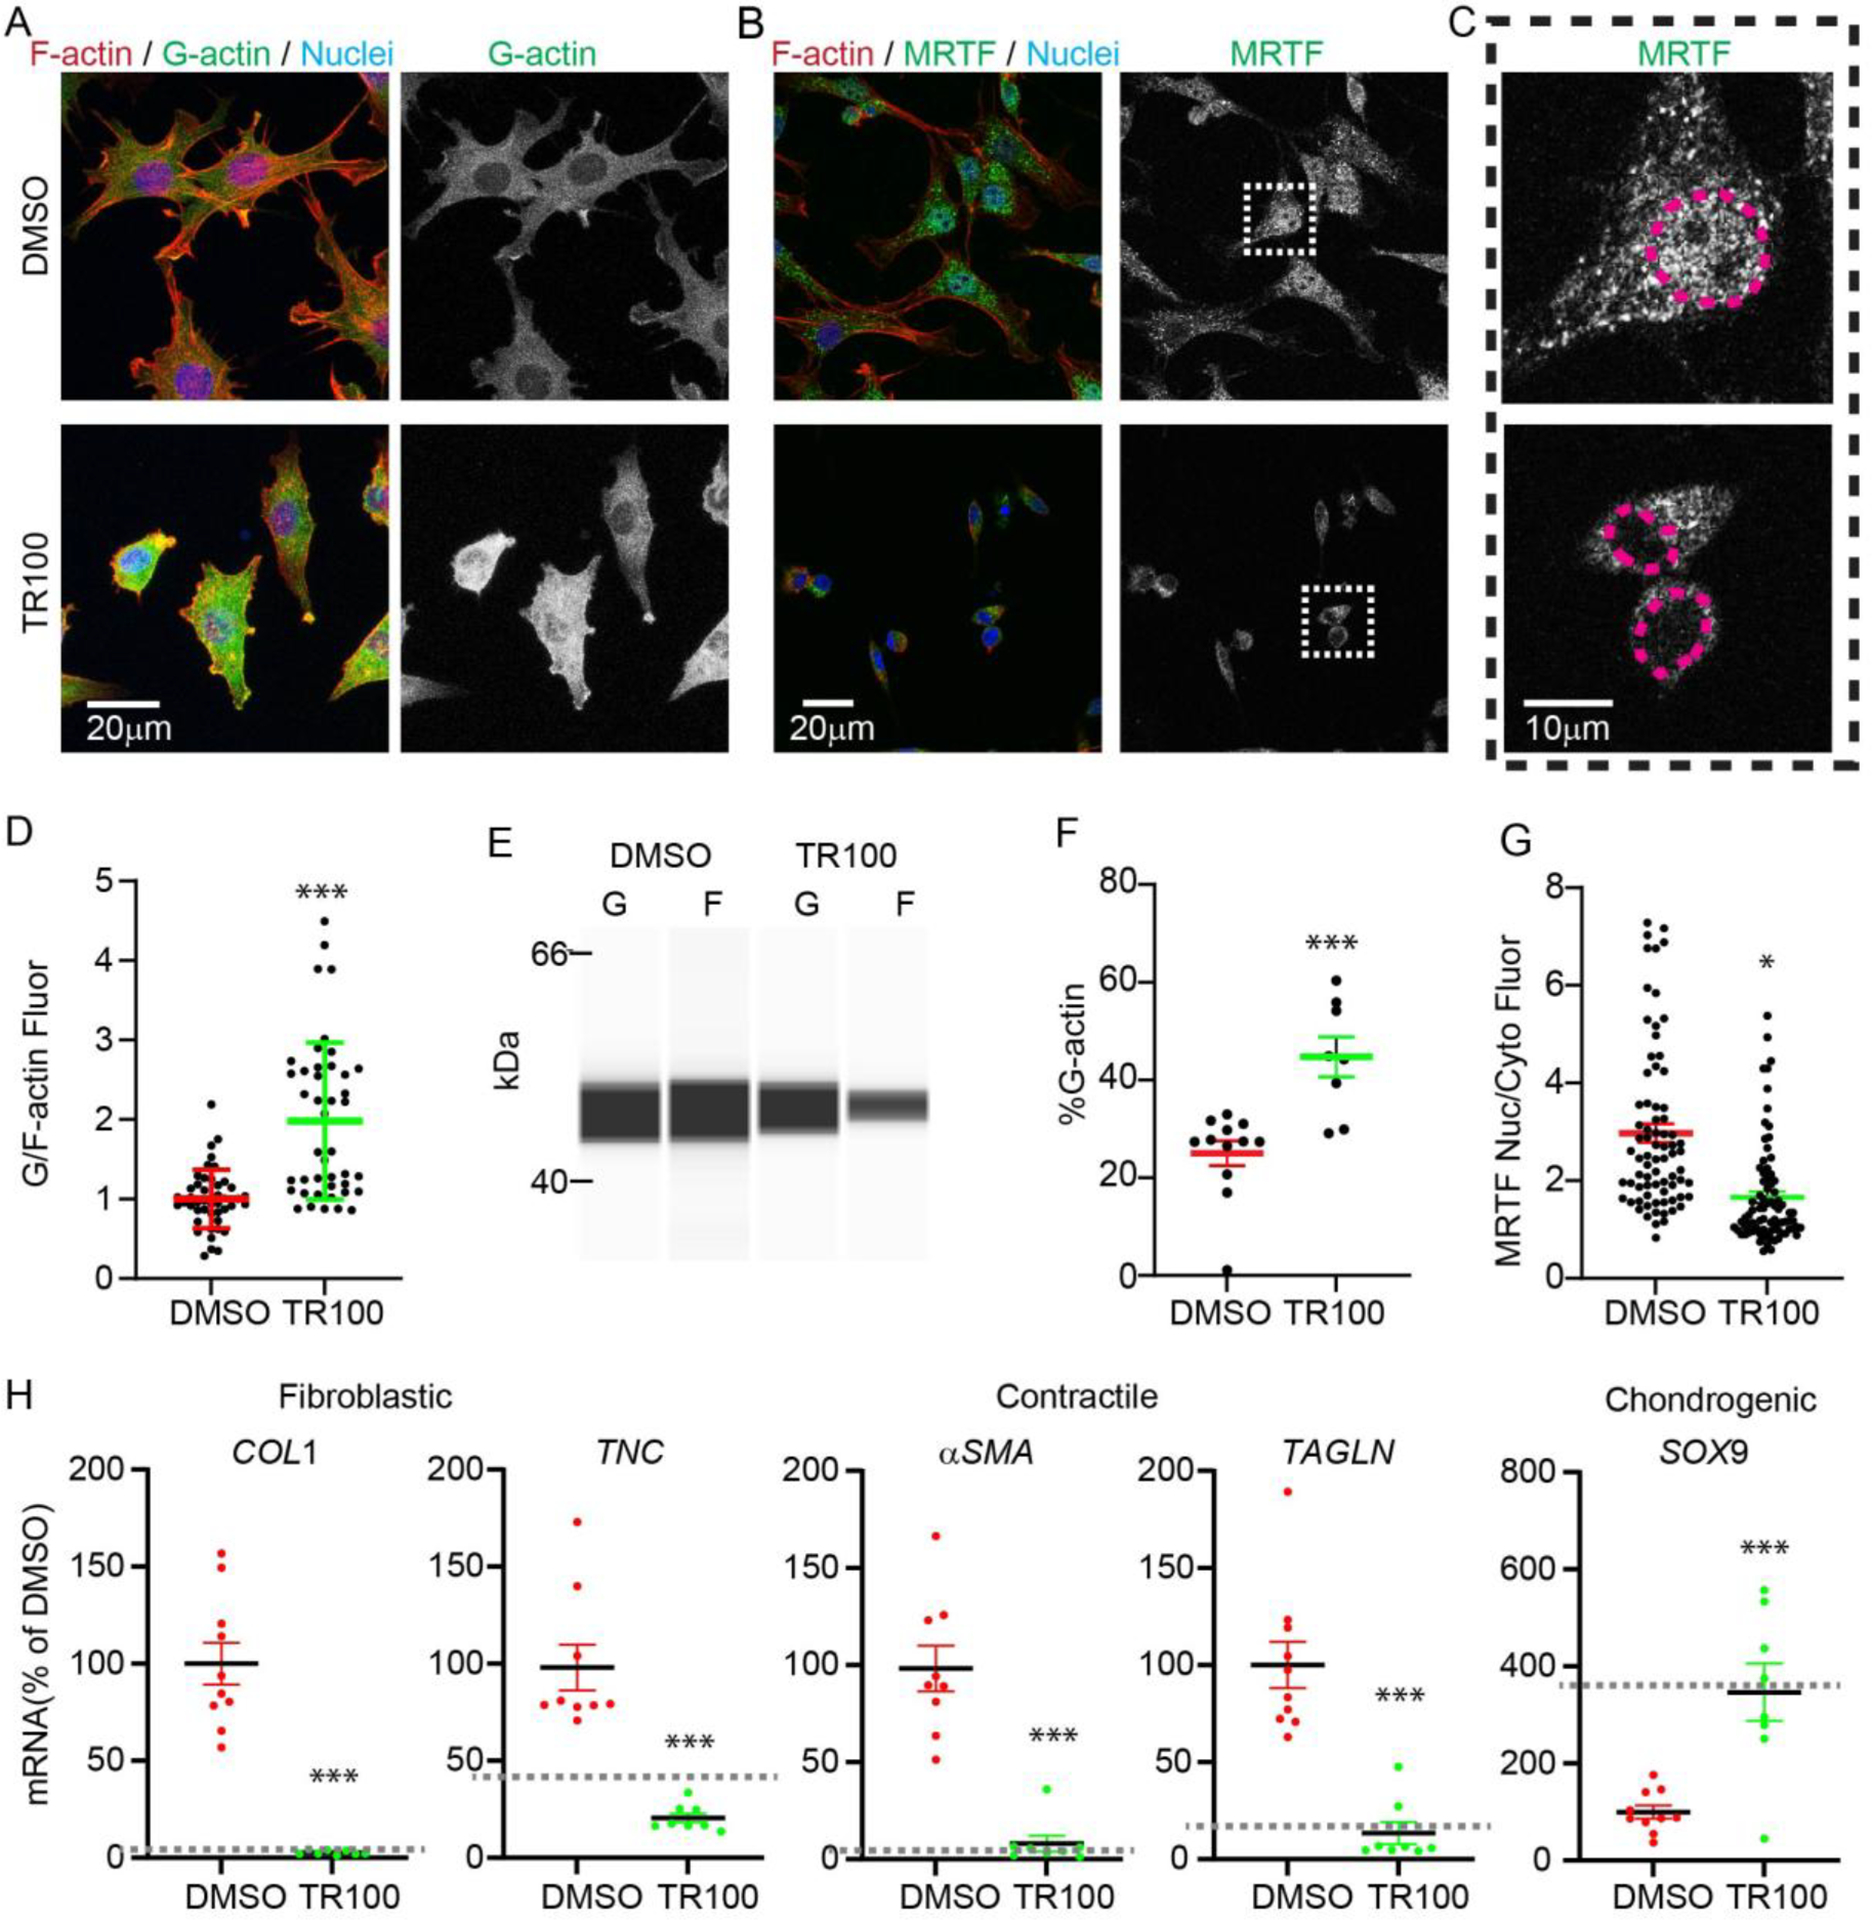
Actin is a central mediator of the chondrocyte phenotype. Monolayer expansion of articular chondrocytes on tissue culture polystyrene, for cell-based repair therapies, leads to chondrocyte dedifferentiation. During dedifferentiation, chondrocytes spread and filamentous (F-)actin reorganizes from a cortical to a stress fiber arrangement causing a reduction in cartilage matrix expression and an increase in fibroblastic matrix and contractile molecule expression. While the downstream mechanisms regulating chondrocyte molecular expression by alterations in F-actin organization have become elucidated, the critical upstream regulators of F-actin networks in chondrocytes are not completely known. Tropomyosin (TPM) and the RhoGTPases are known regulators of F-actin networks. The main purpose of this study is to elucidate the regulation of passaged chondrocyte F-actin stress fiber networks and cell phenotype by the specific TPM, TPM3.1, and the RhoGTPase, CDC42. Our results demonstrated that TPM3.1 associates with cortical F-actin and stress fiber F-actin in primary and passaged chondrocytes, respectively. In passaged cells, we found that pharmacological TPM3.1 inhibition or siRNA knockdown causes F-actin reorganization from stress fibers back to cortical F-actin and causes an increase in G/F-actin. CDC42 inhibition also causes formation of cortical F-actin. However, pharmacological CDC42 inhibition, but not TPM3.1 inhibition, leads to the re-association of TPM3.1 with cortical F-actin. Both TPM3.1 and CDC42 inhibition, as well as TPM3.1 knockdown, reduces nuclear localization of myocardin related transcription factor, which suppresses dedifferentiated molecule expression. We confirmed that TPM3.1 or CDC42 inhibition partially redifferentiates passaged cells by reducing fibroblast matrix and contractile expression, and increasing chondrogenic SOX9 expression. A further understanding on the regulation of F-actin in passaged cells may lead into new insights to stimulate cartilage matrix expression in cells for regenerative therapies.

Keywords: Actin; CDC42; Chondrocytes; Dedifferentiation; MRTF; Stress fibers; TPM3.1; cortical actin.


Conflict of interest statement

Declaration of Competing Interest None

Figures

Figure 1.
Figure 1.. Tpm3.1 associates with F-actin in bovine and human chondrocytes.
(A) Lower magnification (20x objective) maximum intensity projection of cells 2 days after seeding onto glass dishes. (B) Higher magnification (63x objective) single optical section images of cells (blue dashed boxes) in panel A showing association of Tpm3.1 with cortical (P0 chondrocytes) and stress fiber F-actin (P2 chondrocytes). (C) Line scan analysis of lines (pink dashed) in panel B, demonstrating colocalization of Tpm3.1 with F-actin. (D) Zoomed in Airyscan high magnification (63x objective) image of regions (grey dashed boxes) in panel B shows that Tpm3.1 is organized in microdomains along F-actin. Cells stained for F-actin (Phalloidin; Red), Tpm3.1 (Antibody 2G10.2; Green), and Nuclei (Hoechst; Blue).
Figure 2.
Figure 2.. TPM3.1 inhibition leads to a change in cell morphology in bovine and human P2 cells.
(A) Light microscopy images of bovine and human chondrocytes treated with pharmacological TPM3.1 inhibitors, TR100 and ATM3507, for 1 day. (B) Quantification of light microscopy images showing that Tpm 3.1 inhibition decreases cell area and elongation in bovine (left) and human (right) P2 chondrocytes. ***, p < 0.001 as compared to DMSO control.
Figure 3.
Figure 3.. TPM3.1 inhibition ablates F-actin stress fibers and promotes cortical F-actin organization in bovine P2 cells.
(A) Lower magnification (20x objective) confocal microscopy images of bovine P2 cells treated with pharmacological TPM3.1 inhibitors, TR100 or ATM3507, for 1 day. (B) Higher magnification (63x objective) of regions in A (white dashed boxes) showing TR100 treatment in bovine cells leads to a cortical actin rearrangement. Cells stained for F-actin (Phalloidin; Red), TPM3.1 (Antibody 2G10.2; Green), and Nuclei (Hoechst; Blue). (C) Line scan analysis of lines (pink dashed) in panel B, demonstrating TR100 or ATM3507 treatment decreases colocalization between TPM3.1 with F-actin as compared to DMSO control. There is also less cortical TPM3.1 as compared to P0 cells
Figure 4.
Figure 4.. TPM3.1 inhibition by TR100 treatment partially redifferentiates bovine P2 cells by reducing actin polymerization, nuclear MRTF, and dedifferentiated mRNA levels.
(A) Images (40x objective) of bovine P2 cells treated with Tpm3.1 pharmacological inhibitor TR100 for 6 hours. Cells were stained for F-actin (Phalloidin; Red), G-actin (Vitamin D binding protein-AlexaFluor488 conjugate; Green), and Nuclei (Hoechst; Blue). (B) Images (20x objective) of cells treated with TR100 for 1 day. Cells were stained for F-actin (Phalloidin; Red), MRTF (Green), and Nuclei (Hoechst; Blue). (C) Higher magnification images (63x objective) of cells in ‘B’ (white dashed boxes). Pink dashed tracings indicate nuclei borders. (D) Corresponding dot-plot of calculated G/F-actin fluorescence in cells treated with TR100 (as shown in ‘A’). (E) Capillary Western blot (WES) immunoassay pseudoblot of Triton-fractionated samples for separation of G/F-actin after 6 hours of treatment with TR100. (F) Corresponding dot plot showing the increase in the proportion of G/F-actin in cells treated with TR100. (G) Corresponding dot plot of MRTF subcellular localization demonstrating a reduction in nuclear MRTF by TR100 treatment (as shown in ‘B’ and ‘C’). (H) Relative real-time PCR of cells treated with TR100 demonstrating a reduction in fibroblastic and contractile genes as well as an increase in SOX9 mRNA levels. *, p < 0.05; **, p < 0.01; ***, p < 0.001 as compared to DMSO treatment. Grey dashed lines in ‘H’ represent primary (P0) bovine chondrocyte mRNA levels for genes based on our previous studies (Parreno et al., 2017a; Parreno et al., 2014; Parreno et al., 2017b)
Figure 5.
Figure 5.. siRNA knockdown of TPM3.1 in bovine P2 chondrocytes alters cellular morphology.
(A) Light microscopy images of bovine chondrocytes transfected with non-targeting or TPM3.1 siRNA (siTPM3.1) for 4 day. Images quantification shows that Tpm3.1 knockdown decreases (B) cell area and (C) elongation. (D) Images of cells (using 40x objective) stained for F-actin (Phalloidin; Red), TPM3.1 (Green), and Nuclei (Hoechst; Blue) demonstrated a reduction in TPM3.1 immunofluorescence as well as less stress fibers. (E) Relative real-time PCR of cells demonstrates a reduction in TPM3. (F) TPM3.1 protein is reduced as supported by a reduction in overall TPM3.1 immunofluorescence. ***, p < 0.001 as compared to DMSO control.
Figure 6.
Figure 6.. siRNA knockdown of TPM3.1 alters F-actin polymerization, MRTF localization, and gene expression in bovine P2 cells.
(A) Images (40x objective) of bovine P2 cells transfected with TPM3.1 siRNA (siTPM3.1) for 4 days. Cells were stained for F-actin (Phalloidin; Red), G-actin (Vitamind D binding protein; Green), and Nuclei (Hoechst; Blue). (B) Corresponding dot-plot of calculated G/F-actin fluorescence in cells treated with siTPM3.1 (as shown in ‘A’). (C) Images (40x objective) of cells treated with TR100 for 1 day. Cells were stained for F-actin (Phalloidin; Red), MRTF (Green), and Nuclei (Hoechst; Blue). (D) Corresponding dot plot of MRTF subcellular localization demonstrating a reduction in nuclear MRTF by TR100 treatment (as shown in ‘C’). (F) Relative real-time PCR of cells treated with TR100 demonstrating a reduction in contractile genes as well as an increase in SOX9 mRNA levels. *, p < 0.05; ***, p < 0.001 as compared to DMSO treatment. Grey dashed lines in ‘E’ represent primary (P0) bovine chondrocyte mRNA levels for genes based on our previous studies (Parreno et al., 2017a; Parreno et al., 2014; Parreno et al., 2017b).
Figure 7.
Figure 7.. Modulation of select human P2 cell protein levels by TR100 treatment after 2 days of treatment.
Representative WES capillary electrophoresis data showing representative (A) electropherograms and (B) pseudo-Western blots. Specific protein levels were normalized to total protein (TP) levels. (C) Corresponding dot plots of relative protein levels. Data demonstrates a decrease in fibroblast matrix (COL1) and contractile (TAGLN) protein levels as well as an increase in chondrogenic (SOX9) protein levels. *, p < 0.05 as compared to DMSO
Figure 8.
Figure 8.. The effect of RhoGTPase inhibition on cell morphology of (A-C) bovine and (D-F) human P2 cells.
(A) Light microscopy images of bovine chondrocytes exposed to the CDC42, ROCK, RAC inhibitors ML141 (CDC42i), Y27632 (ROCKi), and NSC23766 (RACi), respectively for 1 day. (B) Traces of cells from time-lapse in incubator imaging. (C) Quantification of light microscopy images showing that CDC42i decreases cell area and increases average cell circularity. Of note CDC42i led to bimodal distribution in cell circularity where a subpopulation of cells were smaller but remained elongated. Arrows in A and traces in B show both representative rounded and elongated cells. (D) Light microscopy of human P2 cells exposed to CDC42i for 1 day. Quantification of light microscopy images showing that CDC42i (E) decreases cell area and (F) increases average cell circularity.
Figure 9.
Figure 9.. CDC42 inhibition by exposure of bovine P2 cells to pharmacological inhibitor ML141 leads to partial redifferentiation of bovine P2 cells by reducing F-actin stress fibers, nuclear MRTF, and dedifferentiated mRNA levels.
(A) Images (63x objective) of cells treated with ML141 (CDC42i) for 1 day and stained for F-actin (Phalloidin; Red), Tpm3.1 (Green) and Nuclei (Hoechst; Blue). (B) Images (40x objective) of cells stained for F-actin (Phalloidin; Red), G-actin (Vitamind D binding protein; Green), and Nuclei (Hoechst; Blue). (C) Images 63x objective of cells stained for F-actin (Phalloidin; red), MRTF (Green), and Nuclei (Hoechst; Blue). (D) Capillary Western blot (WES) immunoassay pseudoblot of Triton-fractionated samples for separation of G/F-actin. (E) Corresponding dot plot of WES data, as shown in ‘D’, showing the increase in the proportion of G/F-actin in cells treated with ML141. (F) Corresponding dot plot of MRTF subcellular localization demonstrating a reduction in nuclear MRTF by ML141 treatment. (G) Relative real-time PCR of cells treated with TR100 demonstrating a reduction in fibroblastic and contractile genes as well as an increase in Sox9 mRNA levels. *, p < 0.05; **, p < 0.01; ***, p < 0.001 as compared to DMSO treatment. Grey dashed lines in G represent primary mRNA levels for genes based on our previous studies (Parreno et al., 2017a; Parreno et al., 2014; Parreno et al., 2017b).
Figure 10.
Figure 10.. Modulation of select mRNA and protein levels in human P2 cells after 2 days of treatment with ML141.
(A) Relative real-time PCR of cells treated with TR100 demonstrating a reduction in fibroblastic (COL1) and contractile (TAGLN) genes. (B) Representative WES capillary electropherograms. (C) Corresponding dot plots of relative protein levels after normalization to total protein demonstrating a decrease in fibroblast matrix (COL1) and contractile (TAGLN) protein levels as well as an increase in chondrogenic (SOX9) protein levels. *, p < 0.05; ***, p < 0.001 as compared to DMSO

Update of

Similar articles

Cited by

References

    1. Abbott J, Holtzer H, 1968. The loss of phenotypic traits by differentiated cells, V. The effect of 5-bromodeoxyuridine on cloned chondrocytes. Proc Natl Acad Sci U S A 59, 1144–1151. - PMC - PubMed
    1. Ahmed N, Iu J, Brown CE, Taylor DW, Kandel RA, 2014. Serum- and growth-factor-free three-dimensional culture system supports cartilage tissue formation by promoting collagen synthesis via Sox9-Col2a1 interaction. Tissue Eng Part A 20, 2224–2233. - PMC - PubMed
    1. Asparuhova MB, Ferralli J, Chiquet M, Chiquet-Ehrismann R, 2011. The transcriptional regulator megakaryoblastic leukemia-1 mediates serum response factor-independent activation of tenascin-C transcription by mechanical stress. FASEB J 25, 3477–3488. - PubMed
    1. Beier F, Ali Z, Mok D, Taylor AC, Leask T, Albanese C, Pestell RG, LuValle P, 2001. TGFbeta and PTHrP control chondrocyte proliferation by activating cyclin D1 expression. Mol Biol Cell 12, 3852–3863. - PMC - PubMed
    1. Benya PD, Brown PD, Padilla SR, 1988. Microfilament modification by dihydrocytochalasin B causes retinoic acid-modulated chondrocytes to reexpress the differentiated collagen phenotype without a change in shape. J Cell Biol 106, 161–170. - PMC - PubMed

LinkOut - more resources