. 2024 Jul 11;187(14):3602-3618.e20.
doi: 10.1016/j.cell.2024.05.011. Epub 2024 May 31.

De novo and salvage purine synthesis pathways across tissues and tumors

Affiliations

De novo and salvage purine synthesis pathways across tissues and tumors

Diem H Tran et al. Cell. .

Abstract

Purine nucleotides are vital for RNA and DNA synthesis, signaling, metabolism, and energy homeostasis. To synthesize purines, cells use two principal routes: the de novo and salvage pathways. Traditionally, it is believed that proliferating cells predominantly rely on de novo synthesis, whereas differentiated tissues favor the salvage pathway. Unexpectedly, we find that adenine and inosine are the most effective circulating precursors for supplying purine nucleotides to tissues and tumors, while hypoxanthine is rapidly catabolized and poorly salvaged in vivo. Quantitative metabolic analysis demonstrates comparative contribution from de novo synthesis and salvage pathways in maintaining purine nucleotide pools in tumors. Notably, feeding mice nucleotides accelerates tumor growth, while inhibiting purine salvage slows down tumor progression, revealing a crucial role of the salvage pathway in tumor metabolism. These findings provide fundamental insights into how normal tissues and tumors maintain purine nucleotides and highlight the significance of purine salvage in cancer.

Keywords: cancer metabolism; de novo purine synthesis; in vivo isotope tracing; nucleotide diet; nucleotide metabolism; purine bases; purine degradation; purine salvage; tissue; tumor growth.


Conflict of interest statement

Declaration of interests R.J.D. is an advisor for Agios Pharmaceuticals and Vida Ventures. S.J.M. is an advisor for Frequency Therapeutics and Protein Fluidics, as well as a stockholder in G1 Therapeutics and Mereo Biopharma. H.Z. has a sponsored research agreement with Alnylam Pharmaceuticals, consults for Flagship Pioneering and Chroma Medicines, and serves on the SAB of Ubiquitix. J.B. is an employee/paid consultant for Arrowhead, Calithera, Esai, Exelixis, and Johnson & Johnson and reports receiving commercial research grants from Arrowhead.

Figures
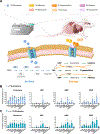
Figure 1.
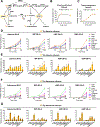
Figure 1.. Assessment of the de novo purine synthesis across tissues.
A, Schematics of the in vivo infusions with the indicated stable isotope tracers (15N-glutamine, 13C-hypoxanthine, 15N-adenine, 15N-adenosine, 13C-hypoxanthine, 15N-inosine, 15N-guanine, and 15N-guanosine) to determine relative activities of the de novo and salvage purine synthesis across tissues. Purine species from tissues are analyzed by liquid chromatography-mass spectrometry (LC-MS) analysis. Below, schematic of the de novo and salvage (orange) pathways. Glutamine and other small molecules (e.g. Gly, HCO3-, Asp, Formyl-THF) are shown to be participate in the de novo purine synthesis. B, Fractional abundance (% isotope labeled metabolite /total abundance) of labeled glutamine and purines nucleotides (IMP, AMP, GMP) in tissues from mice infused with [γ-15N]-glutamine (5h). Labeling into purines shows total isotopologue labeling. Each data point represents one mouse. Data are the mean ± s.d from 8–10 independent mice. C, Fractional abundance (%) of labeled glutamine and purine nucleotides (IMP, AMP, GMP) in tissues from mice infused with [γ, α-15N]-glutamine (5h). Labeling into purines shows total isotopologue labeling. Each data point represents one mouse. Each data point represents one mouse. Data are the mean ± s.d from 9–10 independent mice.
Figure 2.
Figure 2.. Salvage of adenine and adenosine purine precursors across tissues.
A, Schematic of [15N5]-adenine or [15N5]-adenosine labeling showing the incorporation of nitrogen into purine nucleotides (AMP, IMP, GMP). Enzymes involved in purine salvage metabolism are indicated in italic: APRT, adenine phosphoribosyltransferase; ADA, adenosine deaminase; ADK, adenosine kinase; PNP, purine nucleoside phosphorylase; HPRT1, hypoxanthine-guanine phosphoribosyltransferase; ADSL, Adenylosuccinate lyase; ADSS, Adenylosuccinate synthase; AMPD, AMP deaminase; IMPDH, IMP Dehydrogenase; GMPS, GMP synthase. B, Tracer enrichment in the blood from intravenous infusions with [15N5]-adenine. Fractional abundance of adenine (M+5) is shown for the indicated time points. Data are the mean ± s.e.m from 10 independent mice. C, Tracer enrichment in the blood from intravenous infusions with [15N5]-adenosine. Fractional abundance of adenosine (M+5) is shown for the indicated time points. Data are the mean ± s.e.m from 5 independent mice. D, Fractional abundance (%) of adenine (M+5), IMP (M+4), AMP (M+5), GMP (M+4) is shown from time-course intravenous infusion with [15N5]-adenine across tissues. Tissues (color-coded) were collected at the indicated time points (30 minutes, 1h and 5h). Data are the mean ± s.e.m from 5 independent mice. E, Fractional abundance (%) of adenine (M+5), IMP (M+4), AMP (M+5), GMP (M+4) is shown in the indicated tissues from intravenous infusion with [15N5]-adenine (5h). Each data point represents one mouse. Data are the mean ± s.d from 10 independent mice. F, As in (D) but from time-course intravenous infusion with [15N5]-adenosine for the indicated time points (30 minutes, 1h and 5h). Data are the mean ± s.e.m from 5 independent mice. G, Fractional abundance (%) of adenosine (M+5), IMP (M+4), AMP (M+5), GMP (M+4) from the 5h timepoint [15N5]-adenosine in (F) is presented as bar graphs. Each data point represents one mouse. Data are the mean ± s.d from 5 independent mice.
Figure 3.
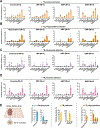
Figure 3.. Comprehensive tracer analysis of HPRT1-facilitated purine salvage
A, Fractional abundance (%) of inosine (M+4), IMP (M+4), AMP (M+4), GMP (M+4) is shown in the indicated tissues from intravenous infusion with [15-N4]-inosine (5h). Each data point represents one mouse. Data are the mean ± s.d from 5 independent mice. B, Fractional abundance (%) of hypoxanthine (M+5), IMP (M+5), AMP (M+5), GMP (M+5) is shown in the indicated tissues from intravenous infusion with [13C5]-hypoxanthine (5h). Each data point represents one mouse. Data are the mean ± s.d from 8 independent mice. C, Fractional abundance (%) of guanosine (M+5), IMP (M+4), AMP (M+4), GMP (M+5) is shown in the indicated tissues from intravenous infusion with [15N5]-guanosine (5h). Each data point represents one mouse. Data are the mean ± s.d from 10 independent mice. D, Fractional abundance (%) of guanine (M+5), IMP (M+4), AMP (M+4), GMP (M+5) is shown in the indicated tissues from intravenous infusion with [15N5]-guanine (5h). Each data point represents one mouse. Data are the mean ± s.d from 5 independent mice. E, Ex vivo labeling (3h) of human kidney sections with the indicated tracers. Fractional abundance (%) of glutamine, adenine, and hypoxanthine into IMP, AMP, and GMP. Normal renal cortex slices were used in triplicate from each patient with kidney cancers. Each data point represents one kidney section slice, from up to two patients. Data are the mean ± s.d.
Figure 4.
Figure 4.. Influence of the xanthine dehydrogenase-mediated purine catabolism on purine salvage.
A, Schematic depicting the interaction of purine salvage and purine catabolism. Allopurinol inhibits xanthine dehydrogenase (XDH), which generates uric acid from the catabolism of hypoxanthine and xanthine. Uricase (UO) converts uric acid to allantoin, the end product of purine catabolism in mice. B, Mice were treated with vehicle or allopurinol for 8 consecutive days prior to intravenous infusions with [13C5]-hypoxanthine (5h). Fractional abundance of (%) of xanthine (M+5) and allantoin (M+4) in blood are shown. Each data point represents one mouse, n=5 mice. Data are the mean ± s.d from 5 independent mice. C, As in (B), but hypoxanthine (M+5) enrichment is shown in the blood for the indicated time. Data are the mean ± s.e.m from 5 independent mice. D, As in (B), but fractional abundance (%) of hypoxanthine (M+5), IMP (M+5), AMP (M+5), and GMP (M+5) is shown in tissues after allopurinol administration. Each data point represents one mouse. Data are the mean ± s.d from 5 independent mice.
Figure 5.
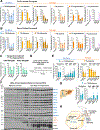
Figure 5.. Tumors utilize both the de novo and salvage pathways to maintain their purine nucleotides.
A, Isotope tracer infusions with [γ-15N]-glutamine, [15N5]-adenine, [15N5]-adenosine, [15N4]-inosine, [13C5]-hypoxanthine, and [15N5]-guanosine assessing the de novo and salvage pathway in tumors derived from Cal-51 human breast cancer cell. Fractional abundance (%) of tumor purine nucleotides (IMP, AMP, GMP) and tumor tracer are shown. Each data point represents data from one tumor-bearing athymic nude mouse. Data are the mean ± s.d from 4–8 independent mice. B, As in (A), but fractional abundance (%) of tumor metabolites from Renca mouse kidney cancer cells derived tumor. Each data point represents data from one tumor-bearing BALB/cJ mouse. Data are the mean ± s.d from 4–6 independent mice. C, Cal-51 or Renca tumor-bearing mice were treated with allopurinol for 8 consecutive days prior to intravenous infusions with [13C5]-hypoxanthine (5h). Fractional abundance (%) of tumor hypoxanthine (M+5), IMP (M+5), AMP (M+5), and GMP (M+5) is shown. Each data point represents one mouse. Data are the mean ± s.d from 5 independent mice. D, Schematic of colon cancer model induced by AOM/DSS that was subjected to intravenous infusions. E, Fractional abundance (%) of the indicated metabolites are shown as in (A), but from normal colon (vehicle-treated mice) or from tumor-bearing colon (AOM/DSS treatment group) infused with [γ, α-15N]-glutamine or [15N5]-adenine as described in (D) and. Data are from six mice in each treatment group. Each data point represents one colon section (up to two colon sections were obtained from each mouse). Data are the mean ± s.d. from 6 independent mice. F, Immunoblots of the de novo (blue) purine biosynthesis (PRPS1, PRPS2, PPAT, GART, PFAS, PAICS, ATIC, ADSS, ADSL, GMPS, and IMPDH2), or purine salvage (orange) (APRT, HPRT1, ENT2) in a MYC-driven hepatocellular carcinoma (HCC) model using the LAP-tTA/TRE-MYC transgenic mice. Each sample represents a distinct mouse. Adjacent normal liver and MYC-overexpressing tumors were analyzed. G, Fractional abundance (%) of glutamine and the newly synthesized purines IMP, AMP, GMP in normal livers or the MYC-driven HCC described in (F). Mice were infused with [γ, α-15N]-glutamine to assess the de novo purine synthesis. Each data point represents data from one mouse, Data are the mean ± s.d from 5–6 independent mice. *p < 0.05, were calculated using a two-sided Student’s t-test. H, Schematic depicting tumor cells producing purine nucleotides either from the de novo or from the salvage pathway through acquiring circulating purines in the tumor microenvironment.
Figure 6.
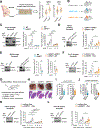
Figure 6.. The salvage purine synthesis pathway is critical for tumor growth.
A, Schematic of a protein microarray from human breast tumor and normal tissue. Quantifications of the immunoblots for HPRT1 and APRT are presented. Data present the mean ± s.d from n = 55 patient samples. Unpaired t-test, ***p < 0.001. B, Experimental design of the tumor studies using control cancer cells or GART-deficient (ΔGART) or HPRT1-deficient (Δ HPRT1) cells. C, Immunoblots of wild type (WT), ΔGART, or ΔHPRT1 Cal-51 cancer cells that were injected subcutaneously into athymic nude mice. Tumor growth was monitored after tumor onset for the indicated times. Data are the mean ± s.d. from 4–7 independent animals. **P < 0.01, ***P < 0.001 were calculated using a two-sided Student’s t-test. D, As in (C), but immunoblots from Renca ΔHPRT1 cells stably expressing either an empty vector (EV) or HPRT1 that were injected subcutaneously into Balb/c wild-type mice. Tumor growth was monitored as in (C). Data are the mean ± s.d. from 5 independent animals. *P < 0.05 was calculated using a two-sided Student’s t-test. E, As in (C), but immunoblots are from MC38 wild type (WT) or ΔGART cells, or MC38 ΔHPRT1 cells stably expressing either an empty vector (EV) or HPRT1 that were injected subcutaneously into NSG mice. Tumor growth was monitored as in (C). Data are the mean ± s.d. from 5–8 independent animals. *P < 0.05, **P < 0.01, were calculated using a two-sided Student’s t-test. F, Immunoblots from Cal-51 cells stably expressing a doxycycline (dox)-inducible shRNA targeting APRT (i-shAPRT) or scrambled (i-shCtrl) were treated with dox prior to subcutaneous injection into athymic nude mice. Dox treatment in mice was administered for the entire duration of the study. Tumor growth was monitored as in (C). Data are the mean ± s.d. from 4 independent animals. *P < 0.05 was calculated using a two-sided Student’s t-test. G, Schematic of experimental design depicting hydrodynamic transfection of the indicated genes for inducing liver tumors driven by β-catenin/Myc, while simultaneously delivering control single guide (sg) RNAs (sgCtrl) or those targetting GART (sgGART) or HPRT1 (sgHPRT1). H, Representative gross liver photographs and H&E images showing liver tumors from the experiment described in (G). I, Quantification of the micro-tumors from H&E images in (H). Data are the mean ± s.d. from 6–10 independent mice. *P < 0.05, **P < 0.01 were calculated using a two-sided Student’s t-test. J, Relative protein expressions are shown for GART and HPRT1 from the experiment described in (G). Data are the mean ± s.d. from n = 8–11 independent mice. *P < 0.05, ***P < 0.001 were calculated using a two-sided Student’s t-test. K, Immunoblots from Cal-51 cells stably expressing a dox-inducible shRNA targeting HPRT1 (i-shHPRT1) or scrambled (i-shCtrl) that were injected subcutaneously into athymic nude mice. Dox treatment was administered after tumor formation (100 mm3). Tumor growth was monitored as in (C). Data are shown as mean ± s.d. from 7–8 independent animals. *P < 0.05 was calculated using a two-sided Student’s t-test. L, Immunoblots from HCT116 cells stably expressing a dox-inducible shRNA targeting HPRT1 (i-shHPRT1) or scrambled (i-shCtrl) that were injected subcutaneously into NSG nude mice. Dox treatment was administered after tumor formation (100 mm3). Tumor growth was monitored after tumor onset and for the indicated times. Data are shown as mean ± s.d. from 7 independent animals. *P < 0.05 was calculated using a two-sided Student’s t-test.
Figure 7:
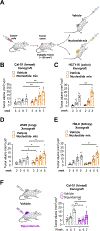
Figure 7:. Dietary nucleotides promote tumor growth
A, Schematic of experimental design. Tumor-bearing mice were subjected to vehicle control (water) or a nucleotide mixture (AMP, GMP, CMP, UMP). When tumors become palpable (~100 mm3), nucleotides were administered orally for 6 days/week and for the indicated times. B, Cal-51 breast cancer cells were injected subcutaneously into athymic nude mice. After tumor formation (100 mm3) animals were treated with vehicle or a nucleotide mixture for six consecutive weeks. Tumor growth was monitored after tumor onset for the indicated times. Data are shown as mean ± s.d. from 6–8 independent animals. **P < 0.01 was calculated using a two-sided Student’s t-test. C, As in (B), but tumor growth was assessed from NSG mice injected with HCT-116 colorectal cancer cells and treated with vehicle or a nucleotide mixture for three consecutive weeks. Data are shown as mean ± s.d. from 10 independent animals. **P < 0.01 was calculated using a two-sided Student’s t-test. D, As in (B), but tumor growth was assessed from NSG mice injected with A549 lung cancer cells that were treated with vehicle (water) or a nucleotide mixture for four consecutive weeks. Data are shown as mean ± s.d. from 6–8 independent animals. **P < 0.01 was calculated using a two-sided Student’s t-test. E, As in (B), but tumor growth was assessed from NSG mice injected with 786-O kidney cancer cells that were treated with vehicle or a nucleotide mixture for five consecutive weeks. Data are shown as mean ± s.d. from 10 independent animals. **P < 0.01 was calculated using a two-sided Student’s t-test. F, Cal-51 breast cancer cells were injected subcutaneously into athymic nude mice. After tumor formation (100 mm3) animals were treated with vehicle or dipyridamole (25 mg/kg) five times a week for 6 weeks. Tumor growth was monitored as in (B). Data are the mean ± s.d. from 9–10 independent samples. *P < 0.05 was calculated using a two-sided Student’s t-test.

References

    1. Luengo A, Gui DY, and Vander Heiden MG (2017). Targeting Metabolism for Cancer Therapy. Cell Chem Biol 24, 1161–1180. 10.1016/j.chembiol.2017.08.028. - DOI - PMC - PubMed
    1. Elion GB (1989). The purine path to chemotherapy. Science 244, 41–47. 10.1126/science.2649979. - DOI - PubMed
    1. Ariav Y, Ch'ng JH, Christofk HR, Ron-Harel N, and Erez A. (2021). Targeting nucleotide metabolism as the nexus of viral infections, cancer, and the immune response. Sci Adv 7. 10.1126/sciadv.abg6165. - DOI - PMC - PubMed
    1. Villa E, Ali ES, Sahu U, and Ben-Sahra I. (2019). Cancer Cells Tune the Signaling Pathways to Empower de Novo Synthesis of Nucleotides. Cancers (Basel) 11. 10.3390/cancers11050688. - DOI - PMC - PubMed
    1. Ali ES, and Ben-Sahra I. (2023). Regulation of nucleotide metabolism in cancers and immune disorders. Trends Cell Biol. 10.1016/j.tcb.2023.03.003. - DOI - PMC - PubMed

LinkOut - more resources