. 2024 Aug 19;59(16):2203-2221.e15.
doi: 10.1016/j.devcel.2024.05.010. Epub 2024 May 31.

Nucleotide depletion promotes cell fate transitions by inducing DNA replication stress

Affiliations

Nucleotide depletion promotes cell fate transitions by inducing DNA replication stress

Brian T Do et al. Dev Cell. .

Abstract

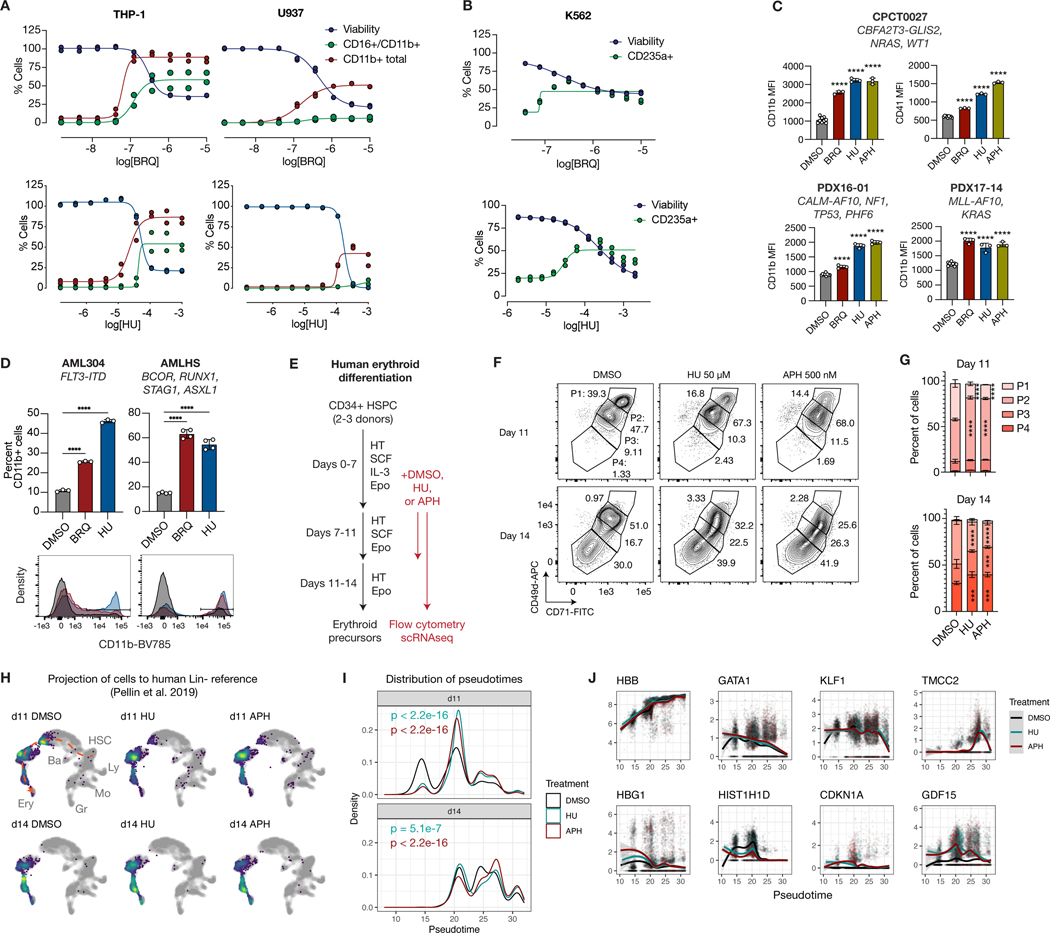
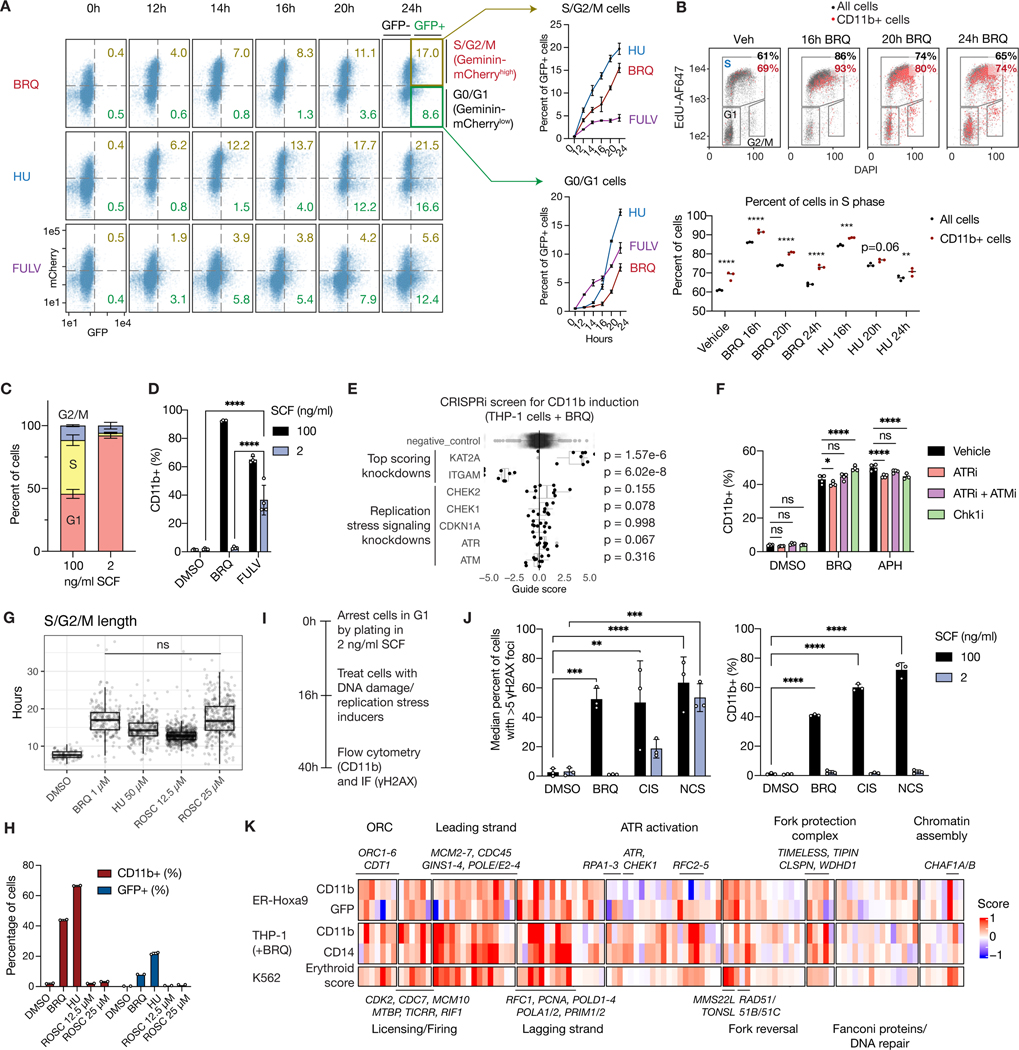
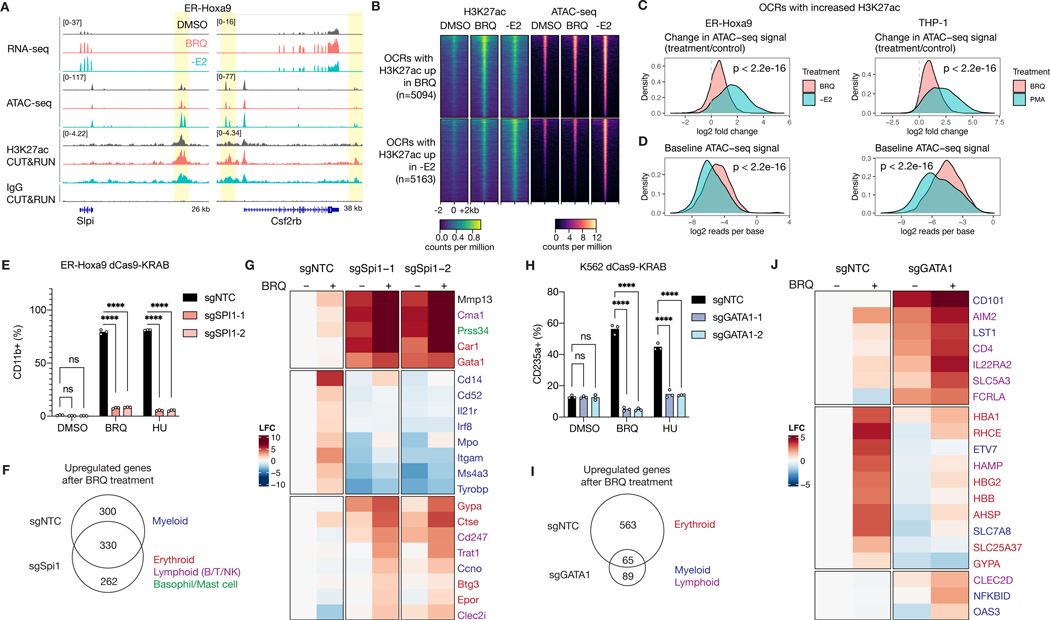
Control of cellular identity requires coordination of developmental programs with environmental factors such as nutrient availability, suggesting that perturbing metabolism can alter cell state. Here, we find that nucleotide depletion and DNA replication stress drive differentiation in human and murine normal and transformed hematopoietic systems, including patient-derived acute myeloid leukemia (AML) xenografts. These cell state transitions begin during S phase and are independent of ATR/ATM checkpoint signaling, double-stranded DNA break formation, and changes in cell cycle length. In systems where differentiation is blocked by oncogenic transcription factor expression, replication stress activates primed regulatory loci and induces lineage-appropriate maturation genes despite the persistence of progenitor programs. Altering the baseline cell state by manipulating transcription factor expression causes replication stress to induce genes specific for alternative lineages. The ability of replication stress to selectively activate primed maturation programs across different contexts suggests a general mechanism by which changes in metabolism can promote lineage-appropriate cell state transitions.

Keywords: cancer; cell fate; cell state; dependencies; differentiation; epigenetics; hematopoiesis; metabolism; nucleotides; replication; replication stress.


Conflict of interest statement

Declaration of interests D.B.S. is a co-founder of and holds equity in Clear Creek Bio. M.G.V.H. is on the scientific advisory board of Agios Pharmaceuticals, iTeos Therapeutics, Drioa Ventures, Sage Therapeutics, Lime Therapeutics, Pretzel Therapeutics, and Auron Therapeutics, and is on the advisory board of Developmental Cell. P.P.H. has consulted for Auron Therapeutics. J.S.W. serves as an advisor to and/or has equity in KSQ Therapeutics, Maze Therapeutics, and 5AM Ventures. J.M.R. consults for Maze Therapeutics, Waypoint Bio, and Third Rock Ventures. I.S.H. reports financial support from Kojin Therapeutics and consulting fees for Ono Pharma USA.

Figures

Figure 1.
Figure 1.. A focused pharmacologic screen reveals molecules targeting nucleotide metabolism can promote leukemia differentiation.
A. Schematic of screen using mouse ER-Hoxa9 GMPs. Brequinar (BRQ) and withdrawal of estrogen (-E2) to suppress ER-Hoxa9 activity induce neutrophil-directed differentiation. B. Area under the curve (AUC) for CD11b/GFP expression (differentiation) versus viability for ER-Hoxa9 cells in response to four days of treatment with a metabolic compound library (10 doses per drug up to 10 μM). Compounds labeled in red disrupt nucleotide biosynthesis or DNA replication. C. Percent viability (blue) and CD11b/GFP positivity (red) for ER-Hoxa9 GMP cells treated with each compound (n=2). Each compound is color-coded by enzyme target. D. AUC for CD11b/GFP expression (differentiation) for each compound in the library, grouped by target category. P-values, Mann-Whitney U test. E. Log2 fold change in levels of NTPs and dNTPs in ER-Hoxa9 GMP cells following 24h of treatment with compounds (all at 1 μM) with or without addition of cognate nucleotides (all at 1 mM) (n=3), compared with DMSO treatment. “n.d.”, not detected. BRQ, brequinar. U, uridine. PYR, pyrazofurin. LTX, lometrexol. MMF, mycophenolate mofetil. Hx, hypoxanthine. G, guanine. U, uridine. P-values, Student’s t-test. Comparisons are made either to DMSO treatment or between each treatment-rescue pair. F. Percentage of CD11b-expressing ER-Hoxa9 GMP cells following 96h of treatment with LTX (41 nM), MMF (370 nM), BRQ (1.1 μM), RX-3117 (1.1 μM), or PYR (123 nM), with or without addition of cognate nucleotides (all 1 mM) (n=2). P-values, Student’s t-test. (*) p < 0.05, (**) p < 0.01 See also Figure S1.
Figure 2.
Figure 2.. DNA replication stress links nucleotide depletion and dNTP imbalance to cell state progression.
A. Percent viability (blue) and differentiation, as assessed by CD11b and GFP expression (green), for ER-Hoxa9 cells after treatment with HU or APH for 96 hours (n=2). B. Log fold change of intracellular levels of deoxyribonucleotides (top) and ribonucleotides (bottom) in ER-Hoxa9 following 24h of treatment (n=4). C. Cytospin images of ER-Hoxa9 cells treated for 24 hours. Granules are indicated with black arrowheads. Scale bars represent 10 μm. D. Representative flow cytometry plots (EdU vs. DAPI) in ER-Hoxa9 cells treated for 24 hours then pulsed with EdU for the last 30 minutes. E. (top) DNA fiber experiment. (bottom) Replication fork speed (kb/min) in ER-Hoxa9 cells treated for 8 hours. ≥100 fibers were assayed for each condition. F. Immunoblot for the indicated proteins in ER-Hoxa9 cells treated with BRQ. kDa, kilodaltons. G. Proliferation rates, surface marker expression, and immunoblots in ER-Hoxa9 cells treated for 24 hours (48 hours where indicated). All nucleosides/bases at 1 mM except for dG (100 μM). Heatmaps are row-normalized. Immunoblots presented are from the same blot. H. log2 relative abundance of dNTPs (top) and NTPs (bottom) for ER-Hoxa9 cells treated for 24h as in (G), compared to DMSO (n=3–4). P-values, two-way ANOVA with Šidák correction for multiple comparisons. (ns) not significant, (*) p < 0.05, (**) p < 0.01, (***) p < 0.001, and (****) p < 0.0001. Except as otherwise stated, BRQ was dosed at 1 μM, HU at 50 μM, and APH at 1 μM. See also Figure S2.
Figure 3.
Figure 3.. Nucleotide depletion and replication stress induce cell fate progression in AML models and promote normal erythroid differentiation.
A. Percentage of CD11b+, CD11b+/CD16+, and viable THP-1 (left) or U937 (right) cells upon treatment with BRQ (top) or HU (bottom) for 96h (n=2). B. Percentage of CD235a+ and viable K562 cells upon treatment with BRQ (top) or HU (bottom) for 72h (n=2). C. Mean fluorescence intensity of various surface markers for PDX AML lines after 72h of treatment (concentrations in STAR Methods). P-values, one-way ANOVA with Dunnett’s multiple comparisons test. D. (top) Percentage of CD11b+ cells for two primary AML cell cultures treated with DMSO, 1 μM BRQ, or 100 μM HU for 72h. (bottom) Representative flow cytometry histograms. P-values, one-way ANOVA with Dunnett’s multiple comparisons test. E. Schematic of erythroid differentiation experiment using human CD34+ HSPCs. F. Representative flow cytometry plots of CD71 and CD49 signal for erythroid progenitors treated with DMSO, 50 μM HU, or 500 nM APH at day 7 and analyzed at day 11 and 14. G. Percentage of cells in each gate in (F) for each treatment and timepoint (n=3). P-values, two-way ANOVA with Šidák correction for multiple comparisons. Unmarked comparisons between DMSO and treatment are not significant. H. scRNAseq transcriptomes of cells from two donors, projected onto a reference map (gray) of human lineage-negative bone marrow cells. Cells are plotted as a density map (least dense in blue, densest in yellow). The erythroid trajectory used for pseudotime analysis in panels (I) and (J) is depicted in orange. Ery: erythroid, Ba: basophil, HSC: hematopoietic stem cell, Ly: lymphocyte, Mo: monocyte, Gr: granulocyte. I. Pseudotime analysis of cells treated with DMSO, HU, or APH at day 11 and 14 using the trajectory depicted in orange in (H). Cells from both donors were pooled. P-values, Mann-Whitney U test. J. Log2 expression of selected genes plotted against pseudotime for cells treated with DMSO, HU, and APH. Cells from different donors and timepoints were pooled. (ns) not significant, (*) p < 0.05, (**) p < 0.01, (***) p < 0.001, and (****) p < 0.0001 See also Figure S3.
Figure 4.
Figure 4.. Genetic screens identify altered DNA replication as a common driver of differentiation across three leukemia models.
A. Schematic of CRISPRi screen to assess modulators of CD11b and GFP induction in ER-Hoxa9 cells expressing dCas9-ZIM3-KRAB. B. Log2 fold change (L2FC) of sgRNA barcode enrichment in the top versus bottom 25% of CD11b (x-axis) or GFP (y-axis) expressing cells. Hits in both screens (FDR < 0.1 and L2FC > 0) are highlighted in blue; selected genes are labeled. C. Enriched KEGG gene ontology categories for CD11b hits. The negative log10 adjusted p-value is displayed. Categories related to DNA replication are colored red. D. Same as (C) but for GFP hits. E . Venn diagram for CD11b and GFP hits. Overlapping hits involved in DNA replication or nucleotide synthesis are listed. F. Log2 fold change (L2FC) in guide enrichment between day 6 and day 0 of the screen for each class of hits and non-hits. Comparisons with non-hits (****) p < 2.2e-16, Mann-Whitney U test. G. CD11b (left) and GFP (right) log2 enrichment for each quintile of knockdowns, ranked by day 6/day 0 L2FC (lowest quintile is least proliferative). P-values, one-sided Mann-Whitney U test. H. Schematic of CRISPRi screen to assess modulators of CD11b and CD14 induction in BRQ-treated THP1 cells expressing dCas9-ZIM3-KRAB. I. Same as (B) but from the THP-1 screens. J. Same as (E) but from the THP-1 screens. K. Schematic of Perturb-seq screen in K562 cells. L. Scatterplot of myeloid or erythroid scores for each knockdown. Replication- and nucleotide synthesis-related genes are highlighted in red. Horizontal and vertical dotted gray lines represent 99th percentile score. Inset displayed for clarity. M CD11b and GFP L2FC scores for metabolism hits in the ER-Hoxa9 screen described in (A). All genes are displayed whose L2FC exceeds 0.5 and FDR < 0.2. Selected categories are highlighted. N. Same as (M) but for metabolism hits in the THP-1 screen described in (H). O. Erythroid score in the K562 Perturb-seq screen described in (K) for all metabolism genes, plotted against fraction of S phase cells. Genes with an erythroid score > 0.5 are labeled; selected categories are highlighted. See also Figure S4.
Figure 5.
Figure 5.. DNA replication stress drives differentiation during S phase and is independent of the replication stress response.
A. (Left) Representative flow cytometry plots of ER-Hoxa9 Geminin-mCherry cells treated with 1 μM BRQ, 50 μM HU, or 10 μM FULV over 24 hours. X-axis, log10 GFP signal. Y-axis, log10 mCherry signal. (Right) Percentage of GFP+ mCherryhi (S/G2/M) or GFP+ mCherrylo (G0/G1) cells (n=4). BRQ, brequinar. HU, hydroxyurea. FULV, fulvestrant. B. (Top) EdU incorporation versus DNA content (DAPI) for each treatment; CD11b+ cells are colored red. The percentage of S-phase cells is displayed for all cells (black) or CD11b+ cells (red). (Bottom) Percentage of cells in S phase (n=3). C. Percentage of ER-Hoxa9 cells in each cell cycle phase after 24h of growth in 100 or 2 ng/ml SCF. D. Percentage of CD11b-expressing ER-Hoxa9 cells following 48h of treatment with DMSO, 1 μM BRQ, or 10 μM FULV in media with 100 or 2 ng/ml SCF. E. CD11b enrichment scores for negative control guides or single-gene knockdowns in THP-1 dCas9-KRAB-mCherry cells from the CRISPRi screen in Figure 4H. P-values, Mann-Whitney U test. F. Percentage of CD11b-expressing ER-Hoxa9 cells following 24h of treatment with DMSO, 1 μM BRQ, or 1 μM APH and vehicle, ATRi (20 nM AZ20), ATRi + ATMi (80 nM AZD0156), or Chk1i (100 nM rabusertib) (n=3). G. S/G2/M phase length (hours) for ER-Hoxa9 Geminin-mCherry cells treated with DMSO, BRQ, or ROSC (roscovitine). BRQ and ROSC were not statistically significantly different (Mann-Whitney U test). H. Percentage of CD11b+ or GFP+ ER-Hoxa9 cells after 24h of treatment (concentrations as in (G)) (n=2). I. Schematic of experiments testing compounds in G1-arrested ER-Hoxa9 cells. J. Median percentage of ER-Hoxa9 cells with at least 5 γH2AX foci (left) and percentage of CD11b-expressing ER-Hoxa9 cells (right) after 24h of treatment with DMSO, 1 μM BRQ, 2.5 μM CIS, or 2.5 μg/ml NCS during asynchronous cycling (100 ng/ml SCF) or following G1 arrest (2 ng/ml SCF). CIS, cisplatin. NCS, neocarzinostatin. K. MAGECK gene scores for DNA replication-related genes from the screens in Figure 4A (ER-Hoxa9) and Figure 4H (THP-1), and erythroid score from the K562 Perturb-seq in Figure 4K (K562). (**) p < 0.01, (***) p < 0.001, (****) p < 0.0001. Except as otherwise stated, P-values were calculated using a two-way ANOVA with the Šidák correction for multiple comparisons. See also Figure S5.
Figure 6.
Figure 6.. Replication stress changes cell fate at the transcriptional and epigenetic level despite maintenance of progenitor transcription factor activity.
A. Principal components analysis (PCA) plot of RNA sequencing in ER-Hoxa9 cells at different timepoints following 2 μM BRQ treatment or E2 withdrawal. B. Expression of selected genes in ER-Hoxa9 cells representing the progenitor state (GMP and other lineages), maturation (myeloid TFs, primary/secondary/tertiary granules), and cell cycle at different timepoints following BRQ treatment or E2 withdrawal. C. (Top) Smoothed log2 expression of selected GMP and maturation genes along a pseudotime trajectory of normal mouse GMP to neutrophil differentiation. (Bottom) Projection of each timepoint from ER-Hoxa9 BRQ and -E2 treatment to the most correlated point along this pseudotime trajectory. D. Expression of selected genes in THP-1 cells treated with 500 nM BRQ, 100 μM HU, or 100 nM PMA. E. Expression of selected genes in K562 dCas9-KRAB cells expressing sgNTC or sgBCR, or treated with DMSO or 250 nM BRQ for 72h. F. Log2 fold change in gene body RNA polymerase II occupancy (CUT&RUN) for genes based on expression change after 24 hours of BRQ treatment. NS, not significant. G. Log2 fold change in expression (RNAseq) of genes within 100kb of distal regulatory elements (“enhancers”) based on change in H3K27ac signal after 24 hours of BRQ treatment. H. Log2 fold change in promoter H3K27ac signal (CUT&RUN) for genes based on expression change after 24 hours of BRQ treatment. I. RNA polymerase II and H3K27ac CUT&RUN signal, as well as IgG CUT&RUN signal, for two representative genes (Spi1 and Cd34) in ER-Hoxa9 cells after 24h of treatment. Regions with changes in H3K27ac signal are highlighted. J. (left) Number of differentially accessible peaks at various timepoints following BRQ treatment or E2 withdrawal in ER-Hoxa9 cells. Shared differentially accessible peaks are also plotted. (right) Selected transcription factor motifs and accessibility scores from ChromVAR analysis. K. Same as (J), but for BRQ and PMA treatment in THP-1 cells. (****) p < 0.0001, Mann-Whitney U test. See also Figures S6 and S7.
Figure 7.
Figure 7.. Pre-existing chromatin accessibility guides the epigenetic response to replication stress.
A. ATAC-seq, RNA-seq, and H3K27ac CUT&RUN signal at baseline and 24h after BRQ treatment or E2 withdrawal, as well as IgG CUT&RUN signal, for Slpi and Csf2rb in ER-Hoxa9 cells. B. Heatmaps of open chromatin regions (OCRs) with significantly increased H3K27ac after BRQ treatment or E2 withdrawal in ER-Hoxa9 cells. H3K27ac or ATAC-seq signal are displayed in a ±2kb window centered on the OCR. Values represent counts per million reads. C. Log2 fold change in ATAC-seq signal (treatment/control) at OCRs with increased H3K27ac in ER-Hoxa9 cells treated with BRQ or -E2 (left) and THP-1 cells treated with BRQ or PMA (right). P-values, Mann-Whitney U test. D. Same as (C), but displaying log2 baseline ATAC-seq signal (normalized reads per base) for each set of OCRs. E. Percentage of CD11b-positive ER-Hoxa9 dCas9-KRAB cells expressing sgNTC, sgSpi1–1, or sgSpi1–2 (n=3) after 48h of treatment with DMSO, 1 μM BRQ, or 50 μM HU. F. Venn diagram of genes upregulated by BRQ treatment (LFC > 1, adjusted p-value < 0.01). G. Log fold changes for selected genes in each guide/treatment combination relative to sgNTC DMSO (n=4). H. Percentage of CD235a-positive K562 dCas9-KRAB cells expressing sgNTC, sgGATA1–1, and sgGATA1–2 (n=3) after 72h of treatment with DMSO, 250 nM BRQ, or 125 μM HU. I. Venn diagram of genes upregulated by BRQ treatment (LFC > 1, adjusted p-value < 0.01). J. Log fold changes for selected genes in each guide/treatment combination relative to sgNTC DMSO (n=3). (****) p < 0.0001. Except as otherwise stated, P-values calculated by two-way ANOVA with Šidák correction for multiple comparisons. See also Figure S8.

Similar articles

Cited by

References

    1. Intlekofer AM, and Finley LWS (2019). Metabolic signatures of cancer cells and stem cells. Nat. Metab 1, 177–188. 10.1038/s42255-019-0032-0. - DOI - PMC - PubMed
    1. Shapira SN., and Christofk HR. (2020). Metabolic Regulation of Tissue Stem Cells. Trends Cell Biol. 30, 566–576. 10.1016/j.tcb.2020.04.004. - DOI - PMC - PubMed
    1. Le Magnen C, Shen MM, and Abate-Shen C (2018). Lineage Plasticity in Cancer Progression and Treatment. Annu. Rev. Cancer Biol 2, 271–289. 10.1146/annurev-cancerbio-030617-050224. - DOI - PMC - PubMed
    1. Quintanal-Villalonga Á, Chan JM, Yu HA, Pe’er D, Sawyers CL, Sen T, and Rudin CM (2020). Lineage plasticity in cancer: a shared pathway of therapeutic resistance. Nat. Rev. Clin. Oncol 17, 360–371. 10.1038/s41571-020-0340-z. - DOI - PMC - PubMed
    1. Roy N, and Hebrok M (2015). Regulation of cellular identity in cancer. Dev. Cell 35, 674–684. 10.1016/j.devcel.2015.12.001. - DOI - PMC - PubMed

Publication types