

The Associations between Neighborhood Characteristics and Childhood Overweight and Obesity in a National Dataset
- PMID: 38823500
- PMCID: PMC12039961
- DOI: 10.1016/j.acap.2024.05.009
The Associations between Neighborhood Characteristics and Childhood Overweight and Obesity in a National Dataset
Abstract
Background: National child obesity rates continue to climb. While neighborhood factors are known to influence childhood weight, more work is needed to further our understanding of these relationships and inform intervention and policy approaches reflective of complex real-world contexts.
Methods: To evaluate the associations between neighborhood components and childhood overweight/obesity, we analyzed sequential, cross-sectional data from the National Survey of Children's Health collected annually between 2016 and 2021. To characterize the complexity of children's neighborhood environments, several interrelated neighborhood factors were examined: amenities, detractions, support, and safety. We used ordinal logistic regression models to evaluate the associations between these exposures of interest and childhood weight status, adjusting for potential confounders.
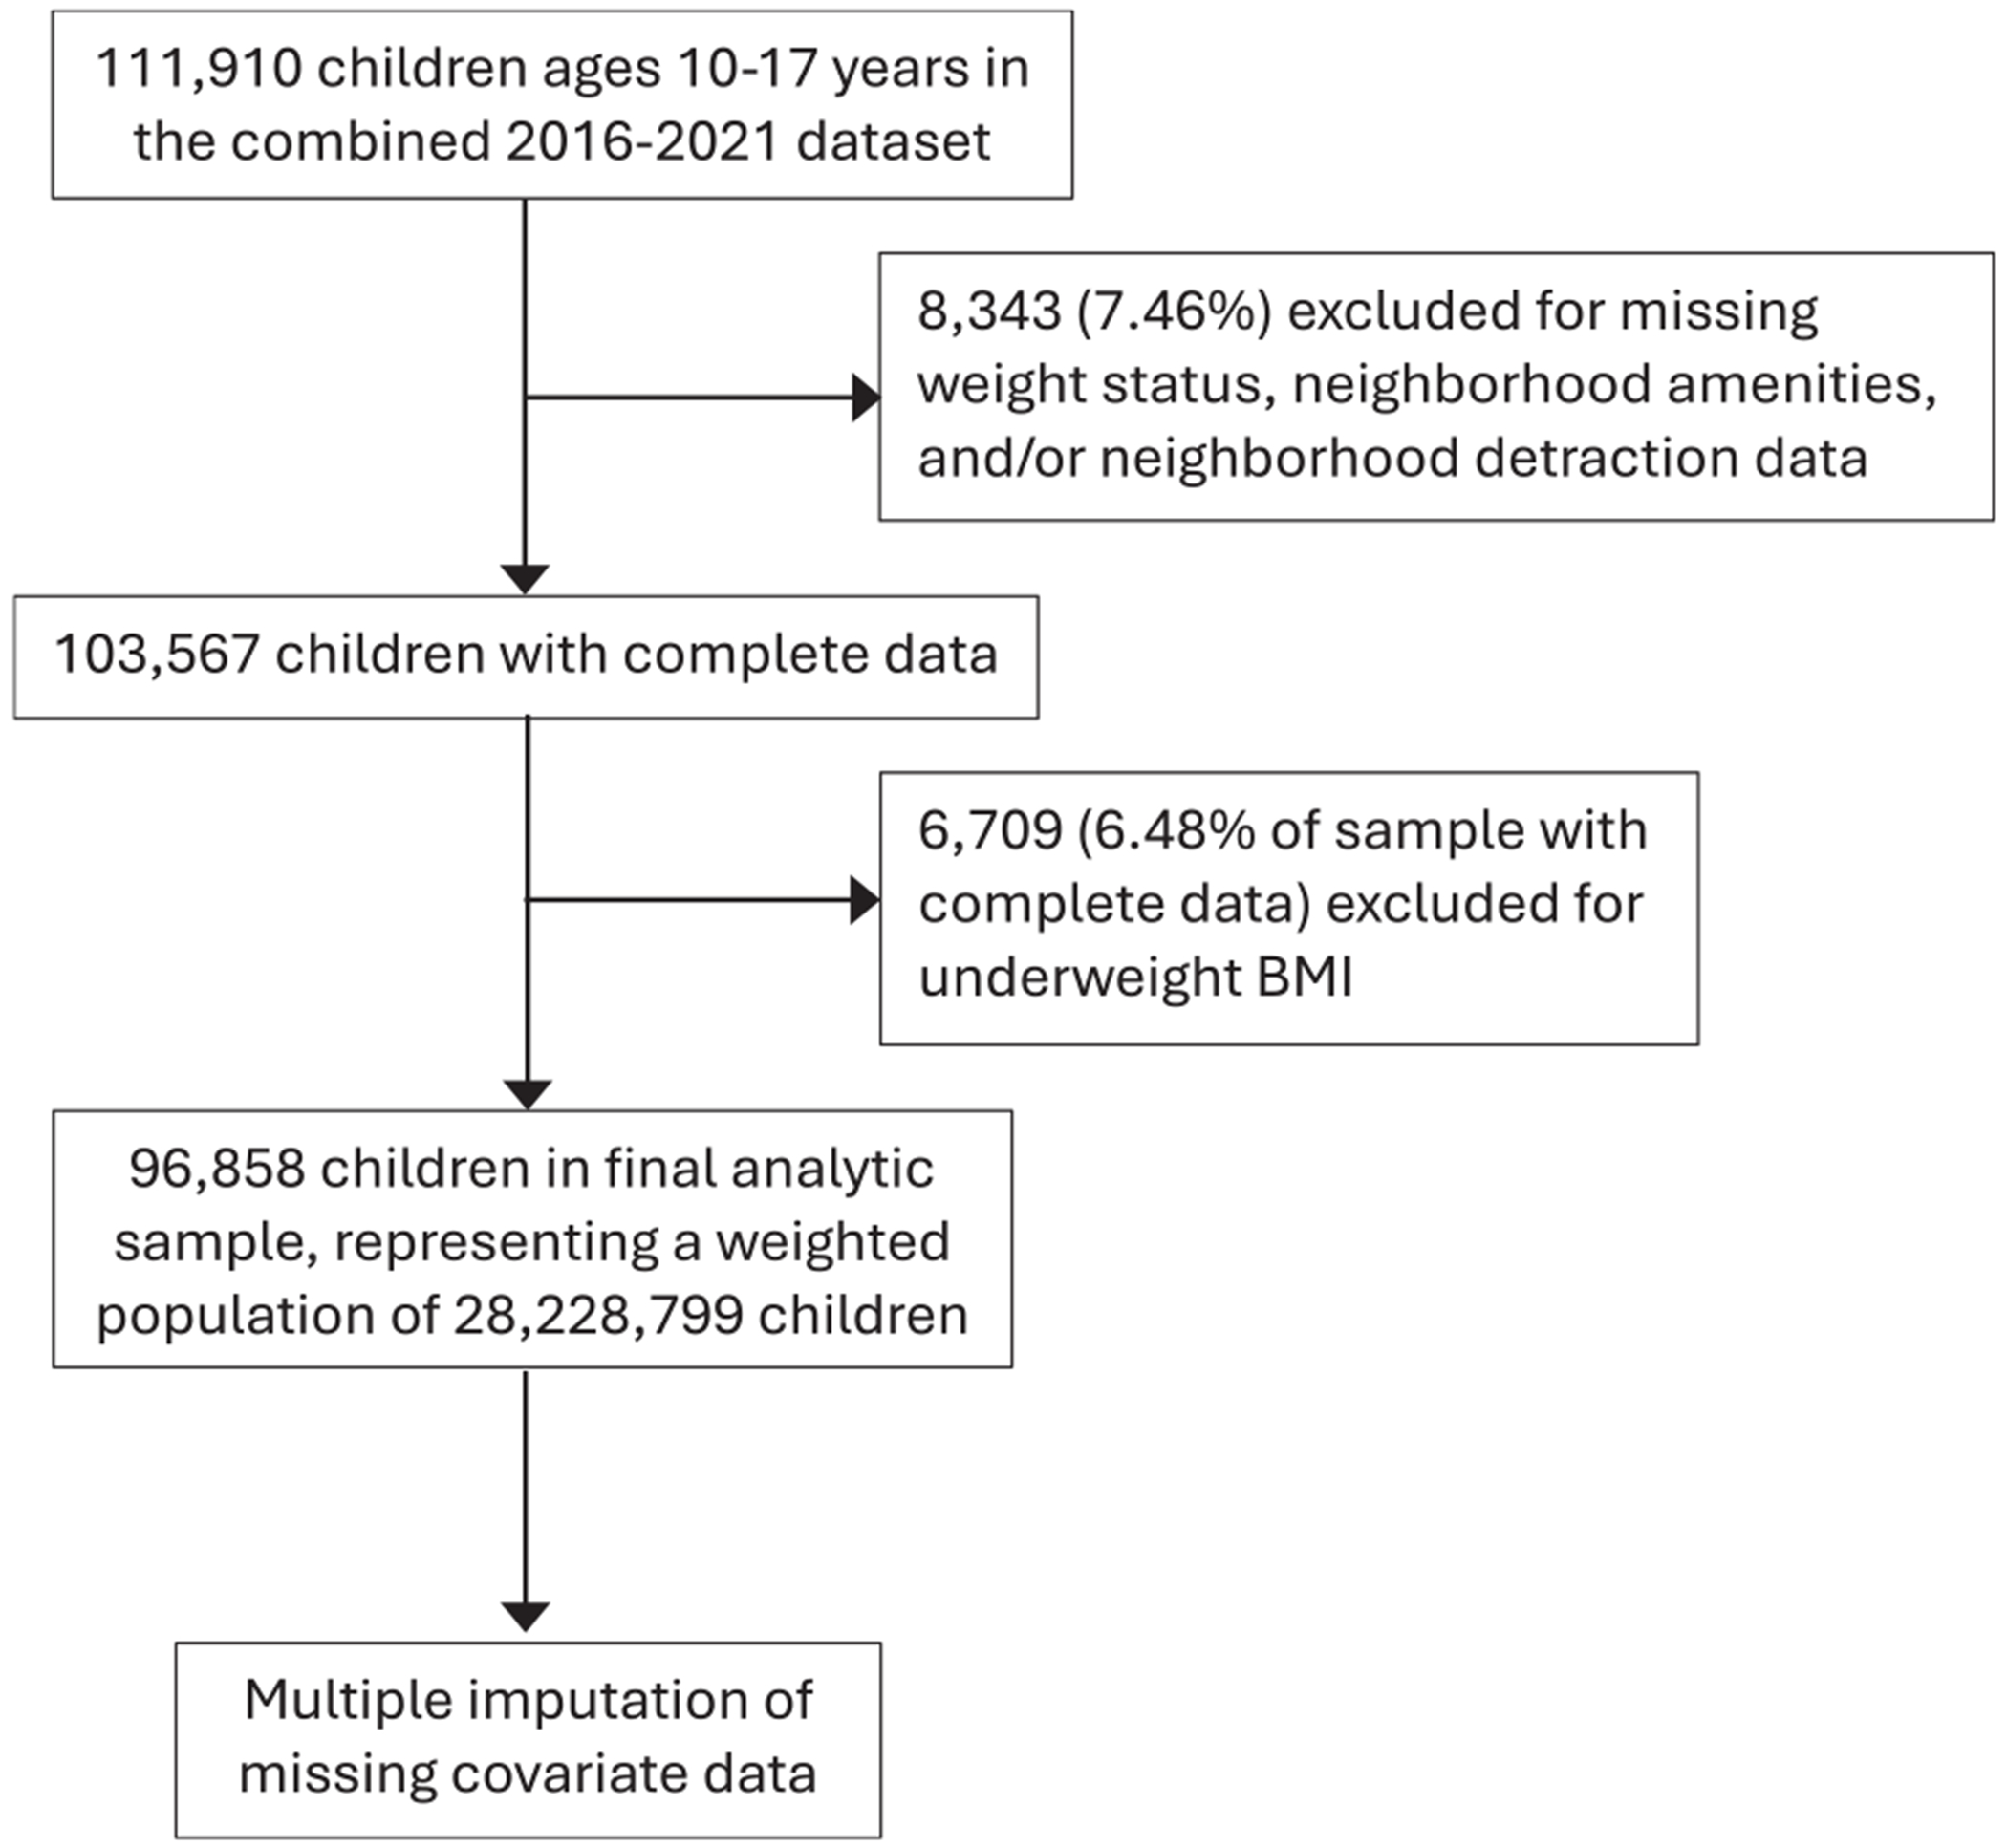
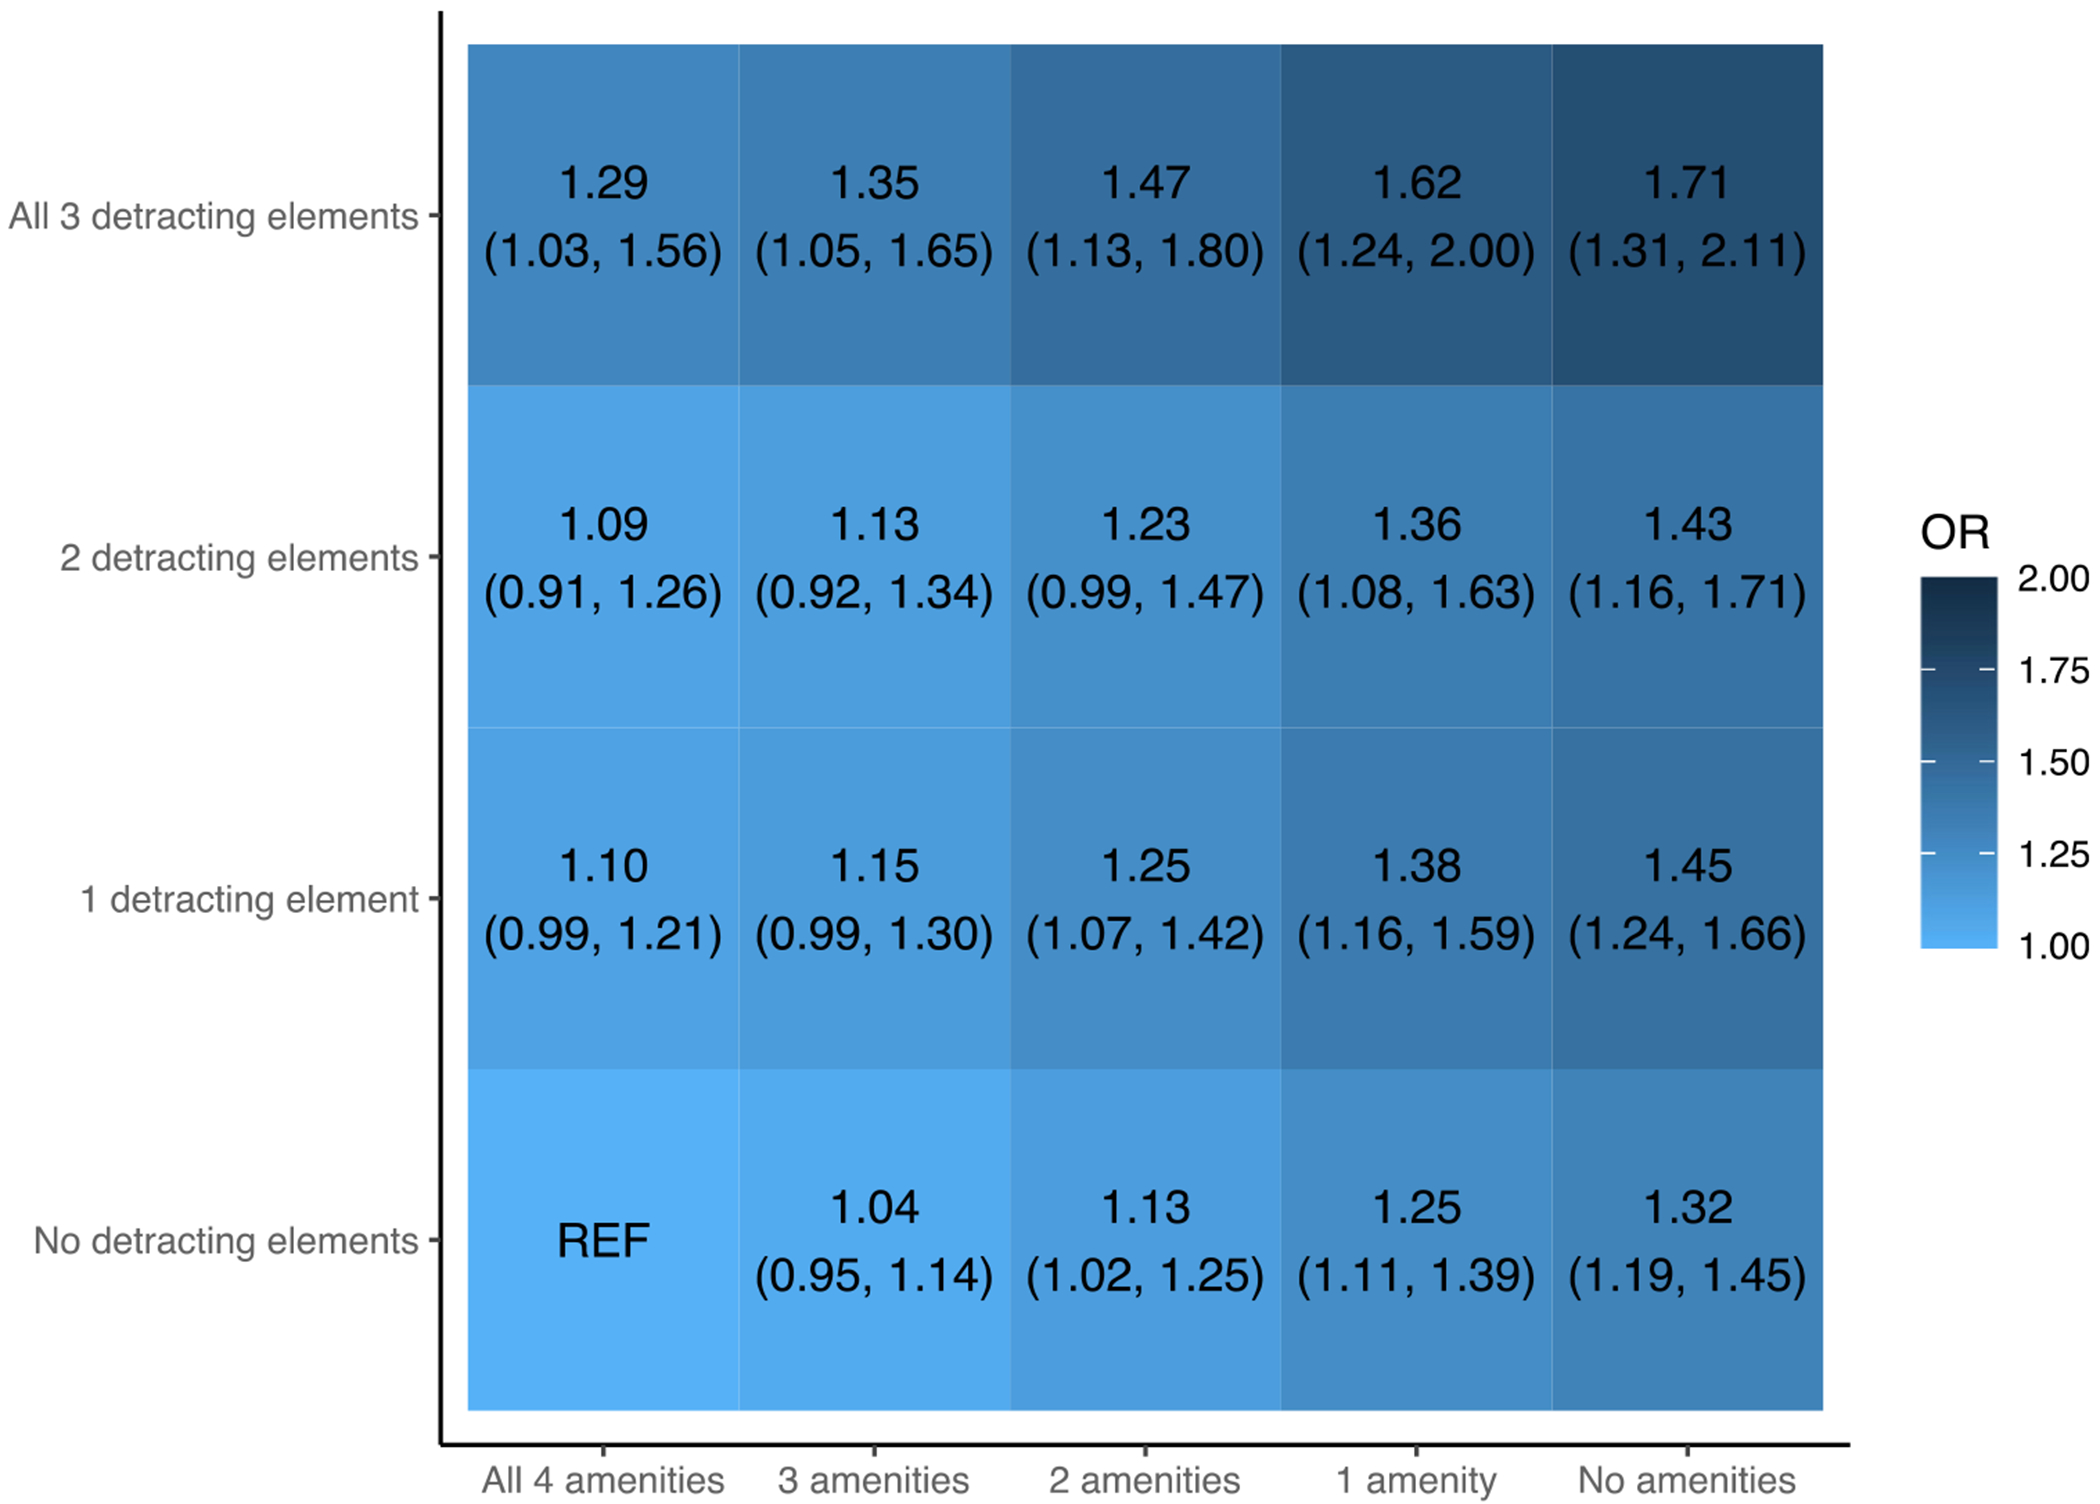
Results: Our analytic sample contained 96,858 children representing a weighted population of 28,228,799 children ages 10-17 years. Child weight status was healthy in 66.5%, overweight in 16.8%, and obese in 17.2%. All four neighborhood factors were associated with child weight status. The odds of overweight or obesity generally increased with a decreasing number of amenities and increasing number of detractions, with the highest adjusted odds ratio seen with no amenities and all three possible detractions (1.71; 95% confidence interval [1.31, 2.11]).
Conclusions: Multiple factors within a child's neighborhood environment were associated with child weight status in this sample representative of the US population aged 10-17 years. This suggests the need for future research into how policies and programs can support multiple components of a healthy neighborhood environment simultaneously to reduce rates of childhood overweight/obesity.
Keywords: built environment; child obesity; child overweight; neighborhood; social environment.
Copyright © 2024 Academic Pediatric Association. Published by Elsevier Inc. All rights reserved.
Conflict of interest statement
Declaration of Competing Interest The authors declare the following financial interests/personal relationships which may be considered as potential competing interests: Ellen McMahon reports financial support was provided by National Institute of Diabetes and Digestive and Kidney Diseases.
Figures
Similar articles
-
Do Patients of Different Levels of Affluence Receive Different Care for Pediatric Osteosarcomas? One Institution's Experience.Clin Orthop Relat Res. 2025 Apr 1;483(4):748-758. doi: 10.1097/CORR.0000000000003299. Epub 2024 Oct 30. Clin Orthop Relat Res. 2025. PMID: 39485923
-
The Combined Effects of Social Determinants of Health on Childhood Overweight and Obesity.Child Obes. 2024 Mar;20(2):107-118. doi: 10.1089/chi.2022.0222. Epub 2023 Mar 29. Child Obes. 2024. PMID: 36989504 Free PMC article.
-
Healthy eating interventions delivered in early childhood education and care settings for improving the diet of children aged six months to six years.Cochrane Database Syst Rev. 2023 Aug 22;8(8):CD013862. doi: 10.1002/14651858.CD013862.pub3. Cochrane Database Syst Rev. 2023. PMID: 37606067 Free PMC article.
-
Diet, physical activity and behavioural interventions for the treatment of overweight or obese children from the age of 6 to 11 years.Cochrane Database Syst Rev. 2017 Jun 22;6(6):CD012651. doi: 10.1002/14651858.CD012651. Cochrane Database Syst Rev. 2017. PMID: 28639319 Free PMC article.
-
Associations of Longitudinal BMI-Percentile Classification Patterns in Early Childhood with Neighborhood-Level Social Determinants of Health.Child Obes. 2025 Jan;21(1):65-75. doi: 10.1089/chi.2023.0157. Epub 2024 Aug 26. Child Obes. 2025. PMID: 39187268
Cited by
-
Psychosocial Correlates of Childhood Body Mass Index: Racial and Ethnic Differences.Glob J Cardiovasc Dis. 2025;4(1):34-49. doi: 10.31586/gjcd.2025.1180. Epub 2025 Feb 13. Glob J Cardiovasc Dis. 2025. PMID: 40026829 Free PMC article.
References
MeSH terms
Grants and funding
LinkOut - more resources
Full Text Sources
Medical
