. 2024 Jun 1;15(1):4673.
doi: 10.1038/s41467-024-48854-5.

IκBα controls dormancy in hematopoietic stem cells via retinoic acid during embryonic development

Affiliations

IκBα controls dormancy in hematopoietic stem cells via retinoic acid during embryonic development

Roshana Thambyrajah et al. Nat Commun. .

Abstract

Recent findings suggest that Hematopoietic Stem Cells (HSC) and progenitors arise simultaneously and independently of each other already in the embryonic aorta-gonad mesonephros region, but it is still unknown how their different features are established. Here, we uncover IκBα (Nfkbia, the inhibitor of NF-κB) as a critical regulator of HSC proliferation throughout development. IκBα balances retinoic acid signaling levels together with the epigenetic silencer, PRC2, specifically in HSCs. Loss of IκBα decreases proliferation of HSC and induces a dormancy related gene expression signature instead. Also, IκBα deficient HSCs respond with superior activation to in vitro culture and in serial transplantation. At the molecular level, chromatin regions harboring binding motifs for retinoic acid signaling are hypo-methylated for the PRC2 dependent H3K27me3 mark in IκBα deficient HSCs. Overall, we show that the proliferation index in the developing HSCs is regulated by a IκBα-PRC2 axis, which controls retinoic acid signaling.


Conflict of interest statement

The authors declare no competing interests.

Figures

Fig. 1
Fig. 1. NF-κB signaling is enriched in AGM-derived HSCs.
A UMAP projection colored by scRNAseq clusters where different HSC populations are highlighted. Single-cell RNA-sequencing data derived from Zhou et al.. EC = CD31+Cdh5+CD41-CD43-CD45-; T1 PreHSC = CD31+cKIT+CD41lowCD201highCD45-; T2 PreHSC = CD31+cKIT+CD201highCD45+; E12 FL-HSC= lin-SCA+CD201highMac1low; E14 FL-HSC = CD45+CD201CD48-CD150+; adult BM-HSC= lin-SCA1+cKIT+CD135-CD34- CD48-CD150+ (B), enrichment score analysis of indicated HSC populations for inflammatory, NF-κB pathway and NF-κB signaling molecules. Boxplot shows indicate the upper- (75%) and lower- (25%) percentile, with the median value shown as a solid black line. Statistical significance determined with a two-sided t-test. No adjustments were made for multiple comparisons. *** < 0.001, ** < 0.01, * < 0.05 (C), GSEA results comparing T1/T2 HSC cells to FL-HSC (left) or endothelial cells (EC) to T1/T2 HSC for correlation to the Hallmark “TNFA_SIGNALING_VIA_ NF-κB” gene set. The indicated p-value is a nominal p-value obtained from GSEA. D UMAP projection colored by the expression of selected genes from the NF-κB signaling pathway.
Fig. 2
Fig. 2. IκBα loss leads to decreased numbers of LT-HSCs at newborn and fetal stages.
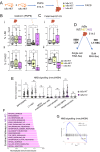
A Scheme of the mouse mating to obtain IκBα WT, HET, and KO hematopoietic tissues. B Box plot with individual values of the frequency of (i) LSK (lin-SCA1+cKIT+) in the liver or bone marrow of newborn (P5/6) both obtained from n = 39 pups in 5 independent experiments and, (ii) LT-HSCs (LSKCD48-CD150+) from the previous gate (LSK) in the liver of newborn (P5/6) IκBα WT (n = 12), HET (n = 20) and KO (n = 7) and in the bone marrow of newborn (P5/6) IκBα WT (n = 11), HET (n = 18) and KO (n = 6). C Box plot with individual values of the frequency of (i) LSK in the fetal liver of E14.5 IκBα WT (n = 7), HET (n = 11) and KO (n = 11), and (ii) LT-HSCs (LSKCD48-CD150+) in E14.5 IκBα WT (n = 7), HET (n = 11) and KO (n = 11), both cased obtained from n = 19 embryos in 3 independent experiments. Statistical test for (B), (C): unpaired two-tailed Dunn’s non-parametric all-pairs comparison test after Kruskal–Wallis test (**p-value < 0.01, *p-value < 0.05, ns p-value > 0.05). Boxplots show the median (center line) first and third quartiles (box limits), and whiskers extend to minimum and maximum values. D Scheme illustrating the two strategies followed to explore the molecular changes in IκBα WT, HET, and KO. E14.5 FL were FACS sorted to obtain 5000 LSK cells for single-cell RNA-sequencing and 500 cells/sample of LT-HSCs for bulk RNA-sequencing. n = 4 embryos per genotype. E Violin plots with individual values depicting the expression levels from scRNAseq data of genes from NF-κB signaling (KEGG ID mmu04064) signature within each annotated cell population. Statistical test: two-tailed Wilcoxon rank sum test (ns p-value > 0.05). F Bar plot depicting significantly enriched MSigDB HALLMARK pathways in IκBα KO against WT/HET genotypes with positive Normalized Enrichment Score (NES), identified by GSEA from the bulk RNA-seq data (Benjamini–Hochberg procedure (FDR) adjusted p-value < 0.05). Bars sorted by NES. G NF-kB signaling signature (KEGG ID mmu04064) GSEA over the bulk RNA-seq data comparing IκBα WT/HET and KO LT-HSCs. Indicated p-value is a nominal p-value obtained from GSEA. Source data are provided as a Source Data file. AD created with BioRender.com released under a Creative Commons Attribution-NonCommercial-NoDerivs 4.0 International license.
Fig. 3
Fig. 3. IκBα KO LT-HSCs maintain an AGM-specific HSC gene expression program.
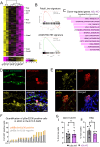
A Heatmap of 1476 differentially expressed genes (DEGs) from the comparison of IκBα KO against WT/HET samples. DEGs were called with absolute shrunken logFC > 1 and adjusted p-values (Benjamini–Hochberg procedure, FDR < 0.05). A Wald-test was applied for DEG analysis. B GSEA comparing IκBα WT/HET and KO LT-HSCs bulk RNA-seq data against the top 300 genes defining (top panel) fetal liver LT-HSCs signature (Manesia et al.) or (bottom panel) AGM HSCs (Thambyrajah et al. 2023). Indicated p-value is a nominal p-value obtained from GSEA (C), Bar plot depicting significantly enriched MSigDB HALLMARK pathways in IκBα KO compared to WT/HET with negative Normalized Enrichment Score (NES) and identified by GSEA from the bulk RNA-seq data (Benjamini–Hochberg procedure (FDR) adjusted p-value < 0.05). D IHC on E11.5 (43–45 s) sagittal AGM section for endothelial marker (DLL4, green) and IκBα (yellow) and DAPI (blue) on Gfi1:tomato (red) embryos. Representative image from n = 4 WT and 5 KO AGM 12 um sections derived from 2 embryos for each genotype. Scale bar: 20 μm. Imaged using an SPE (Leica) with a 20× oil lens. E IHC on E11.5 (42–45 somites) cross-section of AGM for pSer32/36 IκBα (yellow), cKIT (red), and DAPI (blue). Scale bar: 10 μm. Images were taken using an SPE (Leica) with a 20× oil lens and processed using Imaris. F Bar chart depicting the number of p-IκBα Ser32/36 positive cells within cKIT+ IAHC at E10.5 (12 embryos of 33–36 somites). Each bar represents one IAHC. Counts were performed manually. Imaged using an SPE (Leica) with a 20x oil lens. G Bar chart depicting individual values for the frequency of (i) cKIT+(IAHC) in CD31+ cells and (ii) SCA1+EPCR+ positive cells within IAHC of E11.5 (42–46 somites) AGMs of IκBα WT (n = 7) and KO (n = 6) in 3 independent experiments. Statistical test: Multiple linear regression model with Experiment and Genotype covariates, significance obtained from applying t-test to corresponding model coefficient estimate (*p-value < 0.05, ns p-value > 0.05). Bars indicate mean values and error bars refer to ± standard deviation. Source data are provided as a Source Data file.
Fig. 4
Fig. 4. IκBα associates with the PRC2 complex and regulates retinoic acid receptors Rarα and Rarγ.
A Bar plot of enriched ChIP data sets from ChEA to in comparison to up-regulated genes in IκBα KO in the bulk RNA-seq data (FDR adjusted p-value < 0.05). NES: Normalized Enrichment Score, asterisks = TF mentioned in the text. B Proximity Ligation assay (PLA) for IκBα and EZH2 on E11.5 (43–46 somites) AGM sections (yellow), endothelial cells (magenta), and nuclear staining (DAPI). Scale bar: 20 μm. Representative image of 3 embryos in 3 independent experiments. Imaged with Stellaris8 (Leica) using a 20× oil lens. C Cut and Tag (C&T) for IκBα on E11.5 AGM (42–46 somites) derived CD31+cells (n = 35 embryos) and E14.5 LT-HSCs (n = 15 embryos). Read pile-ups in the IGV browser at the promoters of Rarα (CD31+) and Rarγ in LT-HSCs are indicated with a yellow line (n = 4 independent experiments). D Heatmap showing the expression levels of RARγ target genes (TRANSFAC TF:M10353) in the RNA-seq samples of E14.5 LT-HSCs from IκBα WT/HET and KO. vertical bar = identified as DEG (light green). E C&T for H3K27me3 in E14.5 LT-HSCs from IκBα WT and KO. Depicted are reads pile-ups in the IGV browser at the promoter of Rarγ (peaks regions, black line = WT, magenta line = KO). n = 5 WT and 8 KO embryos in two independent experiments. F Venn diagram of genes associated with the H3K27me3 peaks detected in E14.5 LT-HSCs of IκBα WT and KO. 457 and 854 genes are exclusively detected in IκBα WT and KO, respectively. Discovered motif (STREME) and associated TF are shown for the unique peaks in IκBα WT. G quantitative PCR (qPCR) for Rarγ expression levels comparing IκBα WT and KO derived E11.5 (42–45 somites) CD31+cKIT- (endothelial cells, WT n = 4, KO n = 3) and CD31+cKIT+ (IAHC, WT n = 4, KO n = 4) samples obtained from n = 2 AGMs per genotype in one experiment. Statistical test: unpaired one-tailed Mann–Whitney U-test (*p-value < 0.05, ns p-value > 0.05). Bars indicate mean values and error bars refer to ± standard deviation. Source data are provided as a Source Data file. C, E created with BioRender.com released under a Creative Commons Attribution-NonCommercial-NoDerivs 4.0 International license.
Fig. 5
Fig. 5. IκBα KO (LT)- HSC are slow-cycling/dormant and can be mobilized by RARα inhibition.
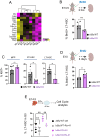
A Heatmap showing the scaled expression levels of dormancy-associated genes (Cabeza-Wallscheid, 2017) from IκBα WT/Het and KO E14.5 LT-HSCs RNA-seq samples. B Bar chart with the frequencies of BrdU+ E14.5 LT-HSC after 2 h. in vivo labeling with BrdU in E13.5 IκBα WT (n = 6) or KO (n = 4) obtained from n = 10 embryos in 2 independent experiments. Statistical test: unpaired one-tailed t-test with Welch correction (**p-value < 0.01). Bars indicate mean values and error bars refer to ± standard deviation. C Bar chart with percent of Ki67+ cells in indicated cell populations of E14.5 IκBα WT (n = 7) or KO (n = 3). MPP =  multipotent progenitors, ST = Short-term HSCs. n = 7 embryos. Statistical test: unpaired one-tailed Mann–Whitney U-test (*p-value < 0.05, ns p-value > 0.05). Bars indicate mean values, and error bars refer to ± standard deviation. D Bar chart with the percent of BrdU+ cells within the E14.5 FL LT-HSC after in vivo labeling of E10.5 IκBα WT (n = 5) or KO (n = 4) embryos. Statistical test: unpaired one-tailed t-test with Welch correction (*p-value < 0.05). Bars indicate mean values, and error bars refer to ± standard deviation. E Bar chart with the percentage of LT-HSC in G0 phase of the cell cycle after 48 h of ex vivo culture of E14.5 IκBα WT (n = 7) or KO (n = 3) FL lin- cells treated with 10 uM of Ro-41 or DMSO. Data originates from 2 independent experiments with 10 embryos. Statistical test: paired one-tailed t-test for Ro-41 against DMSO comparisons and unpaired one-tailed t-test with Welch correction for WT against KO, in DMSO, comparison (**p-value < 0.01). The horizontal lines indicate mean values and error bars refer to ± standard deviation. Source data are provided as a Source Data file. B, D, E were created with BioRender.com released under a Creative Commons Attribution-NonCommercial-NoDerivs 4.0 International license.
Fig. 6
Fig. 6. IκBα KO LT- HSC are functionally slow cycling/dormant and are mobilized in stress situations.
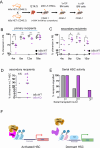
A Scheme of the transplantation experiment. LT-HSCs were FACS purified from E14.5 IκBα WT and KO fetal liver (CD45.2) and transplanted serially into lethally irradiated donors (CD45.1). B Scatter plot with the percentage of donor chimerism (CD45.2) in the peripheral blood of primary recipient (CD45.1) in 4-week intervals with n = 5 WT and n = 6 KO recipients. Recipients of 200 purified LT-HSCs from E14.5 fetal liver of pools of 3 WT and 4 KO IκBα embryos. Statistical test: unpaired one-tailed Mann–Whitney U-test for all pairwise comparisons (**p-value < 0.01, ns p-value > 0.05). The horizontal lines indicate mean values. C Scatter plot with the percentage of donor chimerism (CD45.2) in the peripheral blood of the secondary recipient (CD45.1) in 4-week intervals. Each secondary recipient received 1 × 106 nucleated bone marrow cells from individual primary recipients with n = 5 WT and n = 5 KO recipients. Statistical test: unpaired one-tailed Mann–Whitney U-test for all pairwise comparisons (*p-value < 0.05, ns p-value > 0.05). The horizontal lines indicate mean values. D Scatter plot showing the percentages of donor chimerism (CD45.2) in the bone marrow LT-HSC compartment of secondary recipients (from C) at 16w. The horizontal lines indicate mean values. Ratios indicate the number of animals with chimerism >1% E Bar chart depicting the percentage of animals reconstituted with more than 10% of donor cells (IκBα WT or KO) at each round of serial transplantation. F Schematic summary of the main findings i IκBα associates with PRC2 complex at RAR gene promoters and silences RA signaling after a stress stimulus. ii in the absence of IκBα, this silencing is lost, and RA signaling is hyper-activated. Source data are provided as a Source Data file. A, F created with BioRender.com released under a Creative Commons Attribution-NonCommercial-NoDerivs 4.0 International license.

Similar articles

Cited by

References

    1. Challen GA, Boles N, Lin KKY, Goodell MA. Mouse hematopoietic stem cell identification and analysis. Cytom. Part A. 2009;75:14–24. doi: 10.1002/cyto.a.20674. - DOI - PMC - PubMed
    1. Slukvin II. Generating human hematopoietic stem cells in vitro -exploring endothelial to hematopoietic transition as a portal for stemness acquisition. FEBS Lett. 2016;590:4126–4143. doi: 10.1002/1873-3468.12283. - DOI - PMC - PubMed
    1. Cumano A, Ferraz JC, Klaine M, Di Santo JP, Godin I. Intraembryonic, but not yolk sac hematopoietic precursors, isolated before circulation, provide long-term multilineage reconstitution. Immunity. 2001;15:477–485. doi: 10.1016/S1074-7613(01)00190-X. - DOI - PubMed
    1. Medvinsky A, Dzierzak E. Definitive hematopoiesis is autonomously initiated by the AGM region. Cell. 1996;86:897–906. doi: 10.1016/S0092-8674(00)80165-8. - DOI - PubMed
    1. North TE, et al. Runx1 expression marks long-term repopulating hematopoietic stem cells in the midgestation mouse embryo. Immunity. 2002;16:661–672. doi: 10.1016/S1074-7613(02)00296-0. - DOI - PubMed

MeSH terms