. 2024 Jun 1;15(1):4682.
doi: 10.1038/s41467-024-48971-1.

Area postrema neurons mediate interleukin-6 function in cancer cachexia

Affiliations

Area postrema neurons mediate interleukin-6 function in cancer cachexia

Qingtao Sun et al. Nat Commun. .

Abstract

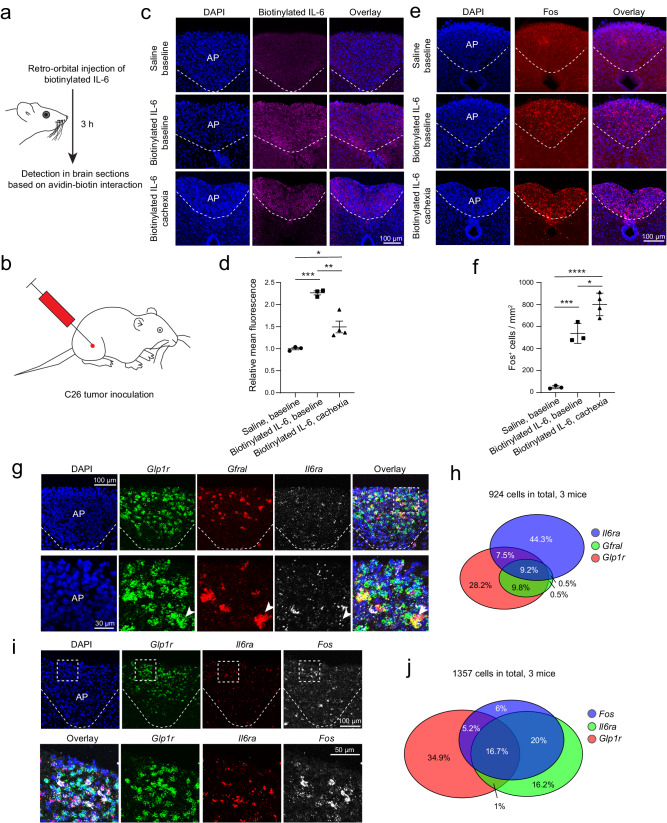
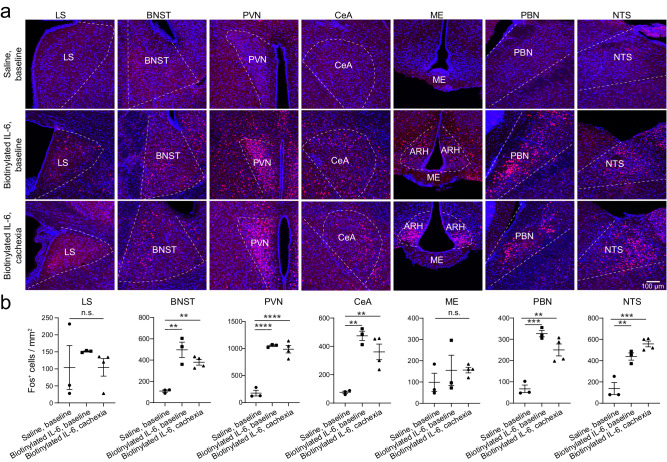
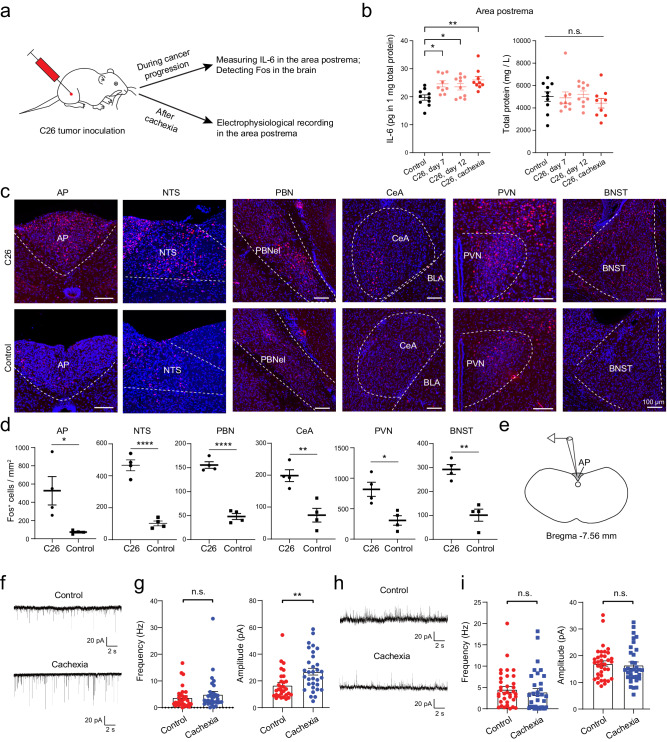
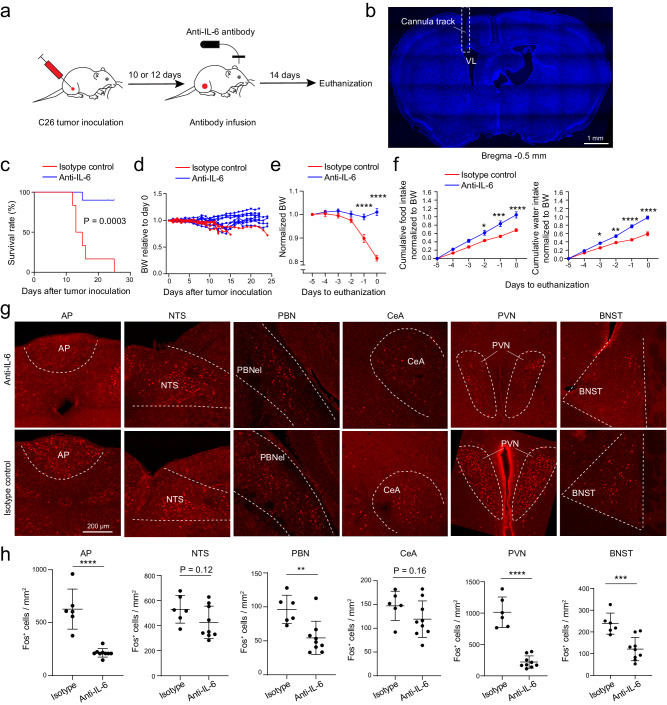
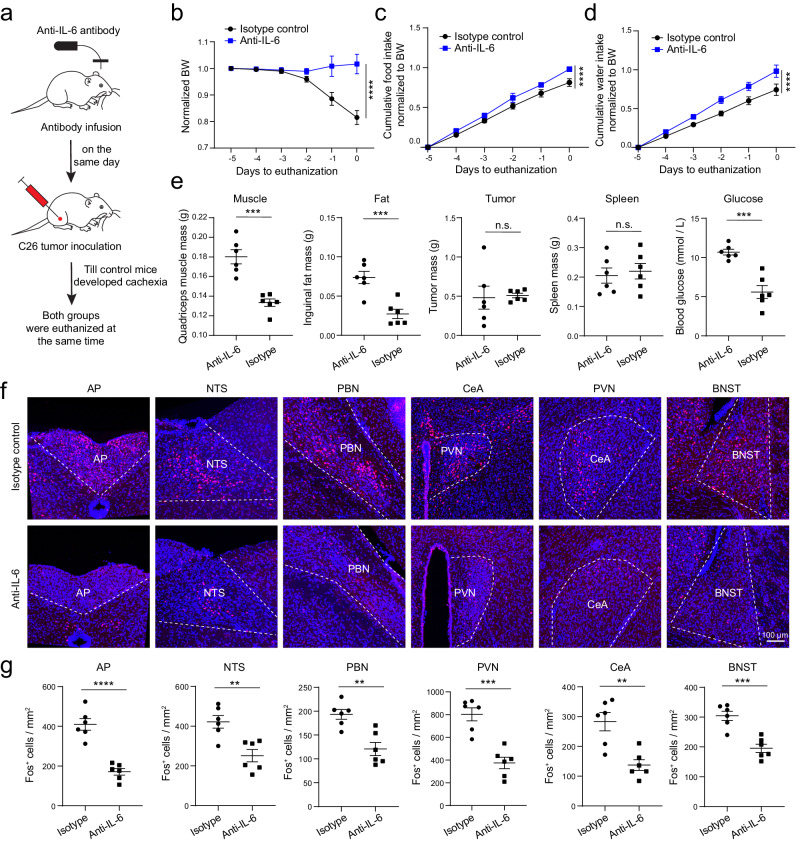
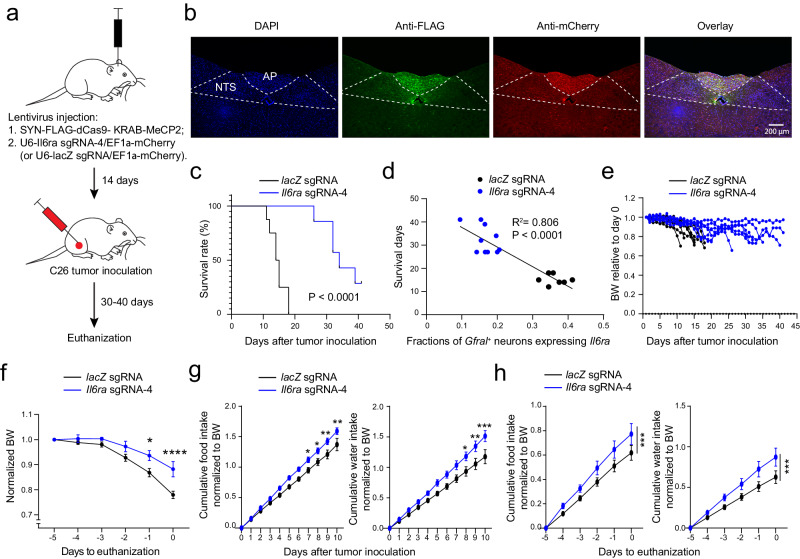
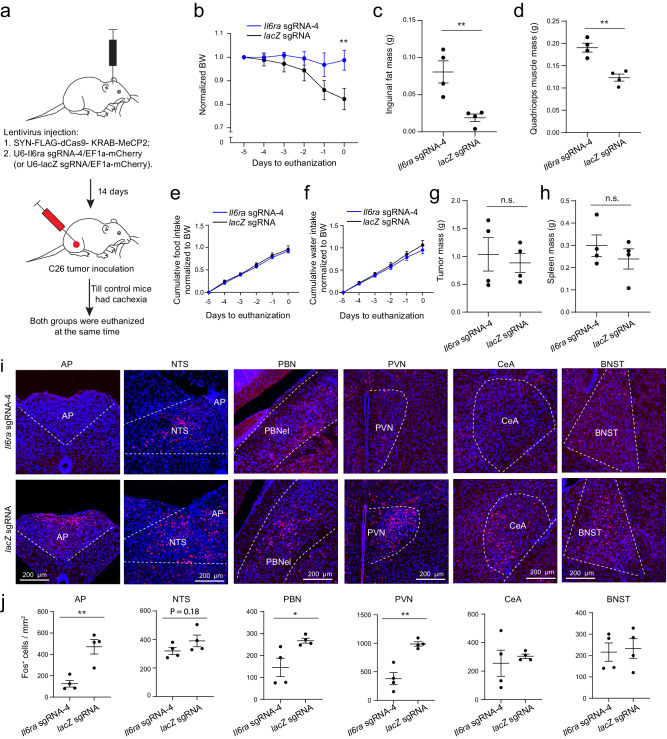
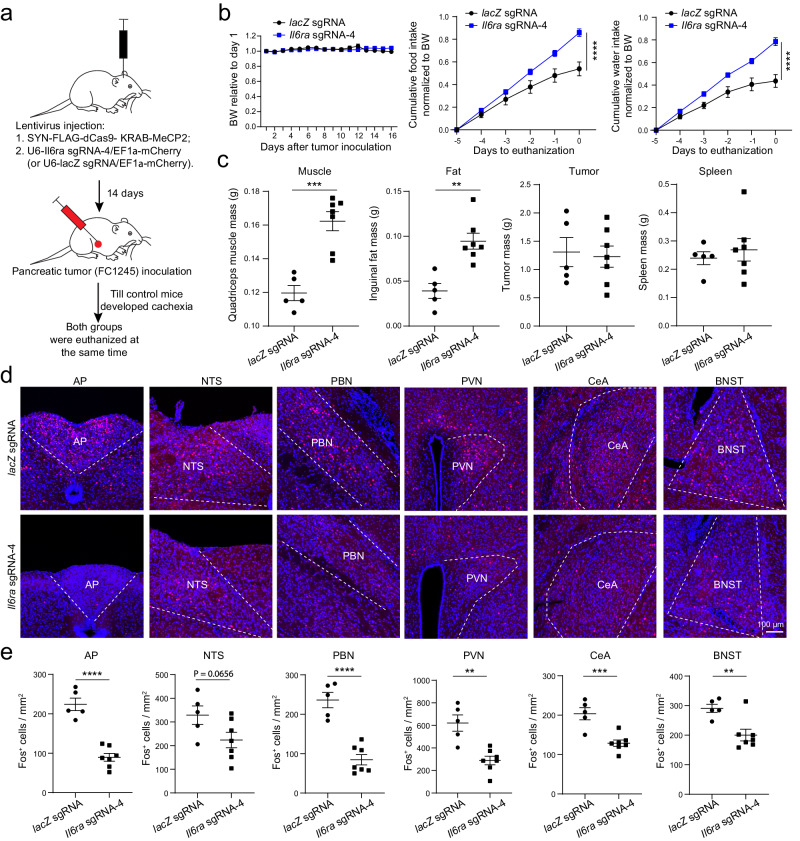
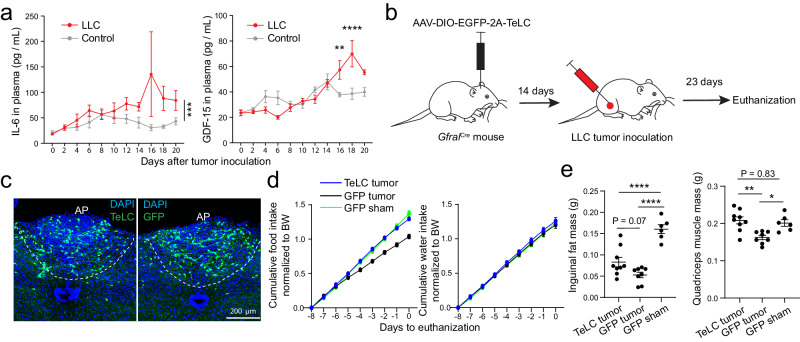
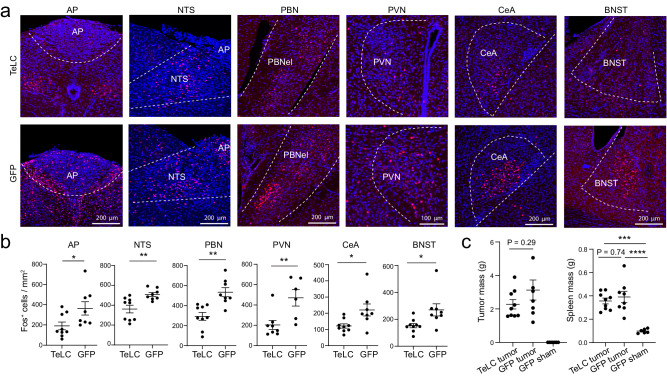
Interleukin-6 (IL-6) has been long considered a key player in cancer cachexia. It is believed that sustained elevation of IL-6 production during cancer progression causes brain dysfunctions, which ultimately result in cachexia. However, how peripheral IL-6 influences the brain remains poorly understood. Here we show that neurons in the area postrema (AP), a circumventricular structure in the hindbrain, is a critical mediator of IL-6 function in cancer cachexia in male mice. We find that circulating IL-6 can rapidly enter the AP and activate neurons in the AP and its associated network. Peripheral tumor, known to increase circulating IL-6, leads to elevated IL-6 in the AP, and causes potentiated excitatory synaptic transmission onto AP neurons and AP network hyperactivity. Remarkably, neutralization of IL-6 in the brain of tumor-bearing mice with an anti-IL-6 antibody attenuates cachexia and the hyperactivity in the AP network, and markedly prolongs lifespan. Furthermore, suppression of Il6ra, the gene encoding IL-6 receptor, specifically in AP neurons with CRISPR/dCas9 interference achieves similar effects. Silencing Gfral-expressing AP neurons also attenuates cancer cachectic phenotypes and AP network hyperactivity. Our study identifies a central mechanism underlying the function of peripheral IL-6, which may serve as a target for treating cancer cachexia.


Conflict of interest statement

Q.S., D.V.D.L. and B.L. are listed as inventors on a patent application concerning the development of new strategies for treating cancer cachexia. All other authors declare no competing interests.

Figures

Fig. 1
Fig. 1. Circulating IL-6 can reach the area postrema (AP) and activate AP neurons.
a, b Schematics of the approach for retro-orbital injection of biotinylated IL-6 (a) and C26 tumor inoculation (b). c Confocal images showing the binding of the exogenous IL-6 to cells in the AP. d Quantification of the fluorescence signals from fluorescence-conjugated avidin in the AP, which recognizes the biotinylated exogenous IL-6 (n = 3, 3, and 4 mice for saline baseline, IL-6 baseline, and IL-6 cachexia groups, respectively; F = 37.68, P = 0.0002, *P = 0.0212, ** P = 0.002, ***P = 0.001, one-way ANOVA followed by Tukey’s multiple comparison test.). e Confocal immunohistochemical images showing Fos expression in the AP. f Quantification of Fos-expressing (Fos+) cells in the AP (n = 3, 3, and 4 mice for saline baseline, IL-6 baseline, and IL-6 cachexia groups, respectively; F = 71.02, P = 0.000022, *P = 0.0103, ***P = 0.00044, ****P = 0.000017, one-way ANOVA followed by Tukey’s multiple comparison test). g Confocal images showing the expression of different genes in AP cells, detected with single molecule fluorescent in situ hybridization (smFISH). At the bottom are higher magnification images of the boxed area in the overlay image on the top. Arrowheads indicate a neuron that expresses all three genes. n = 3 mice. h A Venn diagram showing the relationships among cells expressing Il6ra, Gfral, and Glp1r in the AP. i Characterization of the types of Fos+ cells in the AP by smFISH. At the bottom are higher magnification images of the boxed areas in images on the top. n = 3 mice. j A Venn diagram showing the relationships among cells expressing Fos, Il6ra, and Glp1r in the AP. Data in d & f are presented as mean ± s.e.m. Source data are provided as a Source Data file.
Fig. 2
Fig. 2. Fos expression in different brain areas after retro-orbital injection of IL-6.
a Confocal immunohistochemical images showing Fos expression in different brain areas. b Quantification of Fos expression in different brain areas (n = 3, 3, 4 mice in saline baseline, IL-6 baseline, and IL-6 cachexia groups, respectively; LS, F = 0.5, P = 0.63 (n.s., nonsignificant); BNST, F = 21, P = 0.0011, **P = 0.001, **P = 0.0055; PVN, F = 66.65, P = 0.00003, ****P = 0.00005, ****P = 0.00005; CeA, F = 20.52, P = 0.0012, **P = 0.0011, **P = 0.0052; ME, F = 0.55, P = 0.6; PBN, F = 30.25, P = 0.0004, ***P = 0.0003, **P = 0.002; NTS, F = 30.15, P = 0.0004, **P = 0.0033, ***P = 0.0003; one-way ANOVA followed by Tukey’s multiple comparison test). LS, lateral septum; BNST, bed nucleus of the stria terminalis; PVN, paraventricular nucleus of hypothalamus; CeA, central amygdala; ME, median eminence; PBN, parabrachial nucleus; NTS, nucleus tractus solitarii. Data in b are presented as mean ± s.e.m. Source data are provided as a Source Data file.
Fig. 3
Fig. 3. C26 cancer causes increased IL-6 and neuron hyperactivity in the AP.
a A schematic of the experimental procedure. b IL-6 levels in the area postrema (AP) during cancer progression. IL-6 levels were normalized to total protein levels (n = 8-10 mice in each group; left, IL-6, F = 5.883, P = 0.0024, *P = 0.011, *P = 0.0483, **P = 0.001; right, total protein, F = 0.61, P = 0.61 (n.s., nonsignificant); one-way ANOVA followed by Tukey’s post-hoc test). c Confocal immunohistochemical images showing Fos expression in different brain areas in tumor-bearing (top) or control (bottom) mice. d Quantification of Fos+ cells in different brain areas (n = 4 mice in each group; AP, t = 2.91, *P = 0.027, NTS, T = 9.77, ****P = 6.62×10⁻⁵, PBN, t = 11.65, ****P = 2.41 × 10−5, CeA, t = 4.37, **P = 0.0047, PVN, t = 3.65, *P = 0.011, BNST, t = 5.86, **P = 0.0011; unpaired t test). e A diagram showing the AP in a coronal brain section for electrophysiological recording. f Representative miniature EPSC traces from AP neurons in control (top) and cachectic (bottom) mice. g Quantification of miniature EPSC frequency (left) and amplitude (right) (control, n = 30 cells / 6 mice, cachexia, n = 32 cells / 7 mice; frequency, n.s. (nonsignificant), P = 0.2513, amplitude, **P = 0.0017, Mann-Whitney test). h Representative spontaneous IPSC traces from AP neurons in control (top) and cachectic (bottom) mice. i Quantification of spontaneous IPSC frequency (left) and amplitude (right) (control, n = 36 cells / 7 mice, cachexia, n = 34 cells / 6 mice; frequency, n.s., P = 0.1637, amplitude, n.s., P = 0.4580, Mann-Whitney test). AP, area postrema; NTS, nucleus tractus solitarii; PBN, parabrachial nucleus; CeA, central amygdala; PVN, paraventricular nucleus of hypothalamus; BNST, bed nucleus of the stria terminalis. Data in b, d, g, i are presented as mean ± s.e.m. Source data are provided as a Source Data file.
Fig. 4
Fig. 4. Intracerebroventricular (i.c.v.) infusion of anti-IL-6 antibody before cachexia onset prevents cachexia in the C26 cancer model.
a A schematic of the experimental procedure. b A confocal image of a coronal brain section from a representative mouse, showing the location of the infusion cannula above the lateral ventricle (VL). c Survival curves of the mice after tumor inoculation (anti-IL-6 group, n = 10, isotype control group, n = 6; P = 0.0003, Mantel-Cox test). d Bodyweight of individual mice relative to their bodyweight on the day of tumor inoculation. e Average bodyweight normalized to that on day -5 (anti-IL-6, n = 10, isotype control, n = 6; F(1,84) = 75.13, P = 2.77 × 10⁻¹³; day -1, ****P = 1.2 × 10⁻⁶, day 0, ****P < 1 × 10⁻¹⁵; two-way repeated-measures (RM) ANOVA followed by Sidak’s post hoc test). f. Normalized cumulative food (left) and water (right) intake of the mice before being euthanized (anti-IL-6, n = 10, isotype control, n = 6 mice; food, F(1,84) = 42.45, P = 5.08 × 10⁻⁹, day -2, *P = 0.045, day -1, ***P = 0.00018, day 0, ****P = 0.0000047; water, F(1,84) = 112.2, P < 1 × 10⁻¹⁵, day -3, *P = 0.034, day -2, **P = 0.0011, day -1, ****P = 2.17 × 10⁻¹¹, day 0, ****P = 7 × 10⁻¹⁵; two-way RM ANOVA with Sidak’s post hoc test). g. Confocal immunohistochemical images showing Fos expression in different brain areas in the mice infused with the anti-IL-6 antibody (top) and the control antibody (bottom). h. Quantification of Fos+ cells in different brain areas (anti-IL-6, n = 9 mice, isotype control, n = 6 mice; AP, t = 8.11, ****P = 1.83 × 10⁻¹¹, NTS, t = 1.62, P = 0.12, PBN, t = 0.8213, P = 0.41, CeA, t = 0.1375, P = 0.89, PVN, t = 15.55, ****P < 10−15, BNST, t = 2.302, *P = 0.0245; t test with false discovery rate adjusted). AP, area postrema; NTS, nucleus tractus solitarii; PBN, parabrachial nucleus; CeA, central amygdala; PVN, paraventricular nucleus of hypothalamus; BNST, bed nucleus of the stria terminalis. Data in e, f, h are presented as mean ± s.e.m. Source data are provided as a Source Data file.
Fig. 5
Fig. 5. Intracerebroventricular (i.c.v.) infusion of anti-IL-6 antibody before tumor inoculation prevents cachexia in the C26 cancer model.
a A schematic of the experimental procedure. b Average bodyweight (BW) normalized to that on day -5 (anti-IL-6, n = 6, isotype control, n = 6; F(1,60) = 28.46, ****P = 1.53×10⁻⁶, two-way repeated-measures (RM) ANOVA followed by Sidak’s post hoc test). c and d Normalized cumulative food (c) and water (d) intake of the mice before being euthanized (n = 6 animals in each group; c, F(1,60) = 19.31, ****P = 4.6×10⁻⁵; d, F(1,60) = 26.06, ****P = 3.6×10⁻⁶, two-way RM ANOVA followed by Sidak’s post hoc test). e The effects of anti-IL-6 pretreatment (n = 6 mice in each group; muscle, t = 5.72, ***P = 0.0002; fat, t = 4.74, ***P = 0.0008; tumor, t = 0.18, P = 0.858 (n.s., nonsignificant); spleen, t = 0.4, P = 0.7 (n.s.); glucose, t = 5.66, ***P = 0.0002; unpaired t test). f Confocal immunohistochemical images showing Fos expression in different brain areas in the mice infused with the isotype antibody (top) and the anti-IL-6 antibody (bottom). g Quantification of Fos+ cells in different brain areas (n = 6 mice in each group, AP, t = 7.03, ****P = 3.6 × 10−5; NTS, t = 3.87, **P = 0.003; PBN, t = 4.2, **P = 0.0018; PVN, t = 5.62, ***P = 0.0002; CeA, t = 4.08, **P = 0.0022; BNST, t = 5.21, ***P = 0.0004; unpaired t test.). AP, area postrema; NTS, nucleus tractus solitarii; PBN, parabrachial nucleus; CeA, central amygdala; PVN, paraventricular nucleus of hypothalamus; BNST, bed nucleus of the stria terminalis. Data in be, g are presented as mean ± s.e.m. Source data are provided as a Source Data file.
Fig. 6
Fig. 6. Suppression of Il6ra expression in AP neurons attenuates cachexia in the C26 cancer model.
a A schematic of the experimental procedure. b Confocal immunohistochemical images of a coronal brain section from a representative mouse, showing the infection of AP cells with lentiviruses expressing the sgRNA (tagged with mCherry) and dCas9-KRAB-MeCP2 (tagged with FLAG). mCherry and FLAG were recognized by antibodies. The yellow cells in the overlay image indicate the dual-color labeled cells. lacZ sgRNA, n = 8, Il6ra sgRNA-4, n = 7. c Survival curves of the mice after tumor inoculation (lacZ sgRNA, n = 8, Il6ra sgRNA-4, n = 7; P = 0.000013, Mantel-Cox test). d Relationship between survival days and the fractions of Gfral+ neurons expressing Il6ra (n = 17 mice, R2 = 0.806, F test, F = 62.34, P = 10−6 by a linear regression). e Bodyweight of individual mice relative to their bodyweight on the day of tumor inoculation. f Average bodyweight normalized to that on day -5 (lacZ sgRNA, n = 8, Il6ra sgRNA-4, n = 7; F(1,78) = 23.63, P = 9.6 × 10⁻⁶, *P = 0.012, ****P = 0.00004, two-way repeated-measures (RM) ANOVA with Sidak’s post hoc test). g Normalized cumulative food (left) and water (right) intake of the mice after tumor inoculation (lacZ sgRNA, n = 8, Il6ra sgRNA-4, n = 7; food, F(1130) = 46.9, P = 2.04 × 10⁻¹⁰; day 7, *P = 0.046, day 8, *P = 0.026, day 9, **P = 0.0046, day 10, **P = 0.003; water, F(1130) = 43.87, P = 6.6 × 10⁻¹⁰; day 8, *P = 0.03, day 9, **P = 0.005, day 10, ***P = 0.0006; two-way RM ANOVA with Sidak’s post hoc test). h Normalized cumulative food (left) and water (right) intake of the mice in the 5 days before being euthanized (lacZ sgRNA, n = 8, Il6ra sgRNA-4, n = 7; food, F(1,65) = 12.82, ***P = 0.0006; water, F(1,65) = 16.37, ***P = 0.00012; two-way RM ANOVA with Sidak’s post hoc test). AP, area postrema; NTS, nucleus tractus solitarii. Data in f, g, h are presented as mean ± s.e.m. Source data are provided as a Source Data file.
Fig. 7
Fig. 7. Suppression of Il6ra expression in AP neurons attenuates cachexia and reduces the hyperactivity in the AP network in the C26 cancer model.
a A schematic of the experimental procedure. When one animal in the lacZ sgRNA (control) group became cachectic, that animal and a randomly selected animal in the Il6ra sgRNA-4 group were euthanized to check Fos expression and other phenotypes. b Average bodyweight normalized to that on day -5 (F(1,36) = 10.45, P = 0.0026, **P = 0.0072, two-way repeated-measures (RM) ANOVA with Sidak’s post hoc test, lacZ sgRNA group, n = 4 mice, Il6ra sgRNA-4 group, n = 4 mice). c Inguinal fat mass (t = 3.941, **P = 0.0079, t test). d Quadriceps muscle mass (t = 5.26, **P = 0.0019, t test). e, f Normalized cumulative food (e) and water (f) intake of the mice before being euthanized (food, F(1, 36) = 1.83, P = 0.18; water, F(1, 36) = 1.824, P = 0.19; two-way RM ANOVA with Sidak’s post hoc test). g, h Tumor (g) and spleen (h) mass of the mice (tumor, t = 0.444, P = 0.6725; spleen, t = 0.898, P = 0.404; t test). i Confocal immunochemical images showing Fos expression in different brain areas in representative mice of the two groups. j Quantification of Fos+ cells in different brain areas (AP, t = 4.617, **P = 0.0036; NTS, t = 1.5, P = 0.18; PBN, t = 2.849, *P = 0.029; PVN, t = 5.332, **P = 0.0018; CeA, t = 0.5267, P = 0.617; BNST, t = 0.27, P = 0.796; t test with false discovery rate adjusted). AP, area postrema; NTS, nucleus tractus solitarii; PBN, parabrachial nucleus; PVN, paraventricular nucleus of hypothalamus; CeA, central amygdala; BNST, bed nucleus of the stria terminalis. Data in b-h & j are presented as mean ± s.e.m. Source data are provided as a Source Data file.
Fig. 8
Fig. 8. Suppression of Il6ra expression in AP neurons attenuates cachexia in the pancreatic cancer model.
a A schematic of the experimental procedure. b Normalized bodyweight (BW; left), food intake (middle), and water intake (right). Bodyweight was normalized to the initial bodyweight when tumor was implanted. Bodyweight, F(1,130) = 0.0021, P = 0.96. Food intake, F(1,60) = 41.91, ****P = 1.96 × 10⁻⁸. Water intake, F(1,60) = 69.55, ****P = 1.3 × 10⁻¹¹. n = 5 and 7 mice in lacZ sgRNA (control) group and Il6ra sgRNA-4 group, respectively. Two-way RM ANOVA with Sidak’s post hoc test. c The effects of suppressing Il6ra expression (n = 5 and 7 mice in lacZ sgRNA (control) group and Il6ra sgRNA-4 group, respectively; muscle, t = 5.51, ***P = 0.0003; fat, t = 4.37, **P = 0.0014; tumor, t = 0.26, P = 0.8014; spleen, t = 0.574, P = 0.5786, unpaired t test). d Confocal immunohistochemical images showing Fos expression in different brain areas in control group (top) and in Il6ra knock-down group (bottom). e Quantification of Fos expression in different brain areas (n = 5 and 7 mice in lacZ sgRNA (control) group and Il6ra sgRNA-4 group, respectively; AP, t = 7.58, ****P = 1.88 × 10⁻⁵; NTS, t = 2.07, P = 0.0656; PBN, t = 6.78, ****P = 4.84 × 10⁻⁵; PVN, t = 4.4, **P = 0.0013; CeA, t = 4.64, ***P = 0.0009; BNST, t = 3.41, **P = 0.0066. Unpaired t test). AP, area postrema; NTS, nucleus tractus solitarii; PBN, parabrachial nucleus; PVN, paraventricular nucleus of hypothalamus; CeA, central amygdala; BNST, bed nucleus of the stria terminalis. Data in b, c, e are presented as mean ± s.e.m. Source data are provided as a Source Data file.
Fig. 9
Fig. 9. Inhibition of Gfral+ AP neurons attenuates cachexia in the Lewis lung cancer (LLC) model.
a Plasma IL-6 (left) and GDF-15 (right) concentrations (IL-6: control, 7 mice except day 2 and 8, where there are 5 mice; LLC, 8 mice except day 4 where there are 6 mice, day 6 and 12 where there are 11 mice, and day 10 and 18 where there are 7 mice; F(1128) = 14.12, ***P = 0.0003, two-way repeated-measures ANOVA with Sidak’s post hoc test; GDF-15: control, 5 mice except day 0 and 14 where there are 8 and 3 mice, respectively; LLC, 5 mice except day 0 where there are 7 mice; F(1,91) = 2.571, P = 0.11, **P = 0.007, ****P = 1.74 × 10⁻⁶, two-way repeated-measures ANOVA with Sidak’s post hoc test). b A schematic of the experimental procedure. c Confocal immunohistochemical images of coronal brain sections from two representative mice, showing the infection of Gfral+ AP neurons with an AAV expressing TeLC-GFP (left) or GFP only (right). TeLC tumor group, n = 9, GFP tumor group, n = 8, GFP sham group, n = 6. d Normalized cumulative food (left) and water (right) intake of the mice before being euthanized (TeLC tumor, n = 9, GFP tumor, n = 8, GFP sham, n = 6; food, F(2,180) = 98.25, P = 10−15; from day −4 to 0: TeLC tumor vs. GFP tumor, P = 0.00004, 9.48 × 10⁻⁹, 1.36 × 10⁻¹¹, 10−15, and P = 10−15, respectively; GFP tumor vs. GFP sham, P = 0.0016, 1.66 × 10⁻⁵, 7.7 × 10⁻⁹, 10−15, and 10−15, respectively; water, F(2180) = 2.889, P = 0.06; two-way repeated-measures ANOVA with Sidak’s post hoc test). e Inguinal fat (left) and quadriceps muscle (right) mass at 23 days after tumor inoculation (TeLC tumor, n = 9, GFP tumor, n = 8, GFP sham, n = 6; fat, F = 28.74, P = 1.3 × 10⁻⁶, ****P = 0.00007, ****P = 10−6; muscle, F = 9.324, P = 0.0014, **P = 0.0015, *P = 0.014; one-way ANOVA followed by Tukey’s multiple comparisons test). Data in a, d, e are presented as mean ± s.e.m. Source data are provided as a Source Data file.
Fig. 10
Fig. 10. Inhibition of Gfral+ AP neurons attenuates AP network hyperactivity in the Lewis lung cancer (LLC) model.
a Confocal immunohistochemical images showing Fos expression in different brain areas in the mice where Gfral+ AP neurons were infected with the AAV expressing TeLC (top) or GFP (bottom). b Quantification of Fos+ cells in different brain areas (TeLC group, n = 9 mice, GFP group, n = 8 mice; AP, t = 2.33, *P = 0.0343; NTS, t = 3.3, **P = 0.0049; PBN, t = 4.04, **P = 0.0011; PVN, t = 3.09, **P = 0.0094; CeA, t = 2.62, *P = 0.0193; BNST, t = 2.56, *P = 0.022; t test with false discovery rate adjusted). c Tumor (left) and spleen (right) mass of the mice at 23 days after tumor inoculation (TeLC tumor group, n = 9, GFP tumor group, n = 8, GFP sham group, n = 6; tumor, F = 13.57, P = 0.0002; spleen, F = 19.12, P = 0.00002, ***P = 0.00012, ****P = 0.000035; one-way ANOVA followed by Tukey’s multiple comparisons test). AP, area postrema; NTS, nucleus tractus solitarii; PBN, parabrachial nucleus; CeA, central amygdala; PVN, paraventricular nucleus of hypothalamus; BNST, bed nucleus of the stria terminalis. Data in b, c are presented as mean ± s.e.m. Source data are provided as a Source Data file.

Update of

Similar articles

Cited by

References

    1. Baracos VE, Martin L, Korc M, Guttridge DC, Fearon KCH. Cancer-associated cachexia. Nat. Rev. Dis. Prim. 2018;4:17105. doi: 10.1038/nrdp.2017.105. - DOI - PubMed
    1. Fearon KC, Glass DJ, Guttridge DC. Cancer cachexia: mediators, signaling, and metabolic pathways. Cell Metab. 2012;16:153–166. doi: 10.1016/j.cmet.2012.06.011. - DOI - PubMed
    1. Biswas AK, Acharyya S. Cancer-associated cachexia: a systemic consequence of cancer progression. Annu. Rev. Cancer Biol. 2020;4:391–411. doi: 10.1146/annurev-cancerbio-030419-033642. - DOI
    1. Fearon KC, Carter DC. Cancer cachexia. Ann. Surg. 1988;208:1–5. doi: 10.1097/00000658-198807000-00001. - DOI - PMC - PubMed
    1. Fearon K, Arends J, Baracos V. Understanding the mechanisms and treatment options in cancer cachexia. Nat. Rev. Clin. Oncol. 2013;10:90–99. doi: 10.1038/nrclinonc.2012.209. - DOI - PubMed