. 2024 Jun 1;15(1):4696.
doi: 10.1038/s41467-024-49066-7.

Inherited C-terminal TREX1 variants disrupt homology-directed repair to cause senescence and DNA damage phenotypes in Drosophila, mice, and humans

Affiliations

Inherited C-terminal TREX1 variants disrupt homology-directed repair to cause senescence and DNA damage phenotypes in Drosophila, mice, and humans

Samuel D Chauvin et al. Nat Commun. .

Abstract

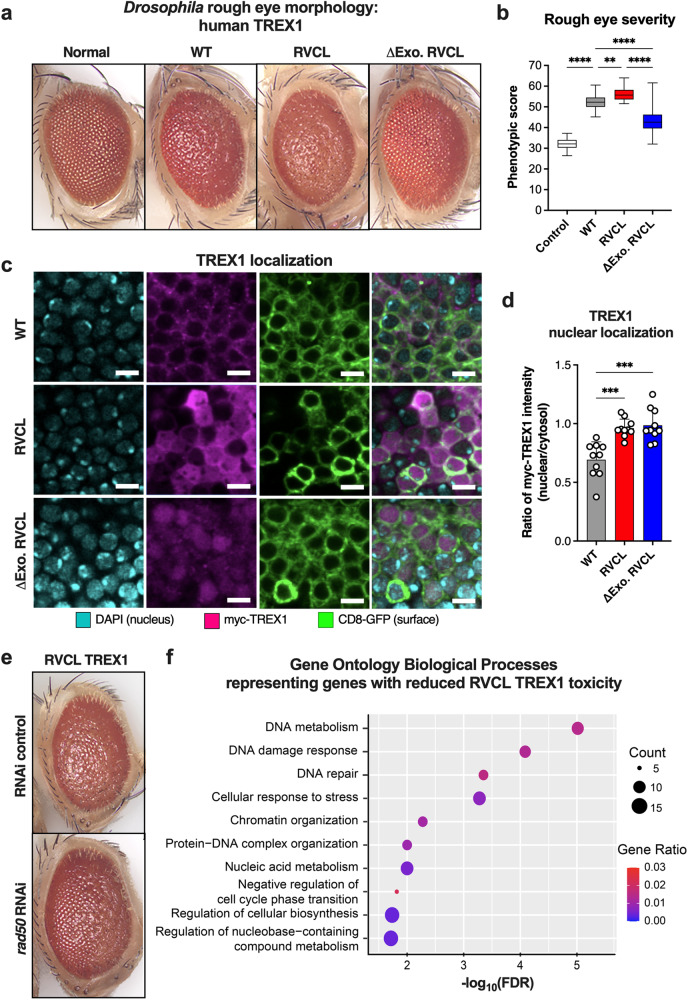
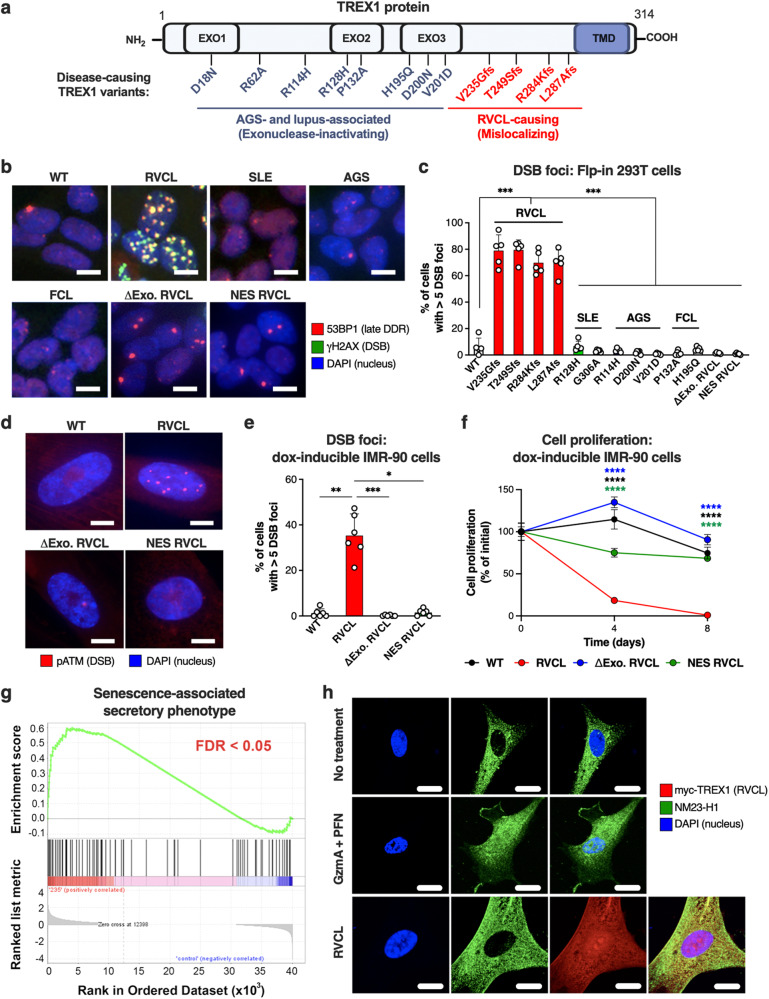
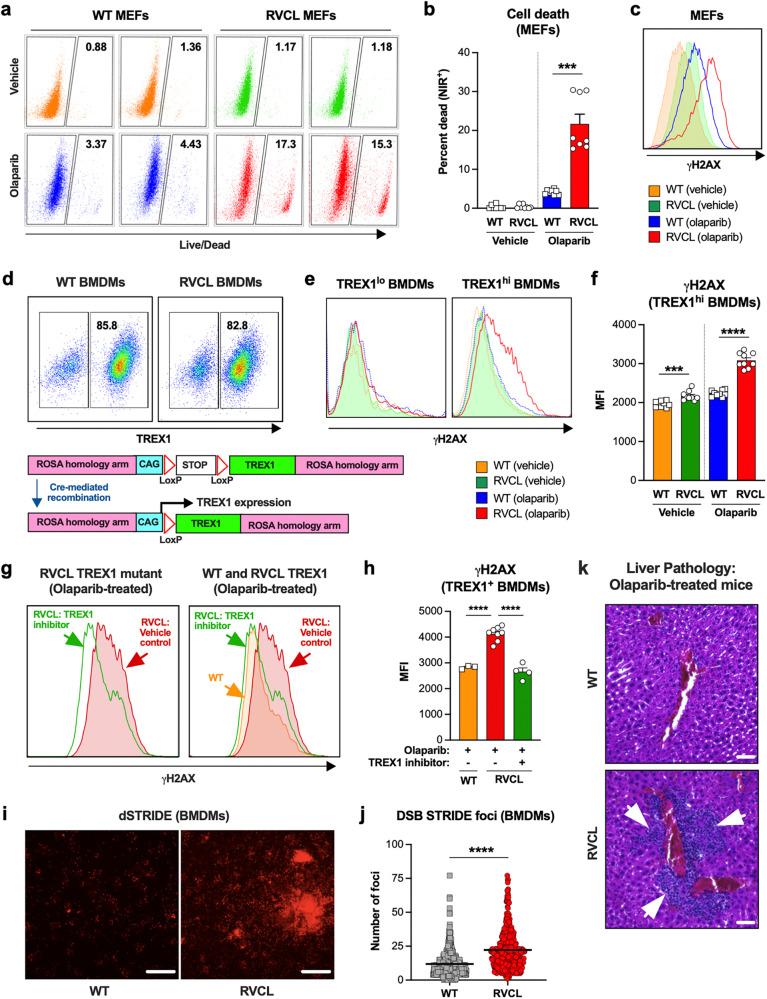
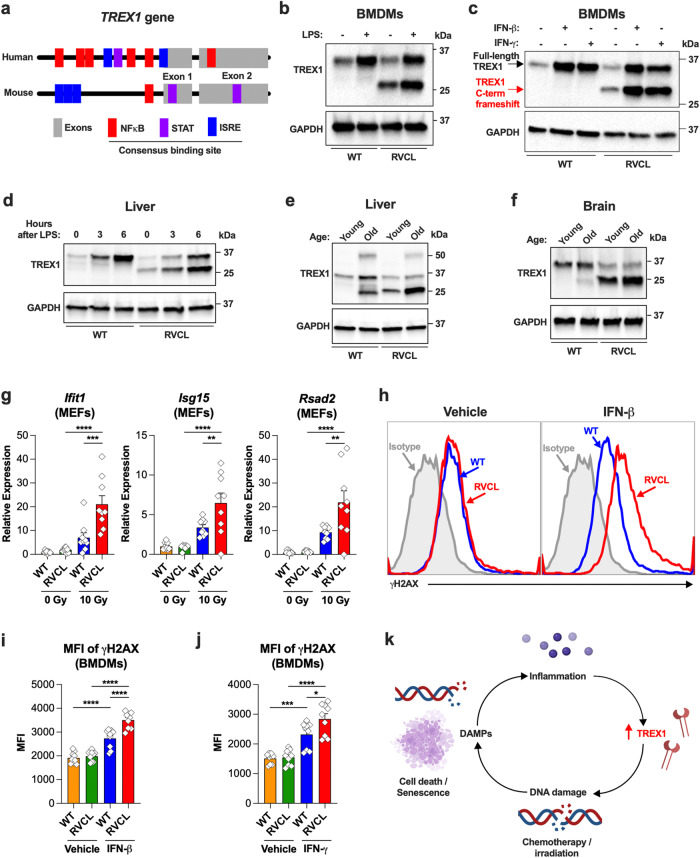
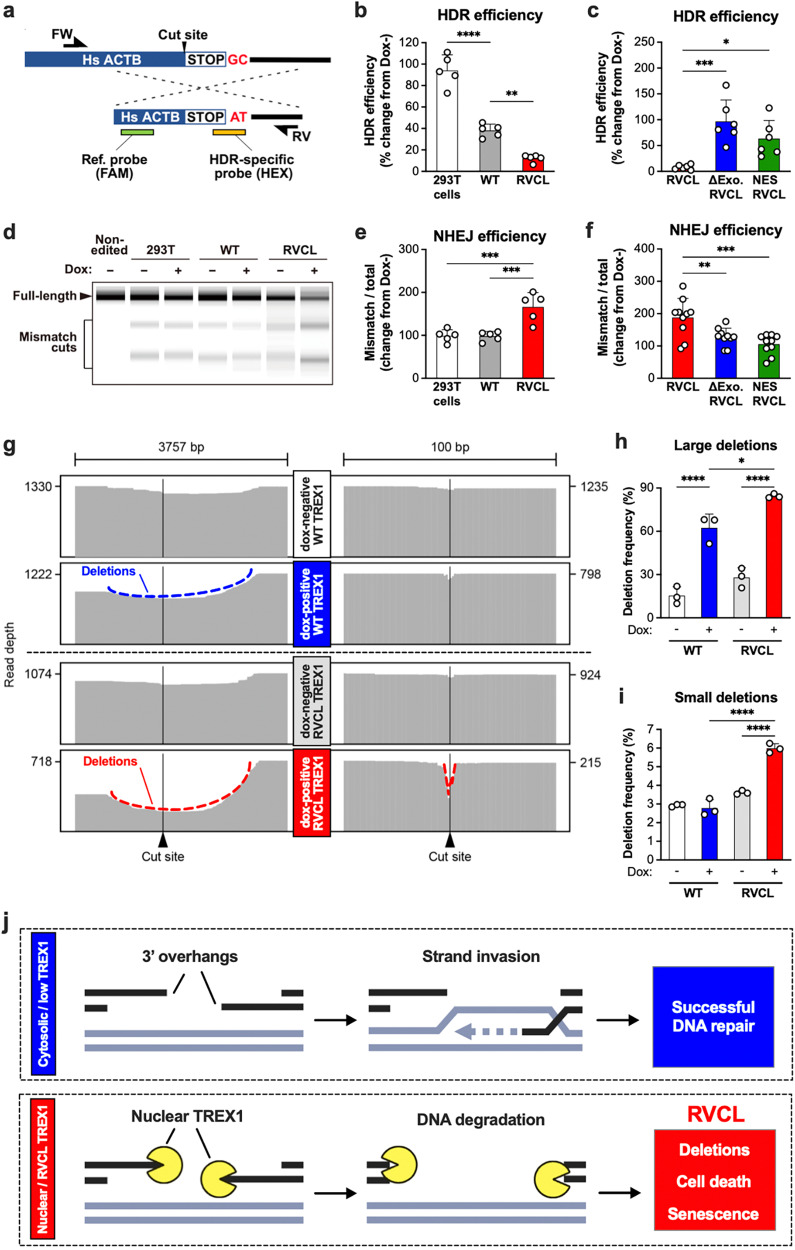
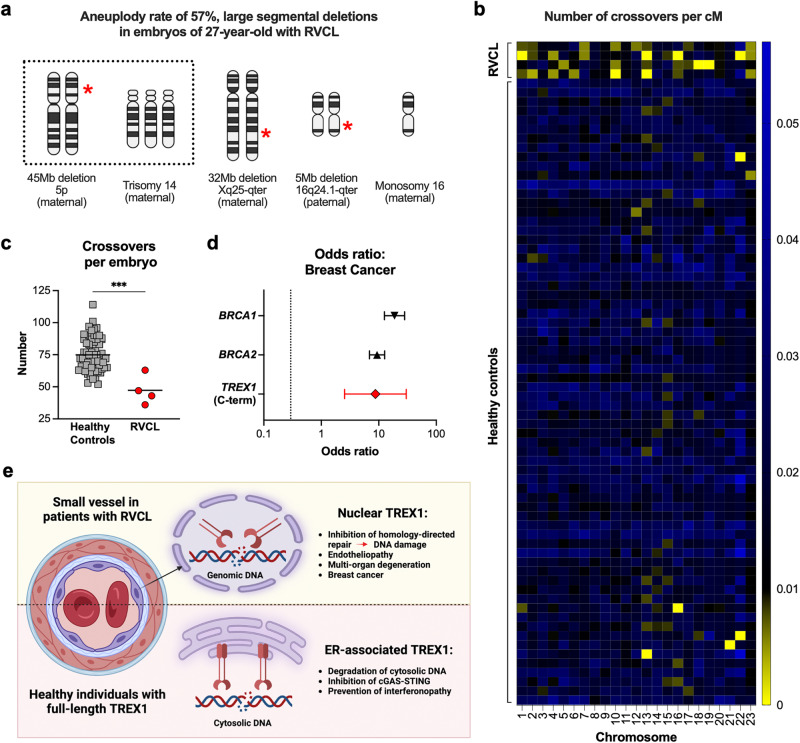
Age-related microangiopathy, also known as small vessel disease (SVD), causes damage to the brain, retina, liver, and kidney. Based on the DNA damage theory of aging, we reasoned that genomic instability may underlie an SVD caused by dominant C-terminal variants in TREX1, the most abundant 3'-5' DNA exonuclease in mammals. C-terminal TREX1 variants cause an adult-onset SVD known as retinal vasculopathy with cerebral leukoencephalopathy (RVCL or RVCL-S). In RVCL, an aberrant, C-terminally truncated TREX1 mislocalizes to the nucleus due to deletion of its ER-anchoring domain. Since RVCL pathology mimics that of radiation injury, we reasoned that nuclear TREX1 would cause DNA damage. Here, we show that RVCL-associated TREX1 variants trigger DNA damage in humans, mice, and Drosophila, and that cells expressing RVCL mutant TREX1 are more vulnerable to DNA damage induced by chemotherapy and cytokines that up-regulate TREX1, leading to depletion of TREX1-high cells in RVCL mice. RVCL-associated TREX1 mutants inhibit homology-directed repair (HDR), causing DNA deletions and vulnerablility to PARP inhibitors. In women with RVCL, we observe early-onset breast cancer, similar to patients with BRCA1/2 variants. Our results provide a mechanistic basis linking aberrant TREX1 activity to the DNA damage theory of aging, premature senescence, and microvascular disease.


Conflict of interest statement

The authors declare no competing interests.

Figures

Fig. 1
Fig. 1. Disease-causing, C-terminally truncated TREX1 exacerbates the rough eye phenotype in Drosophila.
a Representative images of compound eyes from Drosophila over-expressing WT human TREX1 (WT), the TREX1 C-terminal frameshift mutant (RVCL), the TREX1 C-terminal frameshift mutant lacking exonuclease activity (ΔExo RVCL), and control (Normal). b Quantification of rough eye phenotypic scores from a. (P < 0.0001 for Control vs. WT, WT vs. ∆Exo RVCL, and RVCL vs. ∆Exo RVCL, P = 0.0033 for WT vs. RVCL) c Representative fluorescence microscopy in Drosophila Kenyon cells over-expressing WT TREX1, RVCL TREX1 (V235Gfs), or ΔExo RVCL with immunostaining for Myc (TREX1), DAPI (nucleus), and CD8-GFP (structural integrity). Scale bar = 4 µm. d Quantification of the ratio of nucleic to cytoplasmic TREX1 signal from c. (P = 0.0004 for WT vs. RVCL, P = 0.0005 for WT vs. ∆Exo RVCL). e Representative image of compound eye of Drosophila overexpressing RVCL TREX1 with either control RNAi or the rough eye-modifying rad50 RNAi. f Over-represented GO terms enriched by genes with reduced toxicity of RVCL mutant TREX1 with respect to biological process classification. The plots are size-scaled by the number of effective genes enriched for each GO term and color-scaled by the gene ratio (ratio of the number of effective genes to the number of genes associated with the GO term). Data in a, c, and e are representative of independent experiments. Data in b represent n = 25 control, n = 36 WT, n = 29 RVCL, and n = 34 ∆Exo RVCL. Data in d represent n = 10 for all groups. Boxes in b represent the 25th and 75th percentiles, with a solid line within the box showing the median value. Whiskers show the largest and smallest observed value. Data in d represent the mean ± SD. Data in b and d were analyzed one-way ANOVA with a two-sided Bonferroni post hoc test. Source data are provided as a Source Data file. **P < 0.01; ***P < 0.001; ****P < 0.0001.
Fig. 2
Fig. 2. Aberrant nuclear activity of C-terminally truncated TREX1 triggers DNA damage and senescence in mammalian cells.
a Schematic depicting the distinction between locations of interferonopathy-associated TREX1 variants and RVCL-causing TREX1 variants. The exonuclease (EXO) and transmembrane (TMD) domains are indicated. b Representative confocal immunofluorescence images of Flp-in 293 T cells stably expressing WT TREX1 or disease-causing TREX1 mutants associated with RVCL, SLE, AGS, or FCL or RVCL TREX1 (V235Gfs) with a nuclear export signal (NES RVCL) or lacking enzymatic activity (ΔExo RVCL) with immunostaining for 53BP1 (red) and γH2AX (green). Scale bar = 15 µm. c Quantitation of cells with >5 γH2AX/53BP1 foci in cells from b. (P = 0.008) d Representative images of pATM foci in IMR-90 cells with doxycycline-inducible WT TREX1, RVCL TREX1, ΔExo RVCL, or NES RVCL. Scale bar = 10 µm. e Quantitation of frequency of cells with >5 pATM foci in cells from d. (P = 0.01 for WT vs. RVCL, P = 0.0007 for RVCL vs. ∆Exo RVCL, P = 0.045 RVCL vs. NES RVCL). f Line graph of the change in proliferation rate over time of IMR-90 cells expressing WT TREX1, RVCL TREX1, NES RVCL, or ΔExo RVCL. The graph shows the data as 100% of the average value on day 0. (P = 0.0001). g Gene set enrichment analysis (GSEA) profile of SASP gene sets from RNA-seq performed in IMR-90 cells stably expressing RVCL mutant TREX1 (TREX1 V235Gfs) by doxycycline for 2 weeks and in cells without doxycycline. Analysis was performed with n = 4 replicates. FDR is highlighted in red. h Representative fluorescence microscopy images of IMR-90 cells with immunostaining for NM23-H1, DAPI (nucleus), and myc (TREX1). Data in h are representative of 3 independent experiments. Scale bar = 15 μm. Data in b, c, and f are representative of at least 2 independent experiments performed with n = 5 replicates per cell line. Data in de are representative of at least 2 independent experiments performed with n = 6 replicates per cell line. Data in c, e, and f represent the mean ± SD. Data in c and e were analyzed by one-way ANOVA with a two-sided Bonferroni post hoc comparison. Data in f were analyzed by two-way ANOVA. Source data are provided as a Source Data file. * P < 0.05; **P < 0.01; ***P < 0.001; ****P <0.0001.
Fig. 3
Fig. 3. High expression of C-terminally truncated TREX1 causes vulnerability to DNA-damaging agents.
a Representative flow cytometric plots of live (NIR-) and dead (NIR+) WT and RVCL MEF cell populations following 72 h treatment with vehicle control (DMSO) or 10 µM olaparib. MEFs used in ac express TREX1 out of the endogenous locus under control of the endogenous promoter. b Quantitation of percent dead (NIR+) cells from a. (P = 0.0002) c Representative histogram of γH2AX immunostaining in WT and RVCL (TREX1 T235Gfs) MEFs following 72 h of treatment with vehicle (DMSO) or olaparib (10 µM). d Representative flow cytometric analysis of TREX1lo and TREX1hi primary BMDM populations from these animals (upper panel) and a schematic of Cre-mediated recombination at the ROSA locus of Floxed-STOP WT TREX1 and V235Gfs TREX1 mice (lower panel). e Representative histograms of γH2AX expression of gated TREX1lo and TREX1hi WT and RVCL BMDMs treated with vehicle (DMSO) or olaparib (10 µM) for 72 h. f Quantitation of median fluorescence intensity (MFI) of γH2AX immunostaining of TREX1hi WT and RVCL BMDM populations from e. (P = 0.0003 for vehicle, P < 0.0001 for olaparib). g Representative histograms of γH2AX in TREX1hi WT and RVCL BMDMs treated with olaparib (10 µM) and TREX1 inhibitor (10 µM). h Quantitation of MFI of γH2AX from g. (P < 0.0001) i Representative images of DNA DSB STRIDE analysis of WT or RVCL BMDMs treated with olaparib (10 µM) for 72 h. Scale bar = 10 µm. j Quantitation of nuclear DSB STRIDE foci in WT and RVCL BMDMs treated with 10 µM olaparib. (P < 0.0001). k Representative histological images of liver tissue sections stained with hematoxylin and eosin from WT litter mate control and heterozygous RVCL TREX1 (T235Gfs) mice treated with olaparib (40 mg/kg) for 14 days. Scale bar = 40 µm. Data in ac and k are from mice expressing TREX1 from the endogenous locus under control of the endogenous promoter. Data in dj are from mice expressing TREX1 under control of the CAG promoter. Data in a, c, d, e, g, and k are representative of at least 3 independent experiments. Data in b, f, and h represent the mean ± SEM of n = 8 samples per genotype from 2 independent experiments. Data in i are representative of 2 biologically independent experiments, each with multiple technical replicates. Data in j represent the mean ± SEM of WT n = 451, RVCL n = 494. Results in b, f, h, j were analyzed using two-sided Mann–Whitney test. Source data are provided as a Source Data file. ***P < 0.001; ****P < 0.0001.
Fig. 4
Fig. 4. Ionizing radiation and cytokines up-regulate TREX1 and cause excessive DNA damage in RVCL cells.
a Schematic of the TREX1 gene showing the location of consensus sequences for NFκB binding sites, STAT binding sites, and Interferon-stimulated response elements (ISREs). b Representative Western blot of BMDMs from WT or heterozygous mice expressing RVCL mutant TREX1 under control of the endogenous promoter after 6 h of incubation with vehicle or LPS (1 µg/mL) with immunoblotting for TREX1 and GAPDH. c Western blots of BMDMS from WT or RVCL mice after 3 days of incubation with vehicle, IFN-β (100 IU/mL), or IFN-γ (10 ng/mL), followed by immunoblotting for TREX1 and GAPDH. d Western blot of liver from WT or heterozygous RVCL mice after intraperitoneal injection of vehicle or LPS (5 mg/kg), followed by immunoblotting for TREX1 and GAPDH. e, f Representative Western blot of liver (e) and brain (f) from WT or heterozygous RVCL mice at ages 1 month (Young) or 15 months (Old), followed by immunoblotting for TREX1 and GAPDH. g Quantitation of relative expression of the indicated ISGs by RT-qPCR in MEFs from WT or heterozygous RVCL mice 24 h after X-ray irradiation. (P = 0.0001 for RVCL 0 Gy vs. RVCL 10 Gy Ifit1, P = 0.007 for RVCL 0 Gy vs. RVCL 10 Gy Isg15, P = 0.0031 for RVCL 0 Gy vs. RVCL 10 Gy Rsad2, P < 0.0001 for WT 10 Gy vs. RVCL 10 Gy). h Representative histograms of γH2AX expression of BMDMs from WT or heterozygous RVCL mice treated with vehicle or IFN-β (100 IU/mL) for 72 h. i Quantitation of mean fluorescence intensity (MFI) of γH2AX immunostaining from (h). (P < 0.0001) j Quantitation of MFI of γH2AX immunostaining of BMDMs form WT or heterozygous RVCL mice treated with vehicle or IFN-γ (10 ng/mL) for 72 h. (P = 0.02 for WT IFN-γ vs. RVCL IFN-γ, P = 0.0002 for WT vehicle vs. WT IFN-γ, P < 0.0001 for RVCL vehicle vs. RVCL IFN-γ). k Model of a malignant cycle of DNA damage and inflammation in cells expressing RVCL mutant TREX1. Created with BioRender.com released under a Creative Commons Attribution-NonCommercial-NoDerivs 4.0 International license. Data in bj are from mice expressing TREX1 from the endogenous locus under control of the endogenous promoter. Data in bf and h are representative of 2–3 independent experiments. Data in g, i, and j represent the mean ± SEM of n = 9 samples per genotype from 3 independent experiments. Data in g, i, and j were analyzed by one-way ANOVA with two-sided Šidák’s multiple comparisons test. Source data are provided as a Source Data file. * P < 0.05; ** P < 0.01; ***P < 0.001; ****P < 0.0001.
Fig. 5
Fig. 5. CD11c+ myeloid cells and monocytes have high TREX1 expression in mice.
a Model of TREX1-dsRed reporter mice that express TREX1 and dsRed, separated by an IRES, at the endogenous TREX1 locus under control of the endogenous TREX1 promoter. Created with BioRender.com released under a Creative Commons Attribution-NonCommercial-NoDerivs 4.0 International license. bi Representative flow cytometric histogram of dsRed expression (left) with quantitation of mean fluorescence intensity (MFI) of dsRed (right) in the indicated cell types. Histograms are representative of n = 3 independent experiments. Error bars denote the SEM. Source data are provided as a Source Data file.
Fig. 6
Fig. 6. IFN-α up-regulates TREX1 and causes loss of CD11c+ cells and macrophages in heterozygous RVCL mutant TREX1 mice.
a Model of experimental layout. Created with BioRender.com released under a Creative Commons Attribution-NonCommercial-NoDerivs 4.0 International license. b Quantitation of relative expression of the indicated ISGs in the liver of WT or IFNAR1 KO mice 1 week after injection with AAV-LacZ or AAV-IFN-α2. (P = 0.0043) c Representative Western blot of TREX1 and GAPDH from the livers of WT and heterozygous RVCL mice one month after injection with AAV-LacZ or AAV-IFN-α2. dg Quantitation of cell number by flow cytometry from the spleen of WT or heterozygous RVCL mice one week after injection with AAV-LacZ or AAF-IFN-α2. (P = 0.0351 for d, P = 0.0048 for e). Data in bg are from mice expressing TREX1 from the endogenous locus under control of the endogenous promoter. Data in b represent the mean ± SEM of n = 7 WT LacZ, n = 5 IFNAR1 KO LacZ, n = 6 WT IFN-α2, and n = 5 IFNAR1 KO IFN-α2 mice pooled from 2 independent experiments and were analyzed by Mann–Whitney U-test. Data in c are representative of 3 independent experiments. Data in dg represent the mean ± SEM of n = 7 WT LacZ, n = 8 RVCL LacZ, n = 6 WT IFN-α2, and n = 14 RVCL IFN-α2 mice pooled from 2 independent experiments and were analyzed by two-sided unpaired t-test. Source data are provided as a Source Data file. *P < 0.05; **P < 0.01.
Fig. 7
Fig. 7. Catalytically active, nuclear TREX1 disrupts HDR and enhances NHEJ.
a Schematic overview of the droplet digital PCR (ddPCR)-based HDR repair assay utilized in b, c. b Quantitation of HDR mediated repair via ddPCR assay of doxycycline-treated Flp-in 293 T cells expressing WT or RVCL TREX1. Data are expressed as percentage change in frequencies of HDR in doxycycline-treated cells relative to untreated cells. (P = 0.0017 for WT vs. RVCL, P < 0.0001 for WT vs 293 T cells) c Quantitation of HDR mediated repair via ddPCR assay of Flp-in 293 T cells expressing RVCL mutant TREX1, RVCL mutant TREX1 lacking enzymatic activity (∆Exo RVCL), or RVCL mutant TREX1 containing a nuclear export signal (NES REVCL) with data expressed as percentage change in frequencies of HDR in doxycycline-treated cells relative to untreated cells. (P = 0.0154 for RVCL vs. NES RVCL, P = 0.0004 for RVCL vs. ∆Exo RVCL) d A representative ScreenTape electrophoretic gel image of PCR amplicons digested with mismatch cleavage nuclease from non-edited Flp-in 293T and CRISPR-Cas9-edited Flp-in WT TREX1, and TREX1 V235Gfs (RVCL) 293 T cells. e Quantification of NHEJ repair efficiency based on the mismatch cleavage band ratio in d with data expressed as percentage change in doxycycline treated cells relative to untreated cells. (P = 0.008) f Quantification of NHEJ repair efficiency based on the mismatch cleavage band ratio of PCR amplicons digested with mismatch cleavage nuclease from RVCL, ∆Exo RVCL, and NES RVCL Flp-in 293 T cells. Data are expressed as percentage change in doxycycline-treated cells relative to untreated cells. (P = 0.0058 for RVCL vs ∆Exo RVCL, P = 0.0003 for RVCL vs NES RVCL) g Representative read alignments from long-read deep sequencing around the cut site from a in WT and RVCL Flp-in 293T cells before and after doxycycline induction. h, i Quantitation of the frequency of large (h) and small (i) deletions from g. (P = 0.0145 for WT Dox+ vs. RVCL Dox+ large deletions, P < 0.0001 for Dox- vs. Dox+ large deletions, P < 0.0001 for WT Dox+ vs. RVCL Dox+ and RVCL Dox- vs. RVCL Dox+ small deletions). j RVCL mutant TREX1 disrupts DNA damage repair by degrading 3′ overhangs, leading to accumulation of deletions, cell death, and senescence. Data in bf, h, and i represent the mean ± SD and are representative of independent biological replicates; n = 5 (b, e), n = 6 (c), n = 10 (f), or n = 3 (h, i). Data in b, c, e, and f were analyzed by ANOVA with Bonferroni post hoc comparison. Data in h and i were analyzed by ANOVA with two-sided Šidák’s multiple comparisons test. Source data are provided as a Source Data file. *P < 0.05; **P < 0.01; ***P < 0.001; ****P < 0.0001.
Fig. 8
Fig. 8. RVCL mutant TREX1 interacts with chromatin and nuclear proteins involved in the DNA damage response.
a Representative Western blot after subcellular fractionation and SDS-PAGE of lysates from WT and heterozygous RVCL BMDMs followed by immunoblotting of TREX1, H3K27ac, and H3K27me3 from the indicated subcellular fractions. b A silver-stain of co-immunoprecipitated proteins using 3x-FLAG-tagged TREX1 V235Gfs as bait (left) and quantitation of unique co-precipitated peptides in the band that identified PARP1 and some of the other interacting partners (right). Nuclear-localized proteins are indicated in red. c Summary diagram of WT TREX1- and TREX1 V235Gfs-interacting proteins with at least 20 unique peptides detected by immunoprecipitation-mass spectrometry. TREX1-interacting proteins are organized by their subcellular localization and cellular functions. Data in a are representative of 3 independent experiments. Data in b and c are from one mass spectrometry screen. Source data are provided as a Source Data file.
Fig. 9
Fig. 9. Aneuploidy and reduced meiotic crossovers in embryos of a female RVCL patient and breast cancer in female patients with RVCL.
a Diagram representing the observed chromosomal aneuploidy in embryos of a 27-year-old RVCL patient undergoing in vitro fertilization with pre-implantation genetic testing. Red stars indicate location of deletion. b Heatmap showing the number of crossover events normalized to chromosome length (cM) per chromosome in healthy control and RVCL patient embryos. c A scatter plot showing the distribution of total crossover events in healthy control and RVCL patient embryos. (P = 0.0004) d Interval plot depicting the odds ratio (OR) of breast cancer in females with RVCL-causing TREX1 variants compared with publicly available ORs of breast cancer in women with variants in BRCA1 or BRCA2. e Model of RVCL disease pathogenesis. Created with BioRender.com released under a Creative Commons Attribution-NonCommercial-NoDerivs 4.0 International license. Data in ac represent independent embryos analyzed as part of routine clinical care; healthy control embryo n = 67, RVCL embryo n = 4. Error bars in d represent 95% confidence intervals from n = 19 female patients with RVCL. Data in c analyzed by two-sided Mann–Whitney U test. Source data are provided as a Source Data file. ***P < 0.001.

References

    1. Hakim AM. Small vessel disease. Front Neurol. 2019;10:1020. doi: 10.3389/fneur.2019.01020. - DOI - PMC - PubMed
    1. Staals J, Makin SDJ, Doubal FN, Dennis MS, Wardlaw JM. Stroke subtype, vascular risk factors, and total MRI brain small-vessel disease burden. Neurology. 2014;83:1228–1234. doi: 10.1212/WNL.0000000000000837. - DOI - PMC - PubMed
    1. Vermeer SE, Longstreth WT, Jr, Koudstaal PJ. Silent brain infarcts: a systematic review. Lancet Neurol. 2007;6:611–619. doi: 10.1016/S1474-4422(07)70170-9. - DOI - PubMed
    1. Grand MG, et al. Cerebroretinal vasculopathy. A new hereditary syndrome. Ophthalmology. 1988;95:649–659. doi: 10.1016/S0161-6420(88)33131-3. - DOI - PubMed
    1. Stam AH, et al. Retinal vasculopathy with cerebral leukoencephalopathy and systemic manifestations. Brain. 2016;139:2909–2922. doi: 10.1093/brain/aww217. - DOI - PMC - PubMed

Substances

Supplementary concepts