

Obesity-driven mitochondrial dysfunction in human adipose tissue-derived mesenchymal stem/stromal cells involves epigenetic changes
- PMID: 38824145
- PMCID: PMC11144257
- DOI: 10.1038/s41419-024-06774-8
Obesity-driven mitochondrial dysfunction in human adipose tissue-derived mesenchymal stem/stromal cells involves epigenetic changes
Abstract
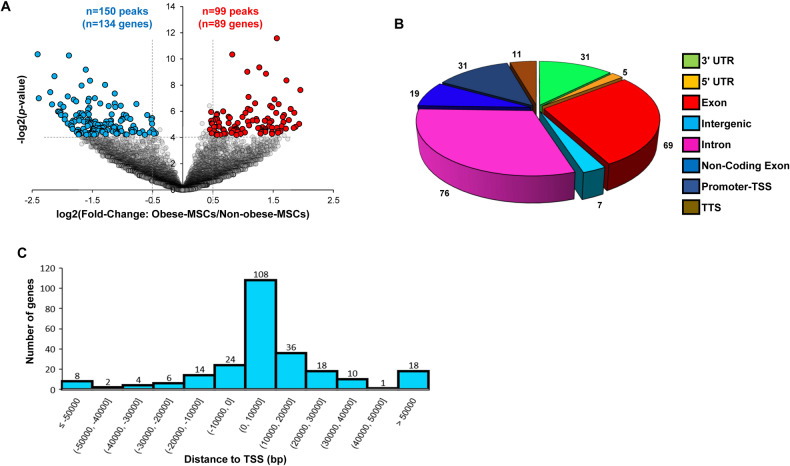
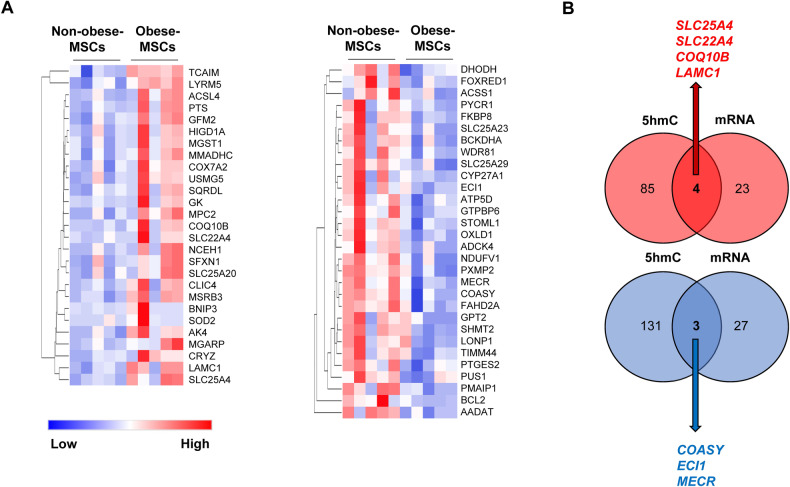
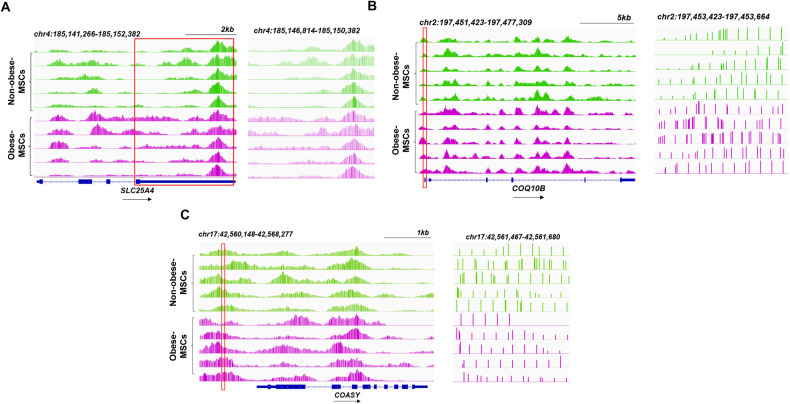
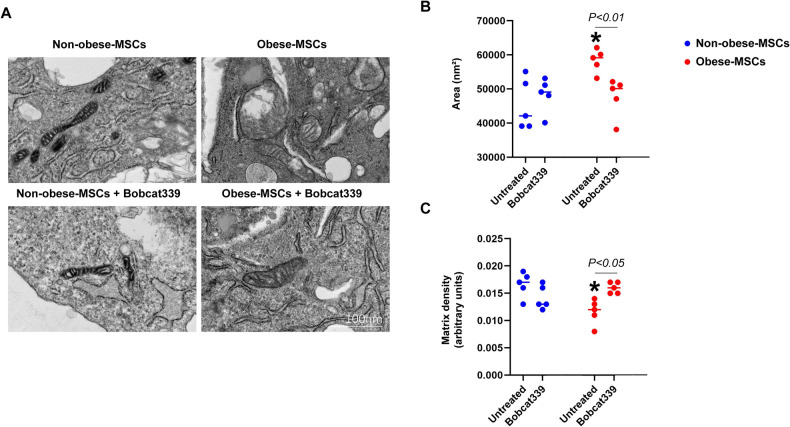
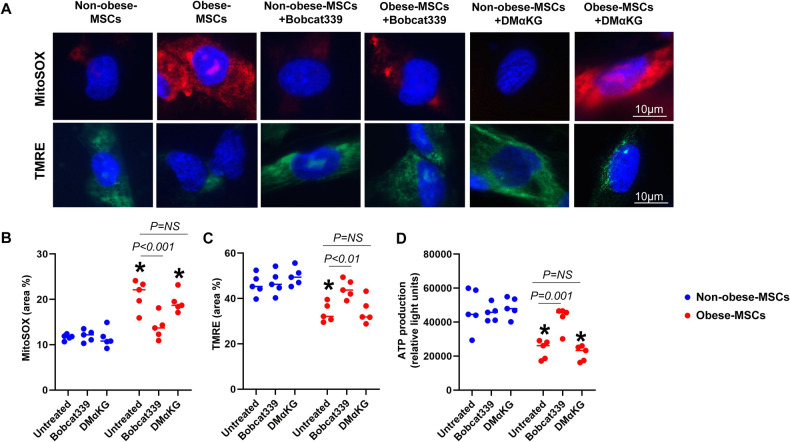
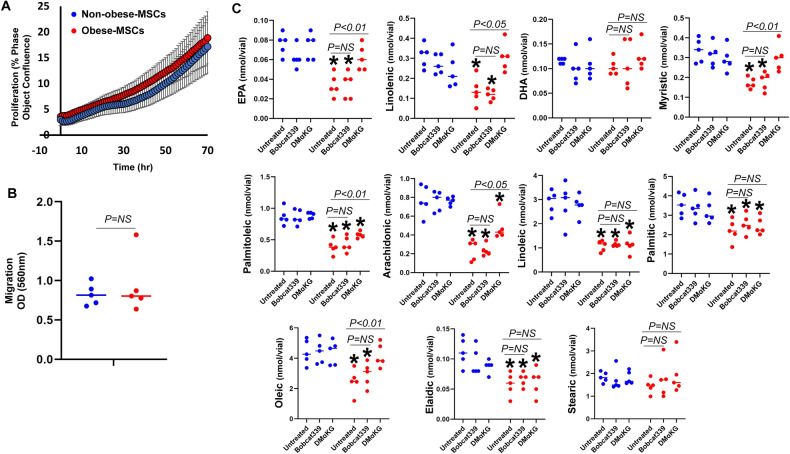
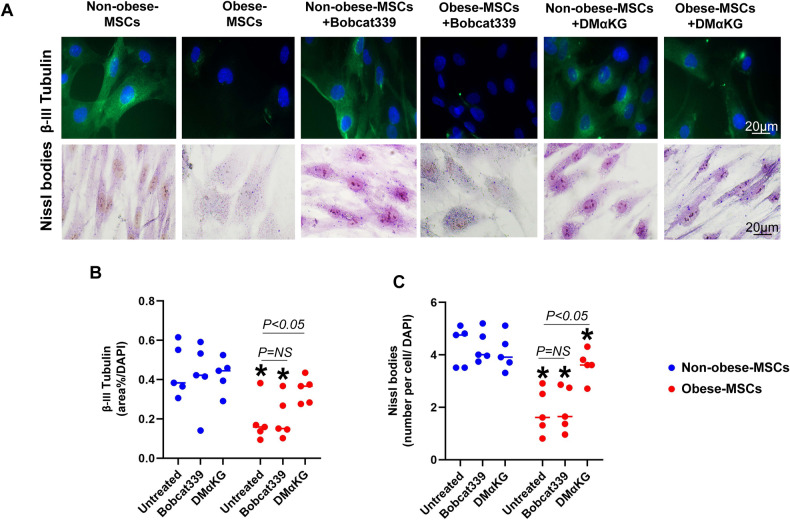
Obesity exacerbates tissue degeneration and compromises the integrity and reparative potential of mesenchymal stem/stromal cells (MSCs), but the underlying mechanisms have not been sufficiently elucidated. Mitochondria modulate the viability, plasticity, proliferative capacity, and differentiation potential of MSCs. We hypothesized that alterations in the 5-hydroxymethylcytosine (5hmC) profile of mitochondria-related genes may mediate obesity-driven dysfunction of human adipose-derived MSCs. MSCs were harvested from abdominal subcutaneous fat of obese and age/sex-matched non-obese subjects (n = 5 each). The 5hmC profile and expression of nuclear-encoded mitochondrial genes were examined by hydroxymethylated DNA immunoprecipitation sequencing (h MeDIP-seq) and mRNA-seq, respectively. MSC mitochondrial structure (electron microscopy) and function, metabolomics, proliferation, and neurogenic differentiation were evaluated in vitro, before and after epigenetic modulation. hMeDIP-seq identified 99 peaks of hyper-hydroxymethylation and 150 peaks of hypo-hydroxymethylation in nuclear-encoded mitochondrial genes from Obese- versus Non-obese-MSCs. Integrated hMeDIP-seq/mRNA-seq analysis identified a select group of overlapping (altered levels of both 5hmC and mRNA) nuclear-encoded mitochondrial genes involved in ATP production, redox activity, cell proliferation, migration, fatty acid metabolism, and neuronal development. Furthermore, Obese-MSCs exhibited decreased mitochondrial matrix density, membrane potential, and levels of fatty acid metabolites, increased superoxide production, and impaired neuronal differentiation, which improved with epigenetic modulation. Obesity elicits epigenetic changes in mitochondria-related genes in human adipose-derived MSCs, accompanied by structural and functional changes in their mitochondria and impaired fatty acid metabolism and neurogenic differentiation capacity. These observations may assist in developing novel therapies to preserve the potential of MSCs for tissue repair and regeneration in obese individuals.
© 2024. The Author(s).
Conflict of interest statement
LOL is an advisor to CureSpec and Ribocure Pharmaceuticals. The remaining authors declare no conflicts of interest.
Figures
Similar articles
-
Human Obesity Decreases the Anti-inflammatory Functionality of Adipose Tissue-Derived Mesenchymal Stem/Stomal Cells by Upregulating IL-1β Expression.Stem Cells. 2025 Aug 21:sxaf058. doi: 10.1093/stmcls/sxaf058. Online ahead of print. Stem Cells. 2025. PMID: 40839167
-
Obesity and dyslipidemia are associated with partially reversible modifications to DNA hydroxymethylation of apoptosis- and senescence-related genes in swine adipose-derived mesenchymal stem/stromal cells.Stem Cell Res Ther. 2023 May 25;14(1):143. doi: 10.1186/s13287-023-03372-x. Stem Cell Res Ther. 2023. PMID: 37231414 Free PMC article.
-
Human Infrapatellar Fat Pad Mesenchymal Stem Cell-derived Extracellular Vesicles Purified by Anion Exchange Chromatography Suppress Osteoarthritis Progression in a Mouse Model.Clin Orthop Relat Res. 2024 Jul 1;482(7):1246-1262. doi: 10.1097/CORR.0000000000003067. Epub 2024 Apr 19. Clin Orthop Relat Res. 2024. PMID: 38662932 Free PMC article.
-
A Systemic Review of Adult Mesenchymal Stem Cell Sources and their Multilineage Differentiation Potential Relevant to Musculoskeletal Tissue Repair and Regeneration.Curr Stem Cell Res Ther. 2017;12(8):601-610. doi: 10.2174/1574888X12666170608124303. Curr Stem Cell Res Ther. 2017. PMID: 28595566
-
Adipose-derived Mesenchymal Stem Cells in the Treatment of Obesity: A Systematic Review of Longitudinal Studies on Preclinical Evidence.Curr Stem Cell Res Ther. 2018;13(6):466-475. doi: 10.2174/1574888X13666180515160008. Curr Stem Cell Res Ther. 2018. PMID: 29766824
Cited by
-
Adipose Tissue Plasticity: A Comprehensive Definition and Multidimensional Insight.Biomolecules. 2024 Sep 27;14(10):1223. doi: 10.3390/biom14101223. Biomolecules. 2024. PMID: 39456156 Free PMC article. Review.
-
Key Roles of Brown, Subcutaneous, and Visceral Adipose Tissues in Obesity and Insulin Resistance.Curr Issues Mol Biol. 2025 May 9;47(5):343. doi: 10.3390/cimb47050343. Curr Issues Mol Biol. 2025. PMID: 40699742 Free PMC article. Review.
-
Senescence in Adipose-Derived Stem Cells: Biological Mechanisms and Therapeutic Challenges.Int J Mol Sci. 2024 Aug 1;25(15):8390. doi: 10.3390/ijms25158390. Int J Mol Sci. 2024. PMID: 39125960 Free PMC article. Review.
-
Understanding the Link Between Sterol Regulatory Element Binding Protein (SREBPs) and Metabolic Dysfunction Associated Steatotic Liver Disease (MASLD).Curr Obes Rep. 2025 Apr 14;14(1):36. doi: 10.1007/s13679-025-00626-y. Curr Obes Rep. 2025. PMID: 40227546 Review.
-
Oncogenic effects of ECM remodeling in obesity and breast cancer.Oncogene. 2025 Aug 22. doi: 10.1038/s41388-025-03521-x. Online ahead of print. Oncogene. 2025. PMID: 40847127 Review.
References
Publication types
MeSH terms
Substances
Associated data
Grants and funding
- R01 HL158691/HL/NHLBI NIH HHS/United States
- DK122734/U.S. Department of Health & Human Services | NIH | National Heart, Lung, and Blood Institute (NHLBI)
- R56 DK129240/DK/NIDDK NIH HHS/United States
- DK129240/U.S. Department of Health & Human Services | NIH | National Heart, Lung, and Blood Institute (NHLBI)
- R01 DK129240/DK/NIDDK NIH HHS/United States
- HL158691/U.S. Department of Health & Human Services | NIH | National Heart, Lung, and Blood Institute (NHLBI)
- DK120292/U.S. Department of Health & Human Services | NIH | National Heart, Lung, and Blood Institute (NHLBI)
- R01 DK122734/DK/NIDDK NIH HHS/United States
- AG062104/U.S. Department of Health & Human Services | NIH | National Heart, Lung, and Blood Institute (NHLBI)
- R21 AG062104/AG/NIA NIH HHS/United States
LinkOut - more resources
Full Text Sources
Medical
