. 2024 Jun 1;15(1):4689.
doi: 10.1038/s41467-024-49180-6.

Nutrient levels control root growth responses to high ambient temperature in plants

Affiliations

Nutrient levels control root growth responses to high ambient temperature in plants

Sanghwa Lee et al. Nat Commun. .

Abstract

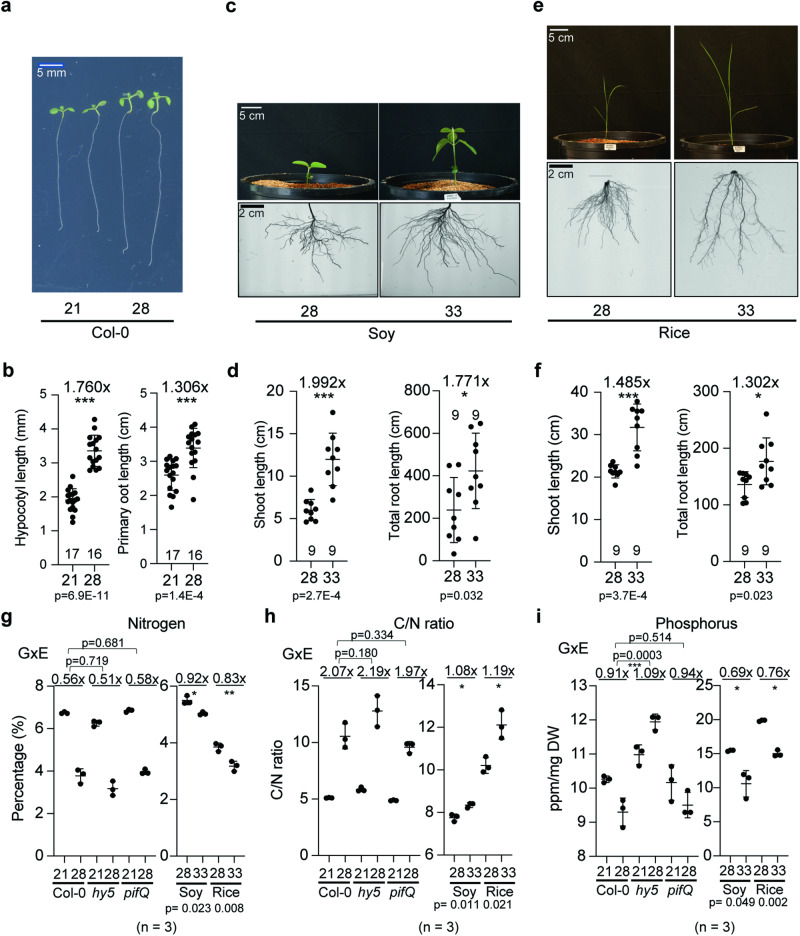
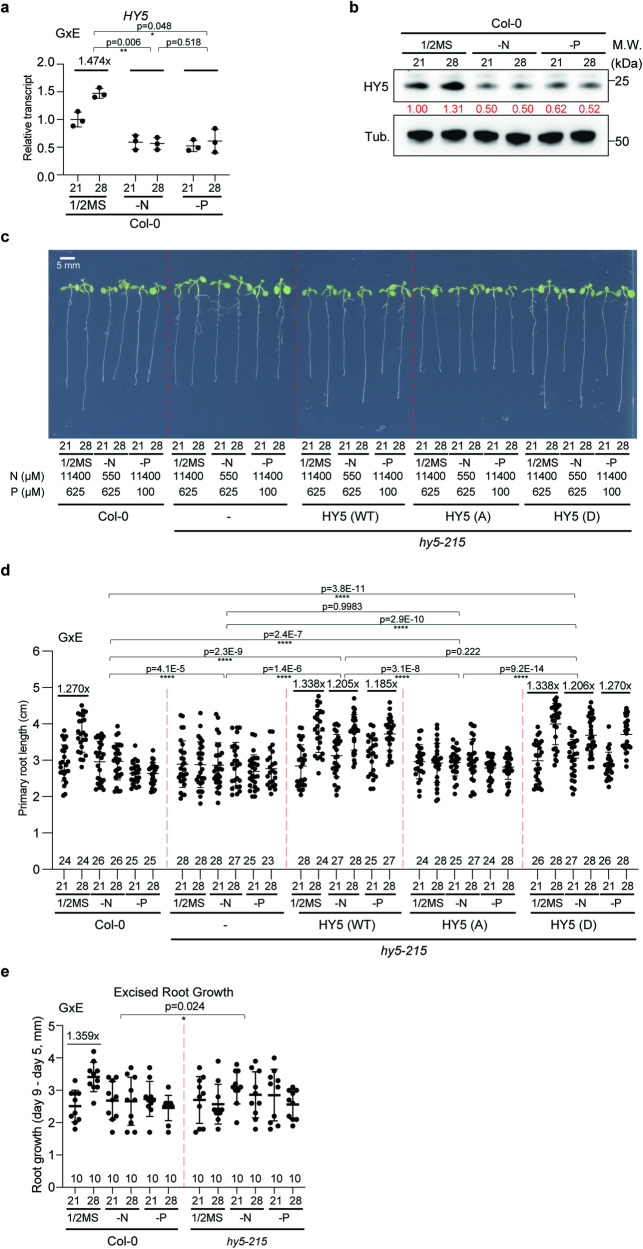
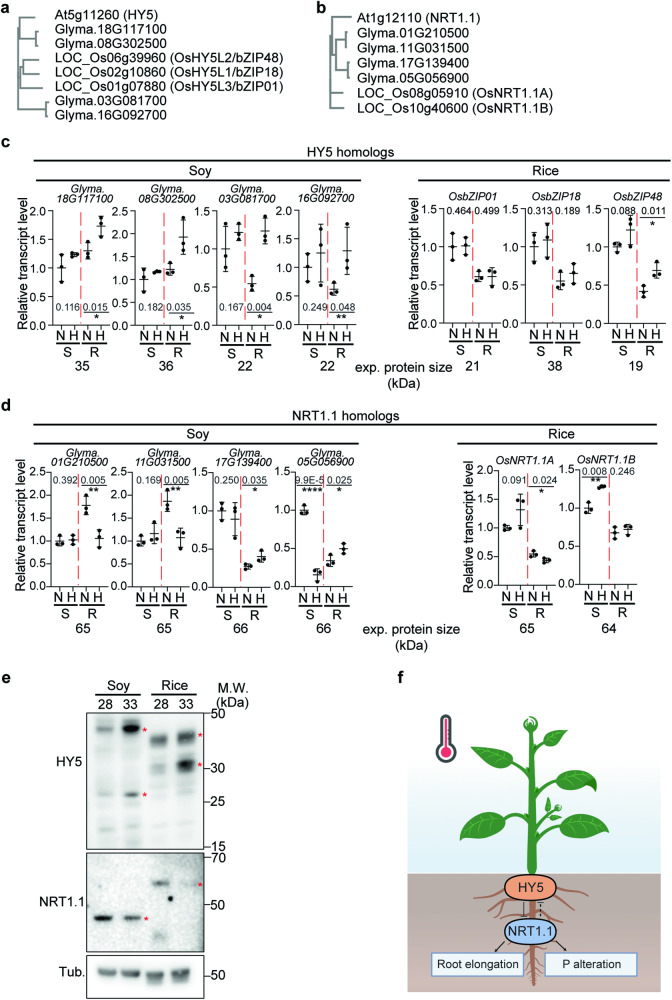
Global warming will lead to significantly increased temperatures on earth. Plants respond to high ambient temperature with altered developmental and growth programs, termed thermomorphogenesis. Here we show that thermomorphogenesis is conserved in Arabidopsis, soybean, and rice and that it is linked to a decrease in the levels of the two macronutrients nitrogen and phosphorus. We also find that low external levels of these nutrients abolish root growth responses to high ambient temperature. We show that in Arabidopsis, this suppression is due to the function of the transcription factor ELONGATED HYPOCOTYL 5 (HY5) and its transcriptional regulation of the transceptor NITRATE TRANSPORTER 1.1 (NRT1.1). Soybean and Rice homologs of these genes are expressed consistently with a conserved role in regulating temperature responses in a nitrogen and phosphorus level dependent manner. Overall, our data show that root thermomorphogenesis is a conserved feature in species of the two major groups of angiosperms, monocots and dicots, that it leads to a reduction of nutrient levels in the plant, and that it is dependent on environmental nitrogen and phosphorus supply, a regulatory process mediated by the HY5-NRT1.1 module.


Conflict of interest statement

The authors declare no competing interests.

Figures

Fig. 1
Fig. 1. Plant developmental responses to high ambient temperatures are conserved and are linked to altered nutrient levels.
af Phenotypes of Arabidopsis (Col-0; a, b), soybean (Williams82; c, d), and rice (Kitaake; e, f) at normal and higher temperatures. Arabidopsis seedlings were grown for 4 days on 1/2 ms plates at 21 °C and then kept either at 21 °C or 28 °C for 5 additional days. Rice and soybean seedlings were grown for 1 week at 28 °C and then either kept at 28 °C or 33 °C for additional 2 weeks for rice and 1 week for soybean, respectively. Scatter dot plot shows average difference in primary root length for Arabidopsis, and total root length for soybean and rice, and the number of plants. p-Value from one-sided Student’s t test. g, h Nitrogen (g) and C/N ratio (h) in Arabidopsis shoots (Col-0, hy5-215, and pifQ), soybean shoots, and rice shoots using CN analysis. i Phosphorus in Arabidopsis shoots, Soybean shoots, and rice shoots using MP-AES. For (g–i), n = 3 biologically independent samples were used. p-Values for the corresponding GxE interactions determined through ANOVA are shown on top of each graph. Asterisks indicate statistically significant difference either 2-way ANOVA or one-sided Student’s t test; *p < 0.05, **p < 0.01, ***p < 0.001, and ****p < 0.0001. Average fold difference of each group is indicated in the top region of the plot. Shoot parts from 4-week-old plants from Arabidopsis, soybean, and rice plants were used for the nutrient analyses. Plots indicate mean (horizontal line) and standard deviation (error bars).
Fig. 2
Fig. 2. HY5 integrates temperature and N–P signaling and directly represses NRT1.1 transcription.
a IGV image of HY5 ChIP-seq data from Burko et al. of selected N–P signaling genes with transcription direction and binding motif. b Scatter dot plot of ChIP-qPCR results at normal and high ambient temperature of promoter regions of five different genes. p-Values for the two-sided Student’s t test. c Scatter dot plot of qPCR results at normal and high ambient temperature of four different genes using Col-0 and hy5-215 shoot and root samples of seedlings. Relative transcript level was normalized using PP2A as a control and to the expression levels in the shoot. For (b and c), n = 3 biologically independent samples were used. p-Values for the corresponding GxE interactions determined through ANOVA are shown on top of each graph. Asterisks indicate statistically significant difference either 2-way ANOVA; *p < 0.05, **p < 0.01, ***p < 0.001, and ****p < 0.0001. d Electrophoretic Mobility Shift Assay (EMSA) showing GST-HY5 binds to G-box motif of NRT1.1 promoter region. G-box motif containing nucleotides were biotin labeled. Competitor is the same sequence but biotin unlabeled. mCompetitor is mutated version of G-box motif (CACATG to CCCATG) without biotin label. Two independent experiments were repeated with similar results. e dual luciferase assay using Nicotiana benthamiana. (upper) Effector and reporter constructs are described. (lower) Relative FLUC/RLUC showing HY5 as a transcriptional repressor. n = 12 biologically independent samples were used. p-Value from two-sided Student’s t test. Plots from (b, c, and e) indicate mean (horizontal line) and standard deviation (error bars).
Fig. 3
Fig. 3. Root thermomorphogenesis depends on external N–P levels and phosphorylation but not shoot to root mobility of HY5 is required for this.
a, b HY5 transcript (a) and protein (b) level grown on different media at control and high ambient temperature. Root samples were analyzed separately. For (a), n = 3 biologically independent samples were used. Native HY5 antibody was used for Western blot. Red number indicates the relative signal intensity divided by HY5 signal to Tubulin. c Phenotypes of Col-0, hy5-215, and 3 different forms or HY5 overexpression lines (WT, A: phospho-dead, D: phospho-mimic) in hy5-215 grown on different media at control and high ambient temperatures. d Scatter dot plot of (c). e Phenotypes of excised roots grown on different media at control and high ambient temperature with the number of plants indicated. Average fold difference of each group is indicated in the top region of the plot. Scatter dot plots indicate mean (horizontal line) and standard deviation (error bars). p-Values for the corresponding GxE interactions determined through ANOVA are shown on top of each graph. Asterisks indicate statistically significant difference either 2-way ANOVA; *p < 0.05, **p < 0.01, ***p < 0.001, and ****p < 0.0001.
Fig. 4
Fig. 4. NRT1.1 integrates N–P signaling and root thermomorphogenesis.
a Scatter dot plot of qPCR results at normal and high ambient temperature grown Col-0 and 35S:HY5-GFP/hy5-215 seedlings grown on different media (1/2MS, -N, -P). Only root samples were used for the analysis. The relative transcript level of NRT1.1 was normalized by the expression levels of PP2A and to the expression levels in the shoot. For (a), n = 3 biologically independent samples were used. b Confocal microscopy images of pNRT1.1:GFP transgenic line at normal and high ambient temperature grown on different media (1/2MS, -N, -P). c Scatter dot plot of the signals quantified from confocal microscopy images of (b). Quantification of the signal intensity. d Western blot analysis of Col-0 and 35S:HY5-GFP/hy5-215 seedling roots using native NRT1.1 antibody. Red number indicates the relative signal intensity divided by NRT1.1 signal to Tubulin. Two independent experiments were repeated with similar results. e Confocal microscopy images of pNRT1.1:NRT1.1-GFP transgenic line at normal and high ambient temperature grown on different media (1/2 ms, -N, -P). Scale bar indicates 50 μm. f Scatter dot plot of the signals quantified from confocal microscopy images of (e). Media concentrations includes: 1/2MS (N:11400 μM, P: 625 μM), mildly nitrogen deficient (N: 550 μM, P: 625 μM), and mildly phosphorus deficient (N:11400 μM, P: 100 μM). Scatter dot plots indicate mean (horizontal line) and standard deviation (error bars). For (c and f), n = 5 biologically independent samples were used. p-Values for the corresponding ExE interactions determined through ANOVA are shown on top of each graph. Asterisks indicate statistically significant difference either 2-way ANOVA; *p < 0.05, **p < 0.01, ***p < 0.001, and ****p < 0.0001.
Fig. 5
Fig. 5. The HY5-NRT1.1 regulatory module is required for the interaction of root thermomorphogenesis and P level.
a qPCR results of HY5 transcript level at normal and high ambient temperature using Col-0 and chl1-5 seedlings with separated samples of shoot and root. Relative transcript level was normalized using PP2A as a control and to the expression levels in the shoot. Shoot and root samples were analyzed separately. n = 3 biologically independent samples were used. b Western blot analyses of NRT1.1 and HY5 using Col-0, hy5-215, and chl1-5 root. Red number indicates the relative signal intensity divided by NRT1.1 or HY5 signal to Tubulin. c Phenotypic analyses of Col-0, hy5-215, chl1-5, hy5-215 chl1-5 double mutant at high ambient temperature. dg Scatter dot plot of phenotypic analyses, hypocotyl length (d), root length (e), nitrate and nitrite composition (f), and phosphate composition (g). For nitrate/nitrite and phosphate composition analyses, seeds of each genotype were grown on soil for 2 weeks at 21 °C and transferred into either 21 °C or 28 °C for additional 2 weeks. Then the leaves were used for the analyses. For (f and g), n = 3 biologically independent samples were used. p-Values for the corresponding GxE interactions determined through ANOVA are shown on top of each graph. Asterisks indicate statistically significant difference either 2-way ANOVA; *p < 0.05, **p < 0.01, ***p < 0.001, and ****p < 0.0001. Average fold difference of each group is indicated in the top region of the plot. Scatter dot plots indicate mean (horizontal line) and standard deviation (error bars).
Fig. 6
Fig. 6. HY5-NRT1.1 regulatory mechanism controls global gene expression at high ambient temperature.
a Volcano plot of RNAseq using Col-0 root samples. Col-0 seedlings were grown for 4 days in 21 °C and then transferred to either 21 °C or 28 °C for additional 5 days and collected. Threshold of two sided p-value is 0.05, and Log2 Fold change threshold is −1 and 1. NRT1.1 is labeled with purple dot. b Venn diagram of root Differentially Expressed Genes (DEGs) in Col-0, chl1-5, and hy5-215 mutant at high ambient temperature. Gene Ontology (GO) analysis clusters within each group are described next to the Venn diagram. c Heatmap analysis shows that Col-0, chl1-5, and hy5-215 mutant have different expression pattern. Representative GO analyses of each cluster are noted. Three biological repeats were performed for RNAseq analysis.
Fig. 7
Fig. 7. The HY5-NRT1.1 regulatory mechanism might be conserved in soybean and rice at higher temperature.
a, b Phylogram of HY5 (a) and NRT1.1 (b) homologs in Arabidopsis, soy, and rice. c, d Relative transcript level of HY5 (c) and NRT1.1 (d) homologs in soy and rice. Relative transcript level is normalized by house-keeping genes such as rice ubiquitin and soy tubulin 4. N and H stand for Normal temperature (28 °C) and Higher temperature (33 °C), respectively. S and R stand for Shoot and Root, respectively. For (c and d), n = 3 biologically independent samples were used. Asterisks indicate statistically significant difference using one-sided Student’s t test; *p < 0.05, **p < 0.01, ***p < 0.001, and ****p < 0.0001. e Western blot analysis using native Arabidopsis NRT1.1 and HY5 antibodies. Soybean and rice root samples were used. Red asterisks are temperature dependent bands which might be potential HY5 and NRT1.1 bands in soybean and rice. Two independent experiments were repeated with similar results. f Simplified model showing root specific HY5 accumulation inhibiting NRT1.1 transcription to promote root elongation and the HY5-NRT1.1 regulatory mechanism altering N and P uptake at higher temperatures in plants. Figure 7f, created with BioRender.com, released under a Creative Commons Attribution-NonCommercial-NoDerivs 4.0 International license. Scatter dot plots indicate mean (horizontal line) and standard deviation (error bars).

References

    1. IPCC. Climate Change 2022: Impacts, Adaptation and Vulnerability. Working Group II Contribution to the IPCC Sixth Assessment Report (IPCC, 2022).
    1. Held C, Sadowski G. Thermodynamics of bioreactions. Annu. Rev. Chem. Biomol. Eng. 2016;7:395–414. doi: 10.1146/annurev-chembioeng-080615-034704. - DOI - PubMed
    1. Ibanez C, et al. Ambient temperature and genotype differentially affect developmental and phenotypic plasticity in Arabidopsis thaliana. BMC Plant Biol. 2017;17:114. doi: 10.1186/s12870-017-1068-5. - DOI - PMC - PubMed
    1. Schleuning M, et al. Ecological networks are more sensitive to plant than to animal extinction under climate change. Nat. Commun. 2016;7:13965. doi: 10.1038/ncomms13965. - DOI - PMC - PubMed
    1. Gaillochet C, et al. HY5 and phytochrome activity modulate shoot-to-root coordination during thermomorphogenesis in Arabidopsis. Development. 2020;147:dev192625. doi: 10.1242/dev.192625. - DOI - PMC - PubMed

MeSH terms