. 2024 Jun 1;7(1):674.
doi: 10.1038/s42003-024-06327-x.

Multiplex, high-throughput method to study cancer and immune cell mechanotransduction

Affiliations

Multiplex, high-throughput method to study cancer and immune cell mechanotransduction

Abigail R Fabiano et al. Commun Biol. .

Abstract

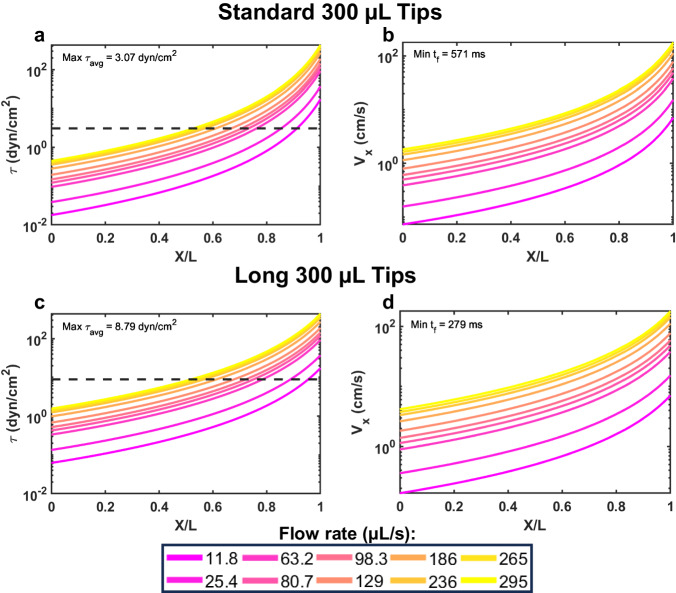
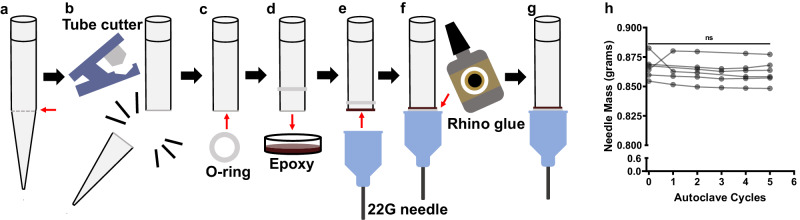
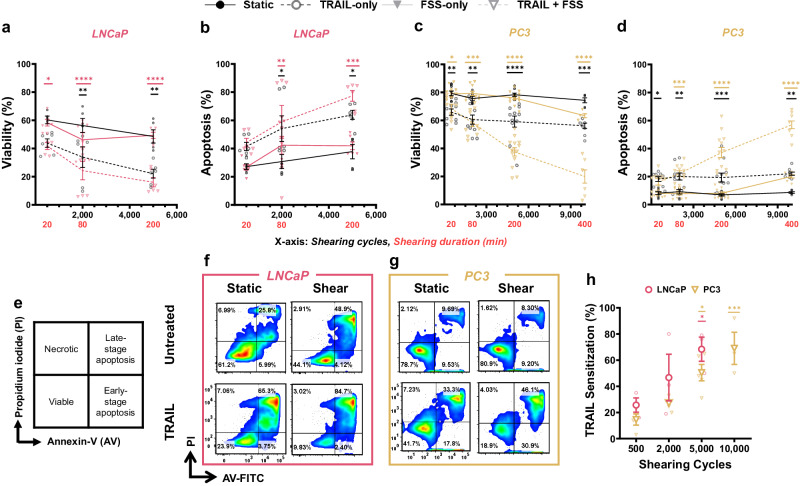
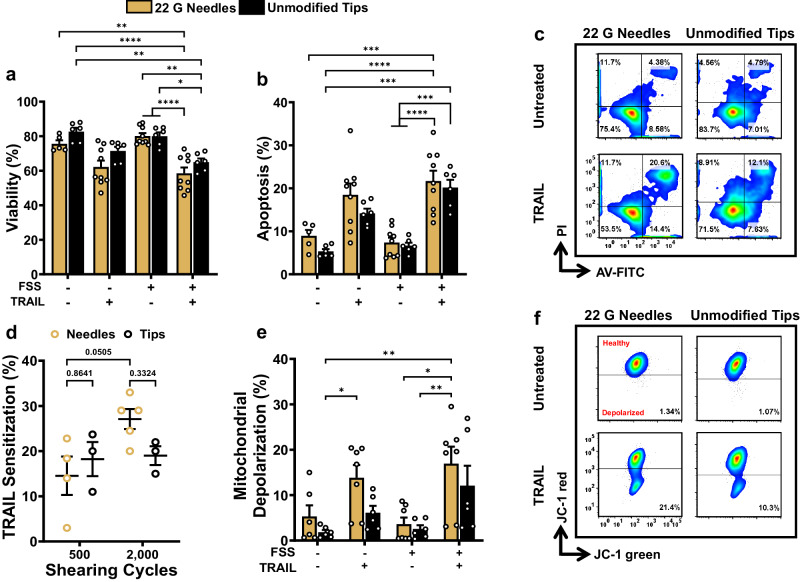
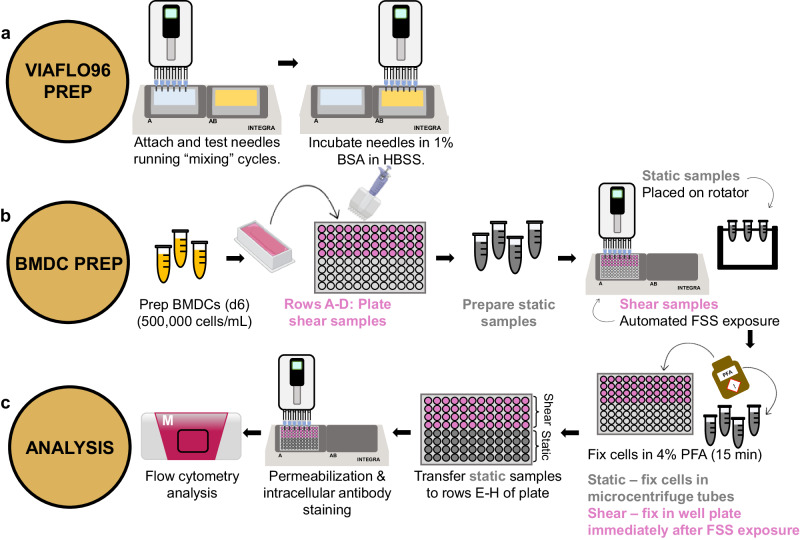
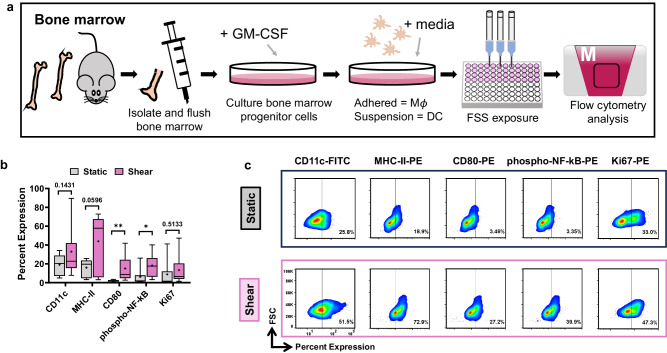
Studying cellular mechanoresponses during cancer metastasis is limited by sample variation or complex protocols that current techniques require. Metastasis is governed by mechanotransduction, whereby cells translate external stimuli, such as circulatory fluid shear stress (FSS), into biochemical cues. We present high-throughput, semi-automated methods to expose cells to FSS using the VIAFLO96 multichannel pipetting device custom-fitted with 22 G needles, increasing the maximum FSS 94-fold from the unmodified tips. Specifically, we develop protocols to semi-automatically stain live samples and to fix, permeabilize, and intracellularly process cells for flow cytometry analysis. Our first model system confirmed that the pro-apoptotic effects of TRAIL therapeutics in prostate cancer cells can be enhanced via FSS-induced Piezo1 activation. Our second system implements this multiplex methodology to show that FSS exposure (290 dyn cm-2) increases activation of murine bone marrow-derived dendritic cells. These methodologies greatly improve the mechanobiology workflow, offering a high-throughput, multiplex approach.


Conflict of interest statement

The authors declare no competing interests.

Figures

Fig. 1
Fig. 1. Numerical calculation of a cell traversing through a narrowing pipette tip.
a The average fluid shear stress and (b) average velocity that a cell experiences while traveling the length of the “standard” INTEGRA pipette tips. c The average fluid shear stress and (d) average velocity a cell experiences traveling the length of the “long” INTEGRA pipette tips. X/L represents the dimensionless length traveled through the narrowing region of the pipette tip. The dashed black line (a, c) represents the average fluid shear stress at the maximum speed of 295 µL s−1. Each solid, colored line corresponds to the VIAFLO96 flow rates from 11.8 to 295 µL s−1.
Fig. 2
Fig. 2. Attachment of 22 G needles to VIAFLO96 tips.
“Long” 300 µL INTEGRA pipette tips were (a) marked at the indentation indicated by the red arrow, (b) trimmed with a tube cutter, (c) followed by addition of an O-ring onto the tip. d The pipette tips were dipped into epoxy, (e) and 22 G needles were secured onto the ends. f, g Rhino glue was used to fill any gaps. h Summary data for needle weight of n = 6 needles after multiple autoclave cycles (One-way ANOVA, *p < 0.05).
Fig. 3
Fig. 3. Process overview for VIAFLO96 manual and semi-automated experimentation following TRAIL treatment.
a Needle attachment and 1% BSA incubation arrangement to prepare the VIAFLO96. b Procedure to prepare the PCa cells with and without TRAIL for FSS exposure in a 96-well plate. c Downstream procedural overview for manual and semi-automated methods for flow cytometry preparation.
Fig. 4
Fig. 4. Fluid shear stress induces TRAIL sensitization in PCa cells.
Summary data for the percentage of (a) viable and (b) apoptotic LNCaP cells and (c) viable and (d) apoptotic PC3 cells treated with TRAIL, following increasing fluid shear stress exposure using 22 G needles in the VIAFLO96 instrument (n = 3–5 independent experiments; two-way ANOVA test, (Supplementary Data 1); colored significance stars show the comparison between TRAIL + FSS and static conditions at each shearing duration; black significance stars compare the TRAIL-only condition to the static condition at each shearing duration). e Graphical interpretation for AV/PI flow cytometry staining. Representative AV/PI flow cytometry plots for (f) LNCaP and (g) PC3 cells exposed to 5000 shearing cycles. h TRAIL sensitization calculated using Eqs. 4 and 5, from the viability measured with the AV/PI assay (n = 4 independent experiments; unpaired t-test comparing the TRAIL + FSS to the TRAIL-only condition). *p < 0.05, **p < 0.01, ***p < 0.005, ****p < 0.0001. Error bars represent ± SEM.
Fig. 5
Fig. 5. TRAIL-mediated apoptosis occurs through mitochondrial depolarization.
Summary data for the percentage of depolarized mitochondria for (a) LNCaP and (b) PC3 cells exposed to increasing shearing cycles using the 22 G needles with the VIAFLO96 instrument combined with TRAIL treatment (n = 3–4 independent experiments; two-way ANOVA test, (Supplementary Data 1); colored significance stars show the comparison between TRAIL + FSS and static conditions at each shearing duration; black significance stars compare the TRAIL-only condition to the static condition at each shearing duration). Representative JC-1 flow cytometry plots for (c) LNCaP and (d) PC3 cells after 5000 shearing cycles. *p < 0.05, **p < 0.01, ***p < 0.005, ****p < 0.0001. Error bars represent ± SEM.
Fig. 6
Fig. 6. Manual and semi-automated flow cytometry staining produce consistent results.
PC3 cells exposed to 5000 shearing cycles using the VIAFLO96 equipped with 22 G needles with TRAIL treatment. Summary data for the percentage of (a) viable and (b) apoptotic PC3 cells. c Summary data for the percentage of depolarized mitochondria. Samples are stained manually or using the semi-automated program produced using VIALINK. d Representative AV/PI flow cytometry plots. e TRAIL sensitization from the viability generated in (a) were calculated using Eqs. 4 and 5. (n = 4 independent experiments (a, b, e), n = 3 independent experiments (c); two-way ANOVA test (ac, e), (Supplementary Data 1)). *p < 0.05, **p < 0.01, ***p < 0.005, ****p < 0.0001. Error bars represent ± SEM.
Fig. 7
Fig. 7. Mechanosensitive ion channel inhibition reduces TRAIL sensitization.
Representative (a) AV/PI and (b) JC-1 flow cytometry plots. Summary data for the (c) viability, (d) apoptosis, (e) depolarized mitochondria and (f) TRAIL sensitization of PC3 cells exposed to 5000 shearing cycles using 22 G needles equipped with the VIAFLO96 system with TRAIL and GsMTx-4 treatment, calculated using Eqs. 6 and 7 (n = 4 independent experiments (c, d, f), n = 3 independent experiments (e); two-way ANOVA test). *p < 0.05, **p < 0.01, ***p < 0.005, ****p < 0.0001. Error bars represent ± SEM.
Fig. 8
Fig. 8. 22 G needles induce higher pro-apoptotic effects of TRAIL compared to unmodified INTEGRA pipette tips.
Summary data for the (a) viability and (b) apoptosis of PC3 cells, and (c) representative AV/PI flow cytometry plots. d TRAIL sensitization calculated using Eq. 5 from the viability after fluid shear stress exposure. e Summary data for the percentage of depolarized mitochondria and (f) representative flow cytometry plots. Data shown for PC3 cells exposed to 2000 shearing cycles using the VIAFLO96 (n = 3–5 independent experiments; two-way ANOVA test (a, b, d, e)). *p < 0.05, **p < 0.01, ***p < 0.005, ****p < 0.0001. Error bars represent ± SEM.
Fig. 9
Fig. 9. Process overview using the VIAFLO96 to test the effects of fluid shear stress on primary immune cells.
a 22 G needle attachment and 1% BSA incubation arrangement to prepare the VIAFLO96. b Procedure to prepare the static and shear samples of BMDC cells. c Downstream semi-automated overview for intracellular flow cytometry preparation.
Fig. 10
Fig. 10. Enhanced differentiation of murine BMDCs.
a Procedural overview for the isolation and exposure of BMDCs to fluid shear stress. b Summary data and (c) representative flow cytometry plots for the percent expression of various BMDC differentiation and co-stimulatory molecules following 5000 shearing cycles using 22 G needles with the VIAFLO96 system (n = 3 independent experiments; box and whisker plot whiskers extend from min to max, the box extends from the 25th to 75th percentiles, the horizontal line indicates the median and the mean is plotted as (+); unpaired t-test comparing the static to the shear condition for each marker examined). GM-CSF granulocyte macrophage-colony stimulating factor, phosphor-NF-kB phosphorylated-nuclear factor-kappa B. *p < 0.05, **p < 0.01.

Similar articles

References

    1. Cook MB, McGlynn KA, Devesa SS, Freedman ND, Anderson WF. Sex Disparities in Cancer Mortality and Survival. Cancer Epidemiol. Biomark. Prev. 2011;20:1629–1637. doi: 10.1158/1055-9965.EPI-11-0246. - DOI - PMC - PubMed
    1. Siegel DA, O’Neil ME, Richards TB, Dowling NF, Weir HK. Prostate Cancer Incidence and Survival, by Stage and Race/Ethnicity — United States, 2001–2017. MMWR Morb. Mortal. Wkly Rep. 2020;69:1473–1480. doi: 10.15585/mmwr.mm6941a1. - DOI - PMC - PubMed
    1. Hope JM, et al. Circulating prostate cancer cells have differential resistance to fluid shear stress-induced cell death. J. Cell Sci. 2021;134:jcs251470. doi: 10.1242/jcs.251470. - DOI - PMC - PubMed
    1. Dillekås H, Rogers MS, Straume O. Are 90% of deaths from cancer caused by metastases? Cancer Med. 2019;8:5574–5576. doi: 10.1002/cam4.2474. - DOI - PMC - PubMed
    1. Saxena M, Christofori G. Rebuilding cancer metastasis in the mouse. Mol. Oncol. 2013;7:283–296. doi: 10.1016/j.molonc.2013.02.009. - DOI - PMC - PubMed

Publication types

Substances