Meta-Analysis
. 2024 Sep;40(9):1274-1286.
doi: 10.1007/s12264-024-01218-x. Epub 2024 Jun 1.

Convergent Neuroimaging and Molecular Signatures in Mild Cognitive Impairment and Alzheimer's Disease: A Data-Driven Meta-Analysis with N = 3,118

Affiliations
Meta-Analysis

Convergent Neuroimaging and Molecular Signatures in Mild Cognitive Impairment and Alzheimer's Disease: A Data-Driven Meta-Analysis with N = 3,118

Xiaopeng Kang et al. Neurosci Bull. 2024 Sep.

Abstract

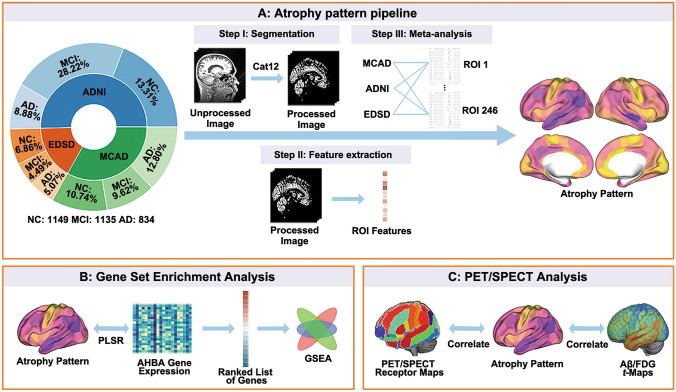
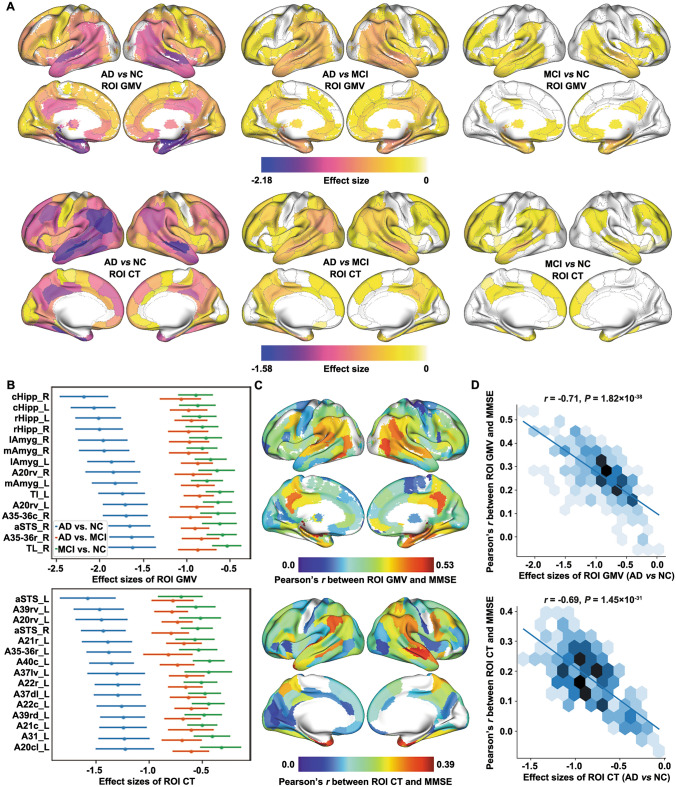
The current study aimed to evaluate the susceptibility to regional brain atrophy and its biological mechanism in Alzheimer's disease (AD). We conducted data-driven meta-analyses to combine 3,118 structural magnetic resonance images from three datasets to obtain robust atrophy patterns. Then we introduced a set of radiogenomic analyses to investigate the biological basis of the atrophy patterns in AD. Our results showed that the hippocampus and amygdala exhibit the most severe atrophy, followed by the temporal, frontal, and occipital lobes in mild cognitive impairment (MCI) and AD. The extent of atrophy in MCI was less severe than that in AD. A series of biological processes related to the glutamate signaling pathway, cellular stress response, and synapse structure and function were investigated through gene set enrichment analysis. Our study contributes to understanding the manifestations of atrophy and a deeper understanding of the pathophysiological processes that contribute to atrophy, providing new insight for further clinical research on AD.

Keywords: Alzheimer’s disease; Brain atrophy; Gene set enrichment analysis; Meta-analysis; Structural magnetic resonance imaging.


Conflict of interest statement

The authors declare no conflicts of interest.

Figures

Fig. 1
Fig. 1
Meta-analysis pipeline. A Structural magnetic resonance imaging (sMRI) images go through a unified processing pipeline to extract region of interest (ROI) features (gray matter volume, GMV and cortical thickness, CT), and a meta-analysis is conducted for each ROI. B Combining atrophy pattern with gene spatial expression patterns for gene set enrichment analysis. C Correlation analyses between atrophy pattern and positron emission tomography (PET) or single photon emission computed tomography (SPECT) features. ADNI, Alzheimer’s Disease Neuroimaging Initiative; EDSD, European diffusion tensor imaging study on dementia; MCAD, Multi-Center Alzheimer’s Disease Imaging; PLSR, partial least squares regression; AHBA, Allen Human Brain Atlas; GSEA, gene set enrichment analysis; Aβ, Amyloid beta; FDG, 18F-fluorodeoxyglucose.
Fig. 2
Fig. 2
Atrophy patterns based on 23 sites. A Gray matter volume (GMV) and cortical thickness (CT) atrophy patterns for Alzheimer’s disease (AD) vs normal control (NC), AD vs mild cognitive impairment (MCI), and MCI vs NC (PFWE <0.001). B 15 regions of interest (ROI) with the largest absolute effect sizes and their 95% confidence intervals for the ROI GMV/CT meta-analysis. Blue: AD vs NC, orange: AD vs MCI, green: MCI vs NC. C Pearson’s r between ROI GMV/CT and Mini-Mental State Examination (MMSE) (cognition-related ROI scores). D Correlation between ROI atrophy patterns and cognition-related ROI scores.
Fig. 3
Fig. 3
Validation analyses of the meta-analysis. A Region of interest (ROI) gray matter volume (GMV) and cortical thickness (CT) effect size correlations between sites in Alzheimer’s disease (AD) vs normal control (NC) meta-analysis. B Voxel/Vertex-wise meta-analysis result between AD and NC. C The meta-analysis results are based on original ROI GMV/CT values without removing covariates such as age, gender, and total intracranial volume. ADNI, Alzheimer’s Disease Neuroimaging Initiative; EDSD, European Diffusion Tensor Imaging Study On Dementia; MCAD, Multi-Center Alzheimer’s Disease Imaging.
Fig. 4
Fig. 4
Gene set enrichment analysis (GSEA) results based on Alzheimer’s disease (AD) vs normal control (NC) meta-analysis. A Directed acyclic graph of the results based on the region of interest (ROI) gray matter volume (GMV) atrophy patterns (PFDR <0.005) B Significant GSEA results based on the ROI GMV and cortical thickness (CT) atrophy patterns (PFDR <0.05).
Fig. 5
Fig. 5
Positron emission tomography (PET) and single photon emission computed tomography (SPECT) analyses results. A Overview of the Pearson correlation coefficients between the atrophy (gray matter volume, GMV and cortical thickness, CT) patterns and the Alzheimer’s Disease Neuroimaging Initiative (ADNI) amyloid-beta (Aβ) t-values/ADNI 18F-fluorodeoxyglucose (FDG) t-values/JuSpace neurotransmitter maps (only the values that the P and PPET_SA are <0.05 at the same time are displayed). B Correlation between ROI 5-hydroxytryptamine receptor 1A (5-HT1A) or ROI 5-hydroxytryptamine receptor 1B (5-HT1B) expression and ROI Aβ/FDG t-values. D1, dopamine D1 receptor; D2, dopamine D2 receptor; DAT, dopamine transporter; FDOPA, dopamine synthesis capacity; GABAA, gamma aminobutric acid type A receptor; MU, mu opiate receptor; NAT, noradrenaline transporter; 5-HT2A, 5-hydroxytryptamine receptor 2A; DASB, serotonin dihydrotetrabenazine tracer; MADAM, 11C-N,N-Dimethyl-2-(2-amino-4-methylphenylthio)benzylamine.

References

    1. Gómez-Isla T, Hollister R, West H, Mui S, Growdon JH, Petersen RC. Neuronal loss correlates with but exceeds neurofibrillary tangles in Alzheimer’s disease. Ann Neurol 1997, 41: 17–24. 10.1002/ana.410410106 - DOI - PubMed
    1. Andrade-Moraes CH, Oliveira-Pinto AV, Castro-Fonseca E, da Silva CG, Guimarães DM, Szczupak D, et al. Cell number changes in Alzheimer’s disease relate to dementia, not to plaques and tangles. Brain 2013, 136: 3738–3752. 10.1093/brain/awt273 - DOI - PMC - PubMed
    1. Vemuri P, Jack CR Jr. Role of structural MRI in Alzheimer’s disease. Alzheimers Res Ther 2010, 2: 23. 10.1186/alzrt47 - DOI - PMC - PubMed
    1. Zhao K, Chen P, Alexander-Bloch A, Wei Y, Dyrba M, Yang F, et al. A neuroimaging biomarker for Individual Brain-Related Abnormalities in Neurodegeneration (IBRAIN): A cross-sectional study. EClinicalMedicine 2023, 65: 102276. 10.1016/j.eclinm.2023.102276 - DOI - PMC - PubMed
    1. Karas GB, Scheltens P, Rombouts SARB, Visser PJ, van Schijndel RA, Fox NC, et al. Global and local gray matter loss in mild cognitive impairment and Alzheimer’s disease. Neuroimage 2004, 23: 708–716. 10.1016/j.neuroimage.2004.07.006 - DOI - PubMed

Publication types

MeSH terms

LinkOut - more resources