. 2024 Sep 27;75(18):5592-5610.
doi: 10.1093/jxb/erae245.

A gain-of-function mutation in BnaIAA13 disrupts vascular tissue and lateral root development in Brassica napus

Affiliations

A gain-of-function mutation in BnaIAA13 disrupts vascular tissue and lateral root development in Brassica napus

Jinxiang Gao et al. J Exp Bot. .

Erratum in

Abstract

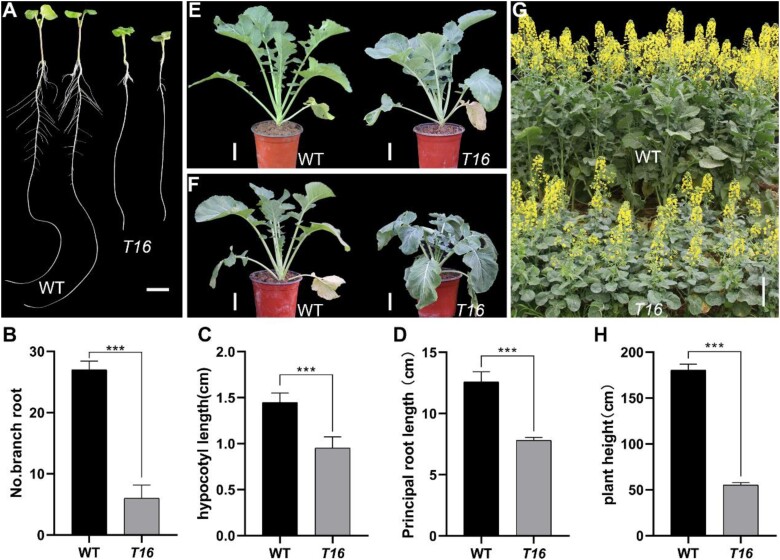
Rapeseed (Brassica napus) is an important oilseed crop worldwide. Plant vascular tissues are responsible for long-distance transport of water and nutrients and for providing mechanical support. The lateral roots absorb water and nutrients. The genetic basis of vascular tissue and lateral root development in rapeseed remains unknown. This study characterized an ethyl methanesulfonate-mutagenized rapeseed mutant, T16, which showed dwarf stature, reduced lateral roots, and leaf wilting. SEM observations showed that the internode cells were shortened. Observations of tissue sections revealed defects in vascular bundle development in the stems and petioles. Genetic analysis revealed that the phenotypes of T16 were controlled by a single semi-dominant nuclear gene. Map-based cloning and genetic complementarity identified BnaA03.IAA13 as the functional gene; a G-to-A mutation in the second exon changed glycine at position 79 to glutamic acid, disrupting the conserved degron motif VGWPP. Transcriptome analysis in roots and stems showed that auxin and cytokinin signaling pathways were disordered in T16. Evolutionary analysis showed that AUXIN/INDOLE-3-ACETIC ACID is conserved during plant evolution. The heterozygote of T16 showed significantly reduced plant height while maintaining other agronomic traits. Our findings provide novel insights into the regulatory mechanisms of vascular tissue and lateral root development, and offer a new germplasm resource for rapeseed breeding.

Keywords: BnaA03.IAA13; Brassica napus; lateral root; map-based cloning; plant height; vascular tissue.


Conflict of interest statement

The authors declare no conflicts of interest.

Figures

Fig. 1.
Fig. 1.
Phenotypic characterization of T16. (A) Comparison of the hypocotyl and root of T16 and the wild type (WT) ZS11. Bar=1 cm. (B–D) Statistical comparisons of the number of lateral roots (B), hypocotyl length (C), and principal root length (D) in T16 and WT plants. (E, F) Leaf phenotype at 09.00 h (E) and 13.00 h (F), showing wilting of T16. Bars=5 cm. (G) Comparison of plant height during the flowering period. Bar=25 cm. (H) Comparison of plant height at maturity. Values in (B–D, H) are means ±SD (n≥15). Asterisks indicate statistically significant differences (***P<0.001; Student’s t-test).
Fig. 2.
Fig. 2.
Analysis of histological sections of wild-type (WT) and T16 rapeseed plants. (A) Microscopic observation of paraffin sections of petiole vascular bundles. The red arrowheads indicate individual vascular bundles. ve, vessel. Bars=1 mm in the main images; 500 μm in the insets. (B) Statistical comparison of the number of vascular bundles in petioles of the WT and T16. (C) Microscopic observation of stem cross sections. Bar = 1 mm in the main images; 100 μm in the insets. (D, E) Statistical comparison of the number of stem vessels (D) and the radius of the vessels in the stem (E) of the WT and T16. (F) SEM observation of internode cell size. Bars=50 mm. (G) Statistical comparison of internode cell length in the WT and T16. Three biological replicates were performed for the cytological observations. Values in (B, D, E, G) are means ±SD (n=15). Asterisks indicate statistically significant differences (***P<0.001; Student’s t-test).
Fig. 3.
Fig. 3.
Genetic analysis and map-based cloning. (A) Phenotypes of wild type (WT), F1, and T16 plants at maturity. Bar=10 cm. (B) Statistical analysis of plant height at maturity (n=15). Asterisks indicate statistically significant differences (**P<0.01; Student’s t-test). (C) Plant height segregation ratio of the F2 and BC1 populations at maturity. (D) Chromosomal position information of differential SNPs obtained by using Brassica 50 K SNP BeadChip Array analysis. (E) Preliminary mapping of the functional gene. Identified candidate segments occupy a region of 2.1 Mb on ChrA03. (F) Fine mapping of the functional gene. Identified candidate segments occupy a region of 59.6 kb. (G) The 59.6 kb candidate region contains 11 genes, with BnaA03.IAA13 indicated in red.
Fig. 4.
Fig. 4.
Phylogenetic analysis of Aux/IAA proteins. (A) Phylogenetic tree of 14 IAA genes in Arabidopsis and 21 IAA genes in rapeseed, also showing the distribution of 10 motifs on Aux/IAA proteins. Analysis showed that BnaA03.IAA13 in rapeseed is homologous to IAA13 in Arabidopsis (highlighted with the red box). (B) Five motifs representing four conserved domains were distributed on the Aux/IAA proteins.
Fig. 5.
Fig. 5.
Verification of genetic complementarity. (A) The gene structure of BnaA03.IAA13 showing the locations of the SNPs. (B) The protein structure of BnaA03.IAA13 showing the locations of mutated amino acids resulting from the SNPs. (C) Complementary vector structure diagram. The vector was constructed using pCMBIA2300 as the vector backbone, inserting the mutated gene BnaA03.iaa13, including its upstream promoter region of 1149 bp and downstream 633 bp. The complementary vectors of SNP1 and SNP2 were created through targeted mutagenesis. (D) Phenotype of BnaA3.iaa13 rapeseed transgenic plants at maturity. A total of 26 transgenic lines were obtained, and phenotypic analysis was performed on four representative lines. Bar=5 cm. (E) Statistical analysis of plant height in rapeseed transgenic lines (n=10). (F) qRT–PCR analysis of BnaA03.iaa13 expression levels in rapeseed transgenic lines (n=3). BnaActin7 was used as a reference gene. (G) Phenotype of BnaA3.iaa13 Arabidopsis transgenic plants. At least 10 independent transgenic lines were obtained for each vector, and the transgenic plants of each vector had similar phenotypes. Bar=5 cm. (H) Statistical analysis of plant height in Arabidopsis transgenic lines (n=10). (I) qRT–PCR analysis of BnaA03.iaa13 expression levels in Arabidopsis transgenic lines (n=3). AtActin2 was used as a reference gene. The values in the bar charts represent the mean ±SD. Asterisks indicate statistically significant differences (*P<0.05, **P<0.01, ***P<0.001; Student’s t-test).
Fig. 6.
Fig. 6.
Expression pattern analysis of BnaA03.IAA13. (A) Expression analysis of BnaA03.IAA13 in various tissues of rapeseed, using BnaActin7 as a reference gene, with three biological replicates. R, root; LS, lower stem; MS, middle stem; US, upper stem; L, leaf; B, bud; SW, silique wall; S, seed. (B) GUS staining of different tissues in transgenic Arabidopsis plants. Expression of the GUS reporter gene was driven with the BnaA03.IAA13 promoter; four independent transgenic lines were observed and similar GUS staining results were obtained. Bar=1 mm. (C, D) Subcellular localization of BnaA3.IAA13 (C) and mutated protein BnaA3.iaa13 (D) in tobacco. H2B-mCherry was used as a nucleus-localized marker.
Fig. 7.
Fig. 7.
Transcriptome analysis of the stem and root of Arabidopsis transgenic plants, and interaction validation and cytokinin content analyses. (A) Gene expression heatmap of genes expressed in the stem enriched in GO terms related to the cell wall and glucosinolate biosynthetic process. (B) Gene expression heatmap of genes expressed in the root enriched in GO terms related to the cell wall and root development. (C) Gene expression heatmap of genes expressed in the stem enriched in KEGG pathways related to plant hormone signal transduction. (D) Gene expression heatmap of genes expressed in the root enriched in KEGG pathways related to plant hormone signal transduction. (E) A luciferase complementation assay confirmed the interaction between TIR1 and BnaA03.IAA13. (F, G) N6-(Δ2-isopentenyl)-adenine (ip) and trans-zeatin (tZ) concentrations in the root and stem. Values represent the mean ±SD (n=4). Asterisks indicate statistically significant differences (*P<0.05, **P<0.01, ***P<0.001; Student’s t-test).
Fig. 8.
Fig. 8.
Testing and verification of the value of T16 for practical breeding. (A) The phenotype of F1 plants produced by hybridization between T16 and the elite inbred line 7112 at maturity. (B) The phenotype of F1 plants produced by hybridization between T16 and the elite variety ZS11 at maturity. (C–G) Investigation of the yield of hybrid offspring produced by crosses between T16 and 7112. SPP, siliques per plant; SPS: seeds per silique; TSW: thousand-seed weight; YPP: yield per plant. (H–L) Investigation of the yield of hybrid offspring produced by crosses between T16 and ZS11. Values in (C–L) are means ±SD (n =15). Asterisks indicate statistically significant differences (***P<0.001; Student’s t-test). (M) A derived cleaved amplified polymorphic sequence marker developed based on SNP1. Polyacrylamide gel electrophoresis detection after digestion with the restriction endonuclease BsaBI. Lanes 1–10 are before digestion and lanes 12–21 are after digestion; lanes 7–10 are different varieties. (N) A CAPS marker developed based on SNP2; agarose gel electrophoresis detection after digestion with the restriction endonuclease BrsI digestion.
Fig. 9.
Fig. 9.
Model showing the involvement of BnaA03.IAA13 in regulating vascular and lateral root development in rapeseed. BnaA03.IAA13 inhibits the transcriptional regulatory activity of ARFs by interacting with them. When the concentration of auxin is appropriate, BnaA03.IAA13 undergoes ubiquitination degradation, releasing the transcriptional regulatory activity of ARFs. In the stem, ARFs affect plant growth and vascular development by regulating auxin and cytokinin signaling. In the roots, ARFs affect lateral root development through multiple pathways, such as SRSs, LBDs, WOXs, auxin, and cytokinin signaling.

Similar articles

References

    1. Bishopp A, Lehesranta S, Vatén A, et al.. 2011. Phloem-transported cytokinin regulates polar auxin transport and maintains vascular pattern in the root meristem. Current Biology 21, 927–932. - PubMed
    1. Brackmann K, Qi J, Gebert M, et al.. 2018. Spatial specificity of auxin responses coordinates wood formation. Nature Communications 9, 875. - PMC - PubMed
    1. Carlsbecker A, Lee JY, Roberts CJ, et al.. 2010. Cell signalling by microRNA165/6 directs gene dose-dependent root cell fate. Nature 465, 316–321. - PMC - PubMed
    1. Casimiro I, Beeckman T, Graham N, Bhalerao R, Zhang H, Casero P, Sandberg G, Bennett MJ.. 2003. Dissecting Arabidopsis lateral root development. Trends in Plant Science 8, 165–171. - PubMed
    1. Causier B, Lloyd J, Stevens L, Davies B.. 2012. TOPLESS co-repressor interactions and their evolutionary conservation in plants. Plant Signaling & Behavior 7, 325–328. - PMC - PubMed

MeSH terms

LinkOut - more resources