

Photodynamic priming modulates cellular ATP levels to overcome P-glycoprotein-mediated drug efflux in chemoresistant triple-negative breast cancer
- PMID: 38824410
- PMCID: PMC11737009
- DOI: 10.1111/php.13970
Photodynamic priming modulates cellular ATP levels to overcome P-glycoprotein-mediated drug efflux in chemoresistant triple-negative breast cancer
Abstract
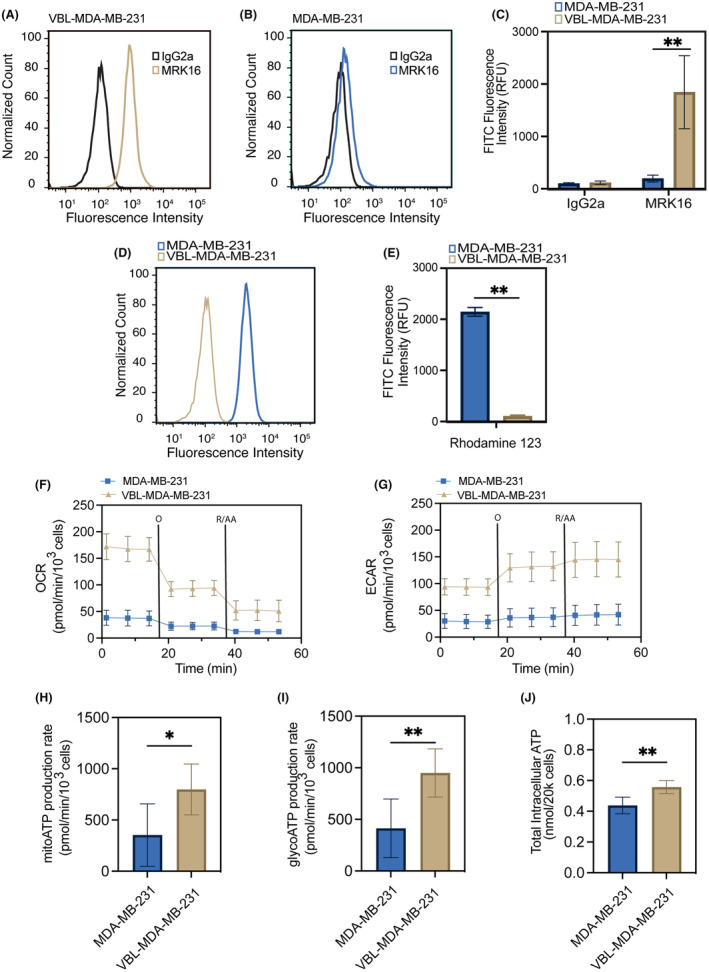
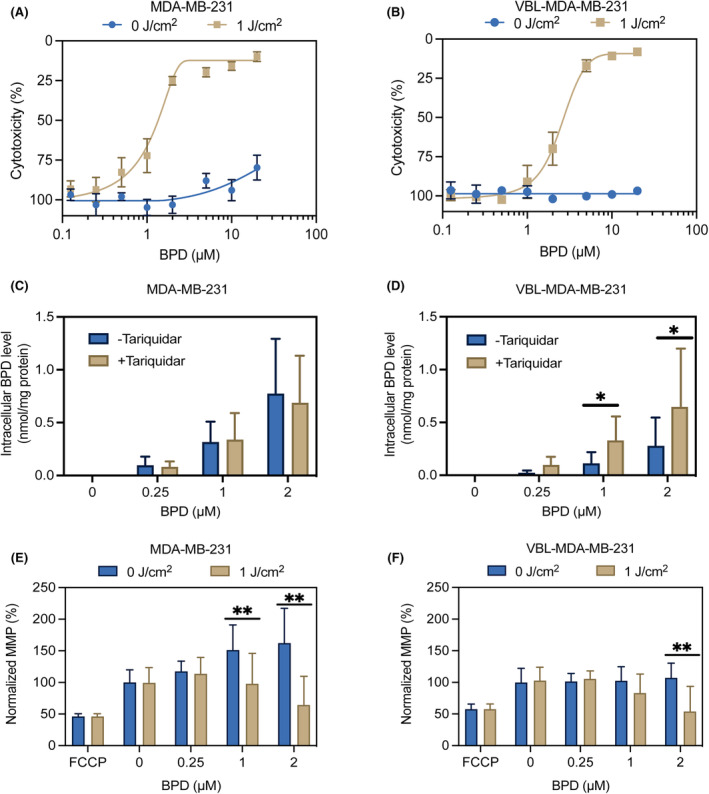
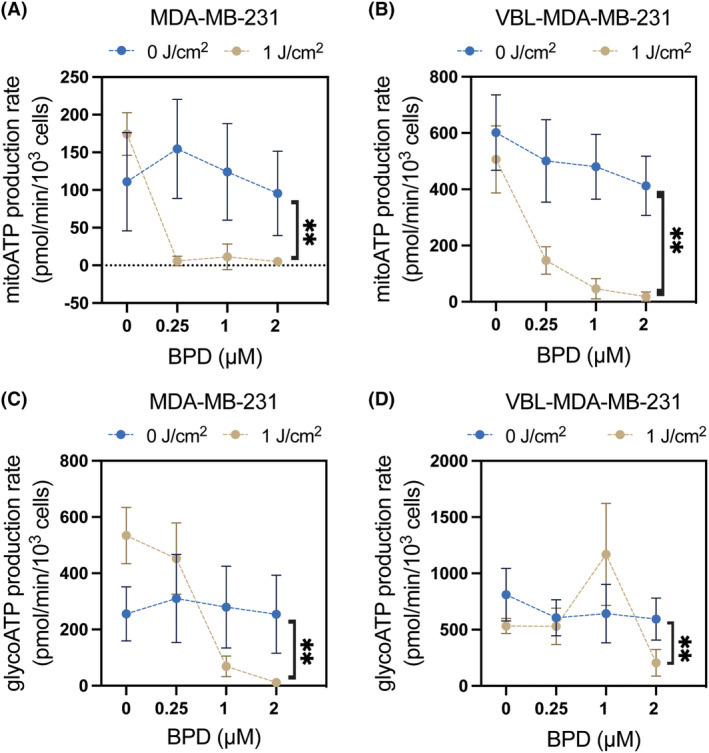
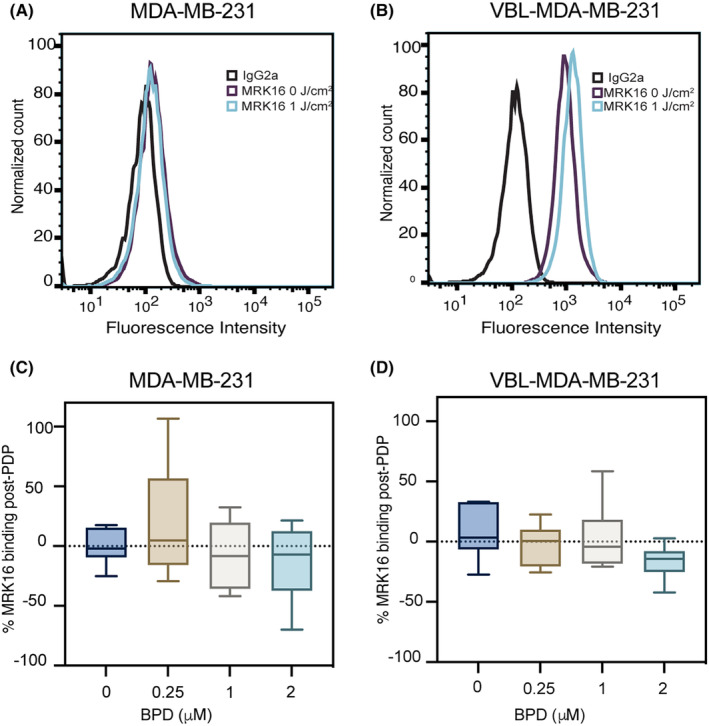
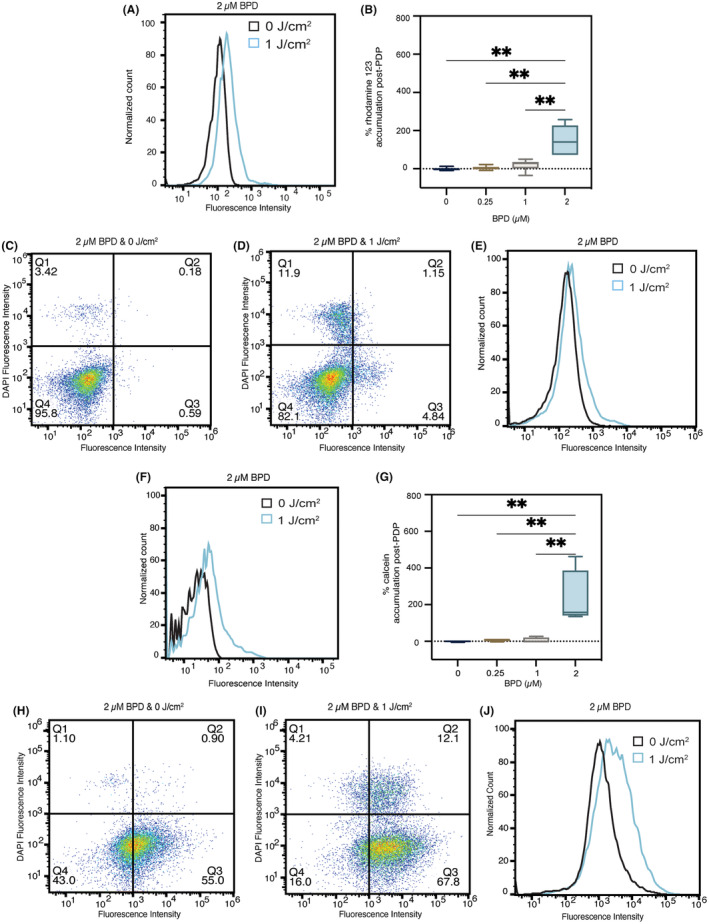
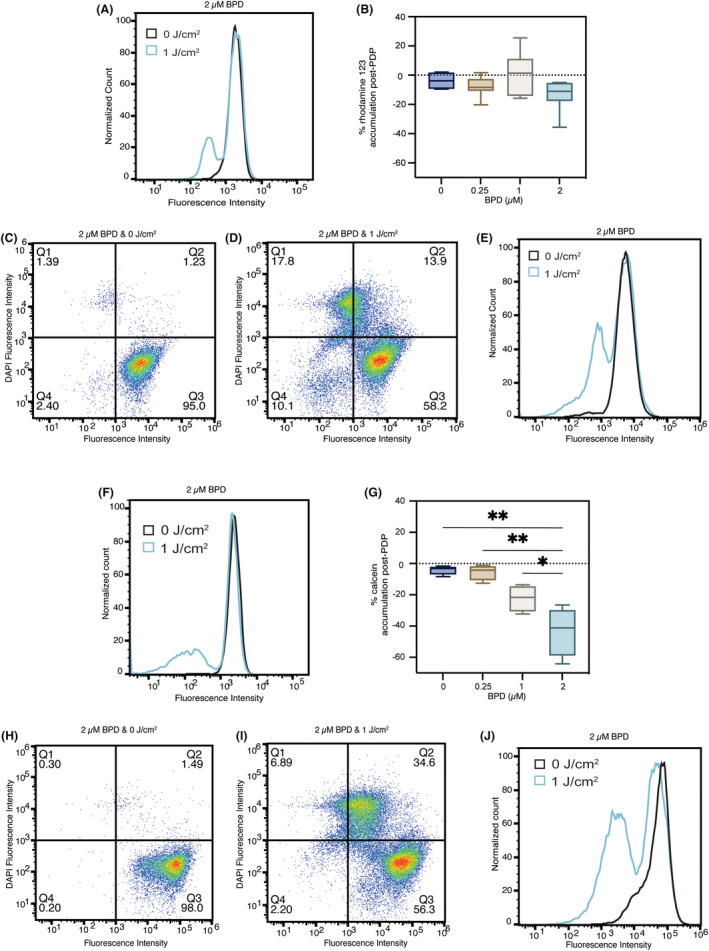
P-glycoprotein (P-gp, ABCB1) is a well-researched ATP-binding cassette (ABC) drug efflux transporter linked to the development of cancer multidrug resistance (MDR). Despite extensive studies, approved therapies to safely inhibit P-gp in clinical settings are lacking, necessitating innovative strategies beyond conventional inhibitors or antibodies to reverse MDR. Photodynamic therapy is a globally approved cancer treatment that uses targeted, harmless red light to activate non-toxic photosensitizers, confining its cytotoxic photochemical effects to disease sites while sparing healthy tissues. This study demonstrates that photodynamic priming (PDP), a sub-cytotoxic photodynamic therapy process, can inhibit P-gp function by modulating cellular respiration and ATP levels in light accessible regions. Using chemoresistant (VBL-MDA-MB-231) and chemosensitive (MDA-MB-231) triple-negative breast cancer cell lines, we showed that PDP decreases mitochondrial membrane potential by 54.4% ± 30.4 and reduces mitochondrial ATP production rates by 94.9% ± 3.46. Flow cytometry studies showed PDP can effectively improve the retention of P-gp substrates (calcein) by up to 228.4% ± 156.3 in chemoresistant VBL-MDA-MB-231 cells, but not in chemosensitive MDA-MB-231 cells. Further analysis revealed that PDP did not alter the cell surface expression level of P-gp in VBL-MDA-MB-231 cells. These findings indicate that PDP can reduce cellular ATP below the levels that is required for the function of P-gp and improve intracellular substrate retention. We propose that PDP in combination with chemotherapy drugs, might improve the efficacy of chemotherapy and overcome cancer MDR.
Keywords: ABC transporter; P‐glycoprotein; cellular ATP levels; drug delivery; multidrug resistance; photodynamic priming.
© 2024 The Author(s). Photochemistry and Photobiology published by Wiley Periodicals LLC on behalf of American Society for Photobiology.
Conflict of interest statement
The authors declare that they have no known competing financial interests or personal relationships that could have appeared to influence the work reported in this paper.
Figures
Similar articles
-
Low-intensity pulsed ultrasound combined with microbubble mediated JNK/c-Jun pathway to reverse multidrug resistance in triple-negative breast cancer.Sci Rep. 2024 Nov 8;14(1):27250. doi: 10.1038/s41598-024-78272-y. Sci Rep. 2024. PMID: 39516537 Free PMC article.
-
Modulation of function of three ABC drug transporters, P-glycoprotein (ABCB1), mitoxantrone resistance protein (ABCG2) and multidrug resistance protein 1 (ABCC1) by tetrahydrocurcumin, a major metabolite of curcumin.Mol Cell Biochem. 2007 Feb;296(1-2):85-95. doi: 10.1007/s11010-006-9302-8. Epub 2006 Sep 8. Mol Cell Biochem. 2007. PMID: 16960658
-
Porphyrin-lipid assemblies and nanovesicles overcome ABC transporter-mediated photodynamic therapy resistance in cancer cells.Cancer Lett. 2019 Aug 10;457:110-118. doi: 10.1016/j.canlet.2019.04.037. Epub 2019 May 6. Cancer Lett. 2019. PMID: 31071369 Free PMC article.
-
A light in multidrug resistance: photodynamic treatment of multidrug-resistant tumors.J Biomed Sci. 2003 Jul-Aug;10(4):361-6. doi: 10.1007/BF02256427. J Biomed Sci. 2003. PMID: 12824695 Review.
-
Chemical molecular-based approach to overcome multidrug resistance in cancer by targeting P-glycoprotein (P-gp).Med Res Rev. 2021 Jan;41(1):525-555. doi: 10.1002/med.21739. Epub 2020 Oct 12. Med Res Rev. 2021. PMID: 33047304 Review.
Cited by
-
Screening of photosensitizers-ATP binding cassette (ABC) transporter interactions in vitro.Cancer Drug Resist. 2024 Sep 21;7:35. doi: 10.20517/cdr.2024.50. eCollection 2024. Cancer Drug Resist. 2024. PMID: 39403604 Free PMC article.
-
Leveraging adenosine triphosphate for cancer theranostics.Theranostics. 2025 Mar 24;15(10):4708-4733. doi: 10.7150/thno.106291. eCollection 2025. Theranostics. 2025. PMID: 40225571 Free PMC article. Review.
References
-
- Dean M, Hamon Y, Chimini G. The human ATP‐binding cassette (ABC) transporter superfamily. J Lipid Res. 2001;42(7):1007‐1017. - PubMed
-
- Schinkel AH, Jonker JW. Mammalian drug efflux transporters of the ATP binding cassette (ABC) family: an overview. Adv Drug Deliv Rev. 2003;55(1):3‐29. - PubMed
-
- Gottesman MM, Fojo T, Bates SE. Multidrug resistance in cancer: role of ATP‐dependent transporters. Nat Rev Cancer. 2002;2(1):48‐58. - PubMed
MeSH terms
Substances
Grants and funding
LinkOut - more resources
Full Text Sources
Miscellaneous
