. 2024 Jun 1;43(1):157.
doi: 10.1186/s13046-024-03080-1.

PI3Kγ inhibition combined with DNA vaccination unleashes a B-cell-dependent antitumor immunity that hampers pancreatic cancer

Affiliations

PI3Kγ inhibition combined with DNA vaccination unleashes a B-cell-dependent antitumor immunity that hampers pancreatic cancer

Claudia Curcio et al. J Exp Clin Cancer Res. .

Abstract

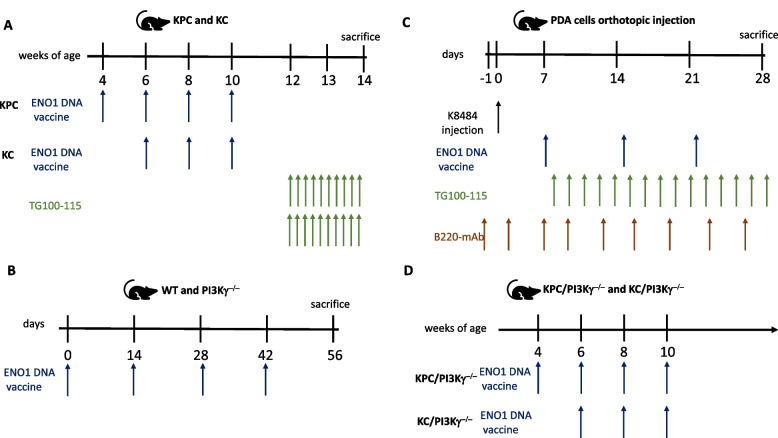
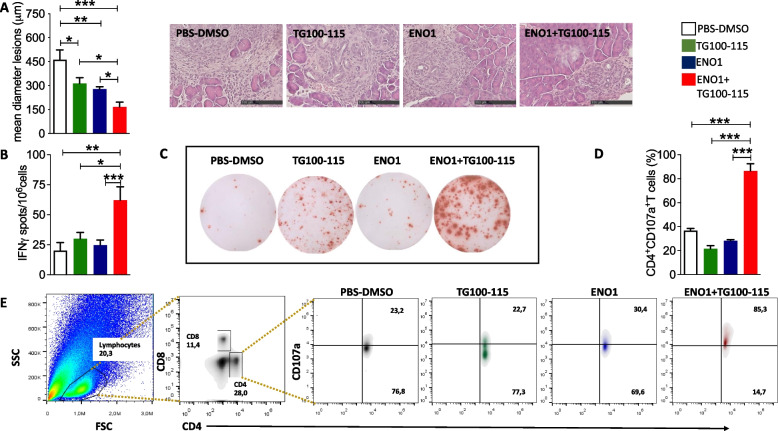
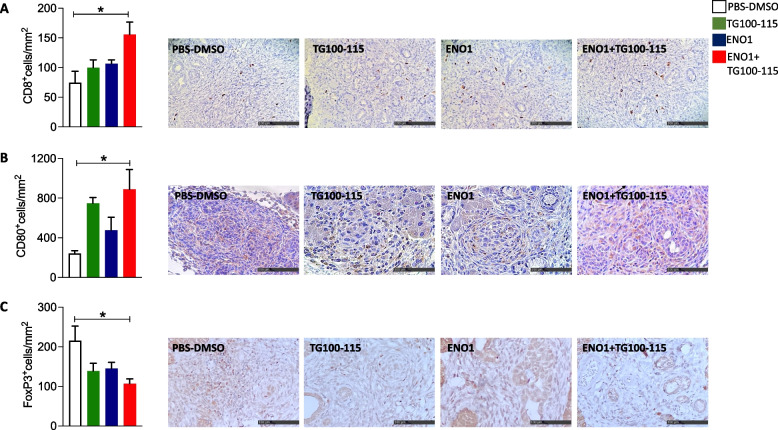
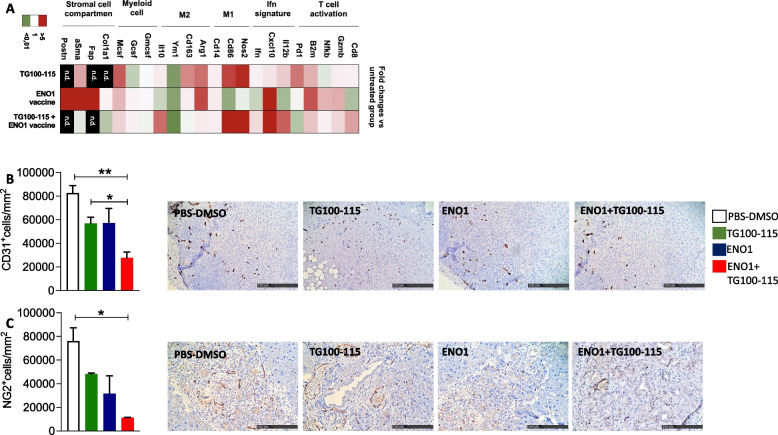
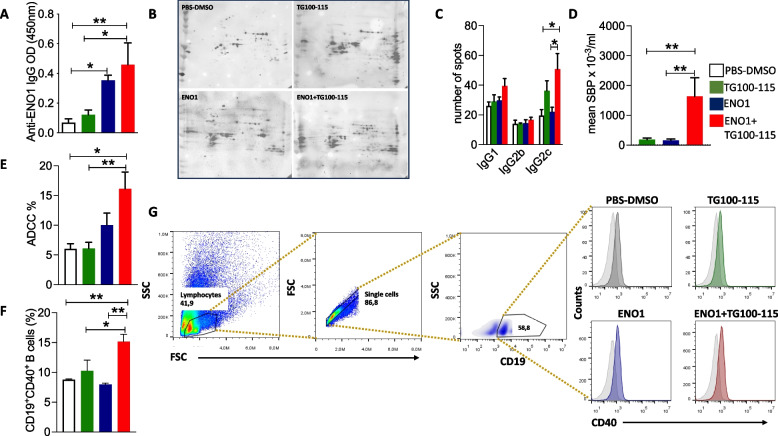
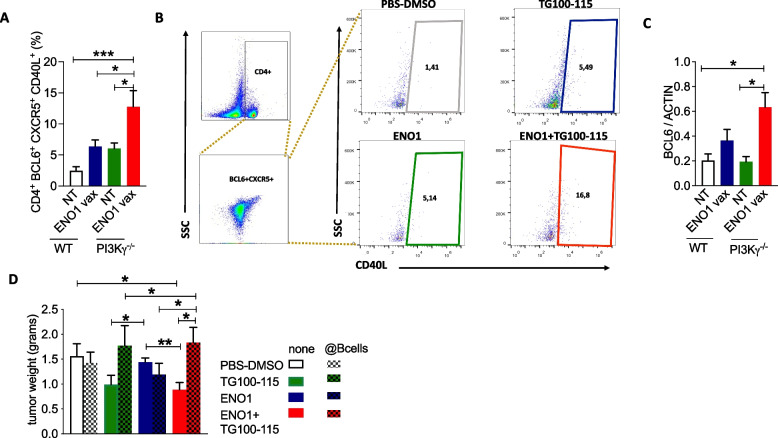
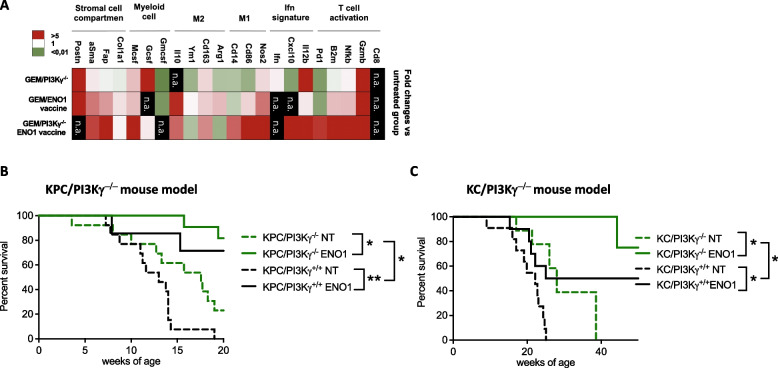
Phosphoinositide-3-kinase γ (PI3Kγ) plays a critical role in pancreatic ductal adenocarcinoma (PDA) by driving the recruitment of myeloid-derived suppressor cells (MDSC) into tumor tissues, leading to tumor growth and metastasis. MDSC also impair the efficacy of immunotherapy. In this study we verify the hypothesis that MDSC targeting, via PI3Kγ inhibition, synergizes with α-enolase (ENO1) DNA vaccination in counteracting tumor growth.Mice that received ENO1 vaccination followed by PI3Kγ inhibition had significantly smaller tumors compared to those treated with ENO1 alone or the control group, and correlated with i) increased circulating anti-ENO1 specific IgG and IFNγ secretion by T cells, ii) increased tumor infiltration of CD8+ T cells and M1-like macrophages, as well as up-modulation of T cell activation and M1-like related transcripts, iii) decreased infiltration of Treg FoxP3+ T cells, endothelial cells and pericytes, and down-modulation of the stromal compartment and T cell exhaustion gene transcription, iv) reduction of mature and neo-formed vessels, v) increased follicular helper T cell activation and vi) increased "antigen spreading", as many other tumor-associated antigens were recognized by IgG2c "cytotoxic" antibodies. PDA mouse models genetically devoid of PI3Kγ showed an increased survival and a pattern of transcripts in the tumor area similar to that of pharmacologically-inhibited PI3Kγ-proficient mice. Notably, tumor reduction was abrogated in ENO1 + PI3Kγ inhibition-treated mice in which B cells were depleted.These data highlight a novel role of PI3Kγ in B cell-dependent immunity, suggesting that PI3Kγ depletion strengthens the anti-tumor response elicited by the ENO1 DNA vaccine.


Conflict of interest statement

EH is co-funder and board member of Kither Biotech, JAV is a consultant for Infinity Pharmaceuticals and a shareholder in Impact Biosciences and AlphaBeta Therapeutics.

Figures

Fig. 1
Fig. 1
Schematic representation of treatment schedules
Fig. 2
Fig. 2
Effect of ENO1 DNA vaccination and PI3Kγ inhibition in KPC mice. Evaluation of the mean tumor lesion diameter in treated mice sacrificed at 14 weeks of age, and representative images of pancreatic tumor lesions (A). The scale bar represents 100-μm. ELISpot analysis of IFNγ-secreting cells (indicated as the number of specific spots) from different treatment groups at sacrifice, after in vitro restimulation with recombinant ENO1 (B). Representative ELISpot images from different treatments (C). Flow cytometry analysis of cytotoxic T cells in pancreatic tumor tissues from mice in different treatment groups (D). Representative cytogram analysis (D). Representative density plots show: in grey, cells from the PBS-DMSO group, in green, from the TG100-115 inhibitor; in blue, from the ENO1 DNA vaccine; in red, from the ENO1 + TG100-115 combined treatment. The lymphocytes population was identified according to physical parameters (first panel, frame black). For T cell subset analysis, we gated for CD4 and CD8 (second panel), and the expression of CD107a on all CD4.+ T cells (third, fourth, fifth and sixth panels) was evaluated. (E). Treatment groups: white bars, PBS-DMSO; green bars, TG100-115 inhibitor; blue bars, ENO1 DNA vaccine; red bars, ENO1 + TG100-115, combined treatment. In all experiments, the number of mice per group was between 5 and 10; graphs report the mean ± SEM values, and statistical significance using one way ANOVA test is shown, *p < 0.05, **p < 0.001, and ***p < 0.0001
Fig. 3
Fig. 3
Characterization of immune infiltrates induced by combined treatment. Immunohistochemical staining for CD8 T lymphocytes (A), CD80+ M1-like macrophages (B), and FoxP3.+ Treg (C) cells in tumor lesions of KPC mice at sacrifice. Representative images from each staining are shown. The scale bar represents 100-μm. Treatment groups: white bars, PBS-DMSO; green bars, TG100-115 inhibitor; blue bars, ENO1 DNA vaccine; red bars, ENO1 + TG100-115, combined treatment. In all experiments, the number of mice per group was between 5 and 10; graphs report the mean ± SEM values, and statistical significance using one way ANOVA test is shown, *p < 0.05, **p < 0.001, and ***p < 0.0001
Fig. 4
Fig. 4
Combined treatment modifies stromal cell compartment and vessel permeability. Heat-map represents the fold change of 2^-deltaCt values of the treated groups compared to the untreated group (A). mRNA extracts from FFPE tumors of 4–6 mice from each group were analyzed. Gapdh was used as a housekeeping gene to obtain delta-Ct values used for the analysis. Green tones represent downregulation of mRNA, red tones upregulation, white tones no change compared to the untreated group. The genes not detected by qPCR are indicated as “n.a.”. Immunohistochemical staining for endothelial CD31+ cells (B) and neo-formed pericyte NG2.+ cells (C) in pancreatic tissues. Representative images from each staining are shown. The scale bar represents 100-μm. Treatment groups: white bars, PBS-DMSO; green bars, TG100-115 inhibitor; blue bars, ENO1 DNA vaccine; red bars, ENO1 + TG100-115, combined treatment. In all experiments, the number of mice per group was between 6 and 12; graphs report the mean ± SEM values and statistical significance using one way ANOVA test is shown, *p < 0.05, **p < 0.001, and ***p < 0.0001
Fig. 5
Fig. 5
Combined therapy increases the humoral response and induces the antigen spreading effect. ELISA detection of anti-ENO1 IgG titer (referred to as OD) in sera of mice (A). IgG2c recognition of the proteome 2-DE map of the K8484 cell line by representative serum from mice treated with different therapies (B). IgG1, IgG2b and IgG2c quantitative evaluation of all recognized spots from treated mice (C). Serum binding potential (SBP) evaluated by flow cytometry in mice from different treatments collected at 14 weeks of age (D). Antibody dependent cellular cytotoxicity (ADCC) percentage evaluated by flow cytometry (E). Cytofluorimetric analysis of activated CD19+ CD40+ B cells in spleen from mice treated with different therapies (F). Representative gating strategy to analyze CD40 on CD19 positive cells (G). The lymphocyte population was isolated according to physical parameters (first panel), considering only single cells (second panel). According to CD19 positivity we gated B cells (last upper panel), on which we analyzed CD40 positive cells (lower panels). One representative histogram for each group is shown: grey peak, PBS-DMSO; green peak, TG100-115 inhibitor; blue peak, ENO1 DNA vaccine; red peak, ENO1 + TG100-115, combined treatment, light grey peak represents the isotype control. Treatment groups: white bars, PBS-DMSO; green bars, TG100-115 inhibitor; blue bars, ENO1 DNA vaccine; red bars, ENO1+TG100-115 combined treatment. In all experiments, the number of mice per group was between 3 and 10; graphs report the mean±SEM values, and statistical significance using one way ANOVA test is shown, *p < 0.05, **p < 0.001, and ***p < 0.0001
Fig. 6
Fig. 6
Combined therapy increases activated Thf cells and favors a B cell-dependent antitumor immune response. Flow cytometry analysis (A)and representative cytogram (B)of activated Thf cells in lymph nodes of C57/Bl6 WT and PI3K γ-/- vaccinated or unvaccinated mice. After the gating of T lymphocytes, we considered the BCL6+CXCR5+ on CD4+ T cells. On the selected Thf we analyzed the percentage of CD40L+ cells. Western blot analysis of BCL6 expression in lymph nodes of WT and PI3Kg vaccinated or unvaccinated mice (C). Tumor weight of mice that were treated and B cell depleted (checkered bars) or undepleted (D). Treatment groups: white bars, PBS-DMSO; green bars, TG100-115 inhibitor; blue bars, ENO1 DNA vaccine; red bars, ENO1+TG100-115 combined treatment. In all experiments, the number of mice per group was between 5 and 12; graphs report the mean±SEM values, and statistical significance using one way ANOVA test is shown, *p < 0.05, **p < 0.001, and ***p < 0.0001
Fig. 7
Fig. 7
ENO1 DNA vaccination in PI3Kγ−/− deficient mice increases survival, modulates immune and stromal cell compartment. Heat-map represents the fold change of 2^-deltaCt values of the treated groups compared to the untreated group (A). mRNA extracts from FFPE tumors of 4–6 mice from each group were analyzed. Gapdh was used as a housekeeping gene to obtain delta-Ct values used for the analysis. Green tones represent downregulation of mRNA, red tones upregulation, white tones no change compared to the untreated group. The genes not detected by qPCR are indicated as “n.a.”. Survival curves of KPC or KPC/PI3Kγ−/−(B) and KC or KC/PI3K γ.−/−(C) untreated (green or black dotted line) or ENO1-vaccinated (green or black line). In all experiments, the number of mice per group was between 7 and 13. Statistical differences using Long-Rank test are shown in the graph, *p < 0.05, **p < 0.001, and ***p < 0.0001

Similar articles

Cited by

References

    1. Balachandran VP, Beatty GL, Dougan SK. Broadening the impact of immunotherapy to pancreatic cancer: challenges and opportunities. Gastroenterology. 2019;156:2056–2072. doi: 10.1053/j.gastro.2018.12.038. - DOI - PMC - PubMed
    1. Wang D, Liu C, Zhou Y, et al. Effect of neoadjuvant radiotherapy on survival of non-metastatic pancreatic ductal adenocarcinoma: a SEER database analysis. Radiat Oncol. 2020;15:107. doi: 10.1186/s13014-020-01561-z. - DOI - PMC - PubMed
    1. Riquelme E, Zhang Y, Zhang L, et al. Tumor microbiome diversity and composition influence pancreatic cancer outcomes. Cell. 2019;178:795–806.e12. doi: 10.1016/j.cell.2019.07.008. - DOI - PMC - PubMed
    1. Chandana S, Babiker HM, Mahadevan D. Therapeutic trends in pancreatic ductal adenocarcinoma (PDAC) Expert Opin Investig Drugs. 2019;28:161–177. doi: 10.1080/13543784.2019.1557145. - DOI - PubMed
    1. Singhi AD, Koay EJ, Chari ST, et al. Early detection of pancreatic cancer: opportunities and challenges. Gastroenterology. 2019;156:2024–2040. doi: 10.1053/j.gastro.2019.01.259. - DOI - PMC - PubMed

MeSH terms