

Bayesian genome-wide TWAS with reference transcriptomic data of brain and blood tissues identified 141 risk genes for Alzheimer's disease dementia
- PMID: 38824563
- PMCID: PMC11144322
- DOI: 10.1186/s13195-024-01488-7
Bayesian genome-wide TWAS with reference transcriptomic data of brain and blood tissues identified 141 risk genes for Alzheimer's disease dementia
Abstract
Background: Transcriptome-wide association study (TWAS) is an influential tool for identifying genes associated with complex diseases whose genetic effects are likely mediated through transcriptome. TWAS utilizes reference genetic and transcriptomic data to estimate effect sizes of genetic variants on gene expression (i.e., effect sizes of a broad sense of expression quantitative trait loci, eQTL). These estimated effect sizes are employed as variant weights in gene-based association tests, facilitating the mapping of risk genes with genome-wide association study (GWAS) data. However, most existing TWAS of Alzheimer's disease (AD) dementia are limited to studying only cis-eQTL proximal to the test gene. To overcome this limitation, we applied the Bayesian Genome-wide TWAS (BGW-TWAS) method to leveraging both cis- and trans- eQTL of brain and blood tissues, in order to enhance mapping risk genes for AD dementia.
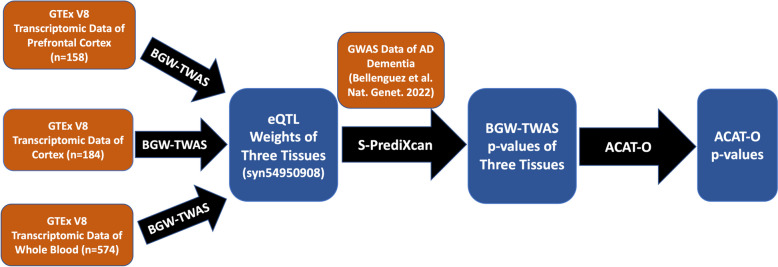
Methods: We first applied BGW-TWAS to the Genotype-Tissue Expression (GTEx) V8 dataset to estimate cis- and trans- eQTL effect sizes of the prefrontal cortex, cortex, and whole blood tissues. Estimated eQTL effect sizes were integrated with the summary data of the most recent GWAS of AD dementia to obtain BGW-TWAS (i.e., gene-based association test) p-values of AD dementia per gene per tissue type. Then we used the aggregated Cauchy association test to combine TWAS p-values across three tissues to obtain omnibus TWAS p-values per gene.
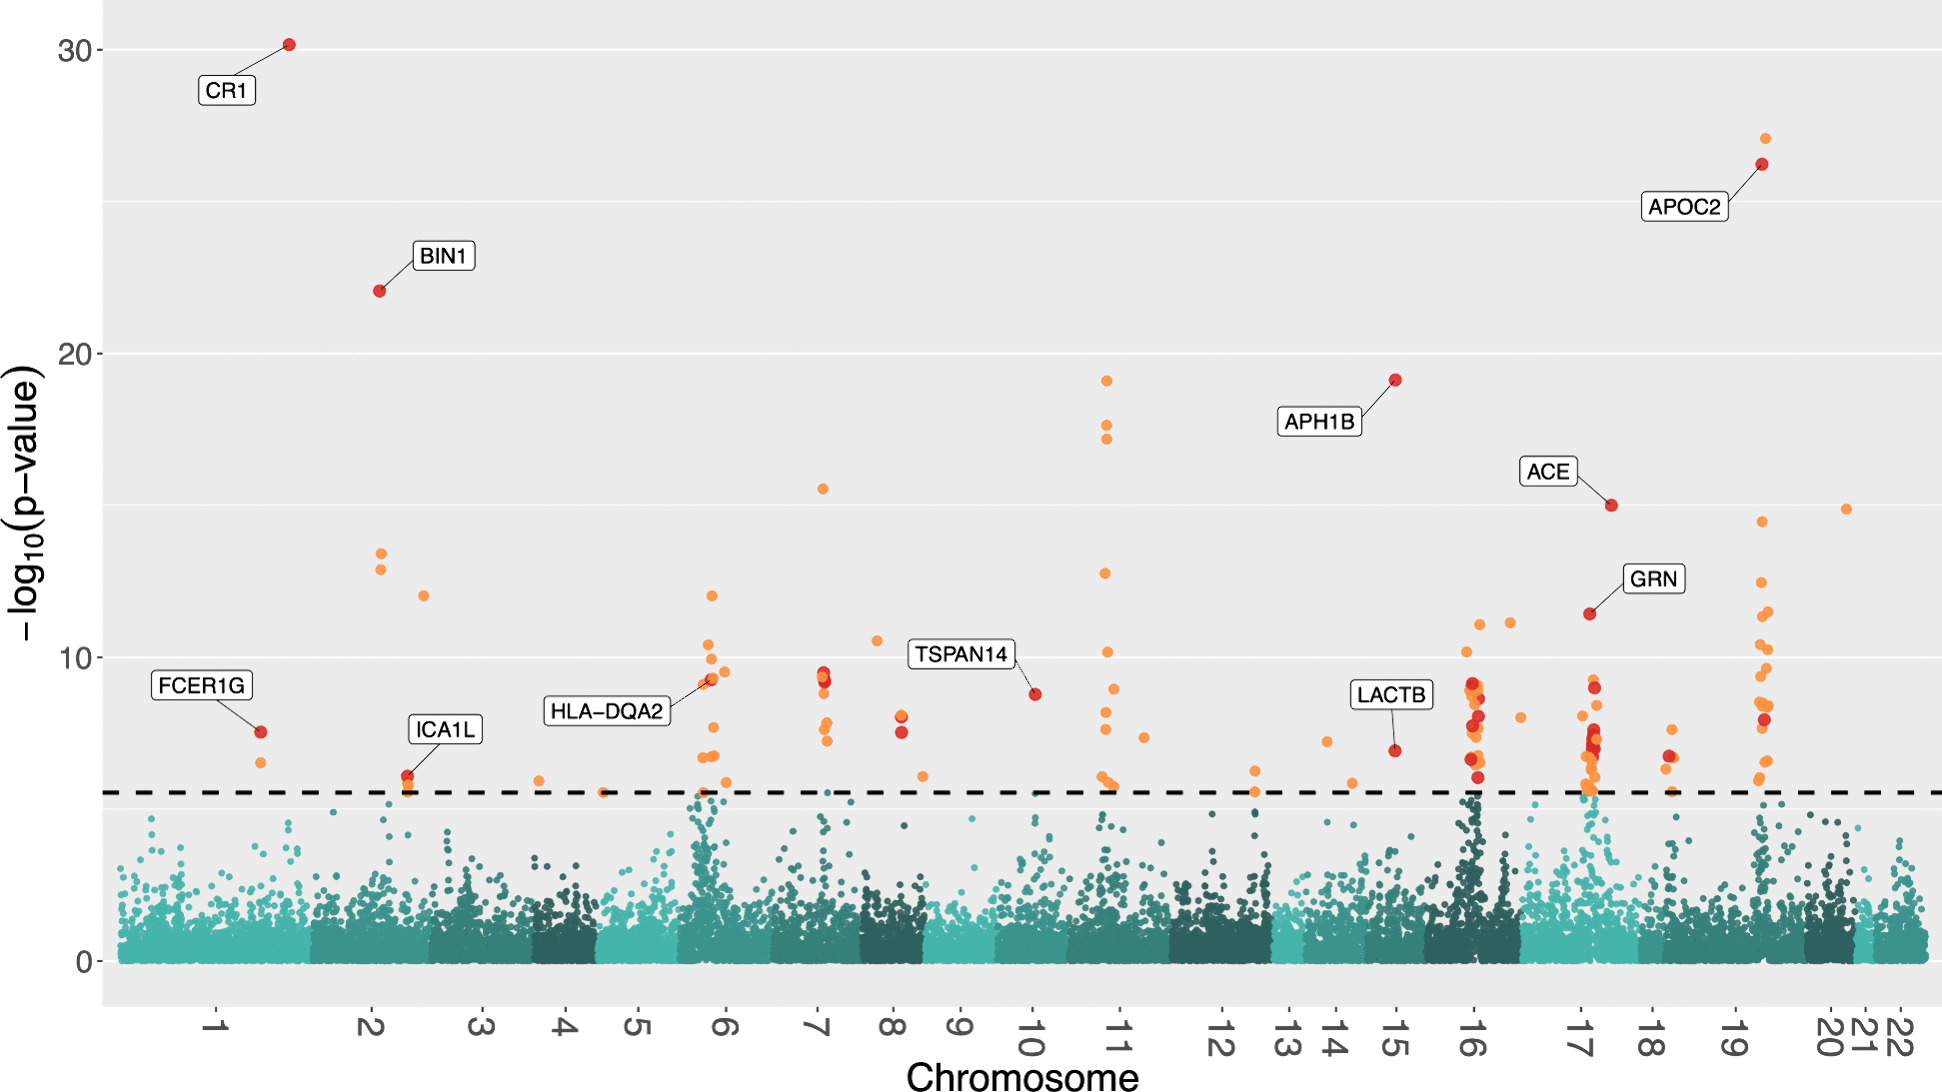
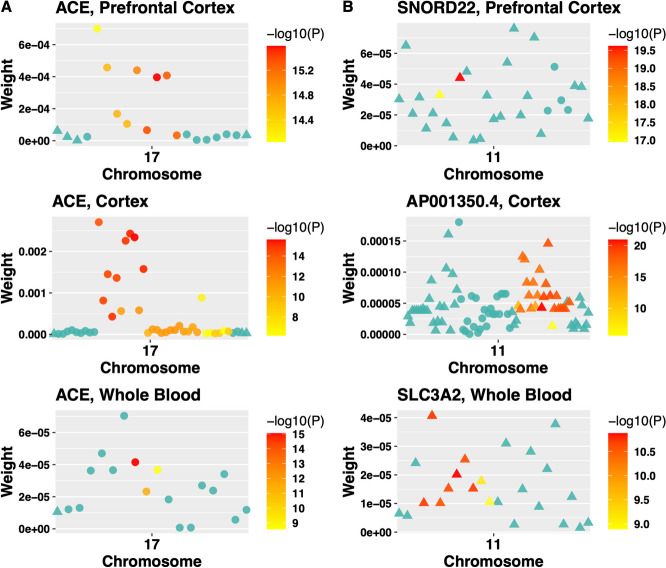
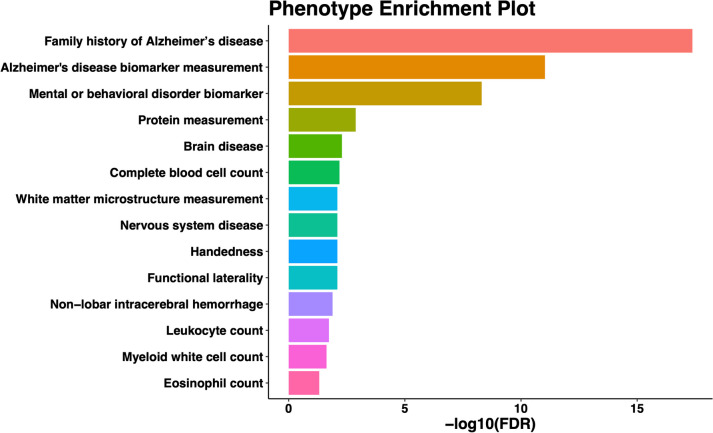
Results: We identified 85 significant genes in prefrontal cortex, 82 in cortex, and 76 in whole blood that were significantly associated with AD dementia. By combining BGW-TWAS p-values across these three tissues, we obtained 141 significant risk genes including 34 genes primarily due to trans-eQTL and 35 mapped risk genes in GWAS Catalog. With these 141 significant risk genes, we detected functional clusters comprised of both known mapped GWAS risk genes of AD in GWAS Catalog and our identified TWAS risk genes by protein-protein interaction network analysis, as well as several enriched phenotypes related to AD.
Conclusion: We applied BGW-TWAS and aggregated Cauchy test methods to integrate both cis- and trans- eQTL data of brain and blood tissues with GWAS summary data, identifying 141 TWAS risk genes of AD dementia. These identified risk genes provide novel insights into the underlying biological mechanisms of AD dementia and potential gene targets for therapeutics development.
Keywords: Cis-eQTL; Trans-eQTL; Aggregated cauchy association test; Alzheimer’s disease dementia; Bayesian genome-wide TWAS.
© 2024. The Author(s).
Conflict of interest statement
The authors declare no competing interests.
Figures

Update of
-
Bayesian genome-wide TWAS with reference transcriptomic data of brain and blood tissues identified 93 risk genes for Alzheimer's disease dementia.medRxiv [Preprint]. 2023 Jul 12:2023.07.06.23292336. doi: 10.1101/2023.07.06.23292336. medRxiv. 2023. Update in: Alzheimers Res Ther. 2024 Jun 1;16(1):120. doi: 10.1186/s13195-024-01488-7. PMID: 37503151 Free PMC article. Updated. Preprint.
Similar articles
-
Bayesian genome-wide TWAS with reference transcriptomic data of brain and blood tissues identified 93 risk genes for Alzheimer's disease dementia.medRxiv [Preprint]. 2023 Jul 12:2023.07.06.23292336. doi: 10.1101/2023.07.06.23292336. medRxiv. 2023. Update in: Alzheimers Res Ther. 2024 Jun 1;16(1):120. doi: 10.1186/s13195-024-01488-7. PMID: 37503151 Free PMC article. Updated. Preprint.
-
Bayesian Genome-wide TWAS Method to Leverage both cis- and trans-eQTL Information through Summary Statistics.Am J Hum Genet. 2020 Oct 1;107(4):714-726. doi: 10.1016/j.ajhg.2020.08.022. Epub 2020 Sep 21. Am J Hum Genet. 2020. PMID: 32961112 Free PMC article.
-
Novel Variance-Component TWAS method for studying complex human diseases with applications to Alzheimer's dementia.PLoS Genet. 2021 Apr 2;17(4):e1009482. doi: 10.1371/journal.pgen.1009482. eCollection 2021 Apr. PLoS Genet. 2021. PMID: 33798195 Free PMC article.
-
Opportunities and challenges for transcriptome-wide association studies.Nat Genet. 2019 Apr;51(4):592-599. doi: 10.1038/s41588-019-0385-z. Epub 2019 Mar 29. Nat Genet. 2019. PMID: 30926968 Free PMC article. Review.
-
From GWAS to Gene: Transcriptome-Wide Association Studies and Other Methods to Functionally Understand GWAS Discoveries.Front Genet. 2021 Sep 30;12:713230. doi: 10.3389/fgene.2021.713230. eCollection 2021. Front Genet. 2021. PMID: 34659337 Free PMC article. Review.
Cited by
-
Effect of neuroinflammation on the progression of Alzheimer's disease and its significant ramifications for novel anti-inflammatory treatments.IBRO Neurosci Rep. 2025 May 22;18:771-782. doi: 10.1016/j.ibneur.2025.05.005. eCollection 2025 Jun. IBRO Neurosci Rep. 2025. PMID: 40510290 Free PMC article. Review.
-
Genetic and environmental risk factors for dementia in African adults: A systematic review.Alzheimers Dement. 2025 Apr;21(4):e70220. doi: 10.1002/alz.70220. Alzheimers Dement. 2025. PMID: 40289851 Free PMC article.
-
Targeting Microglia in Alzheimer's Disease: Pathogenesis and Potential Therapeutic Strategies.Biomolecules. 2024 Jul 11;14(7):833. doi: 10.3390/biom14070833. Biomolecules. 2024. PMID: 39062547 Free PMC article. Review.
-
The integration of genome-wide and transcriptome-wide association studies in neurodegenerative diseases: opportunities, challenges, and current methodological innovations.Brief Bioinform. 2025 Jul 2;26(4):bbaf350. doi: 10.1093/bib/bbaf350. Brief Bioinform. 2025. PMID: 40694035 Free PMC article. Review.
-
WIMOAD: Weighted Integration of Multi-Omics Data with Meta Learning for Alzheimer's Disease Diagnosis.bioRxiv [Preprint]. 2025 Apr 9:2024.09.25.614862. doi: 10.1101/2024.09.25.614862. bioRxiv. 2025. PMID: 39386613 Free PMC article. Preprint.
References
-
- 2022 Alzheimer's disease facts and figures. Alzheimers Dement. 2022;18(4):700-89. - PubMed
MeSH terms
Grants and funding
LinkOut - more resources
Full Text Sources
Medical
