Observational Study
. 2024 Aug;30(8):2320-2327.
doi: 10.1038/s41591-024-03087-3. Epub 2024 Jun 2.

Cell-free DNA for the detection of kidney allograft rejection

Affiliations
Observational Study

Cell-free DNA for the detection of kidney allograft rejection

Olivier Aubert et al. Nat Med. 2024 Aug.

Abstract

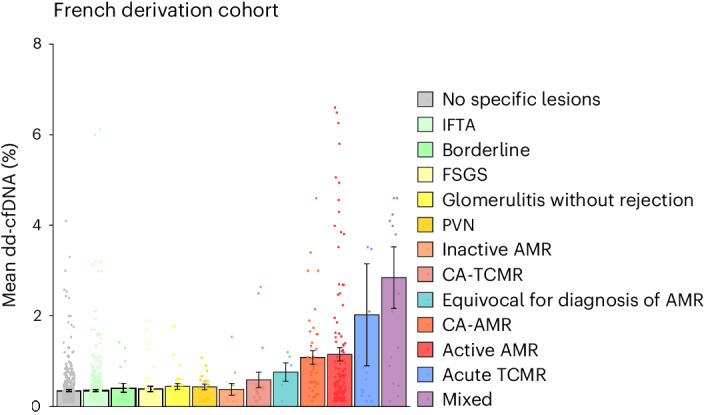
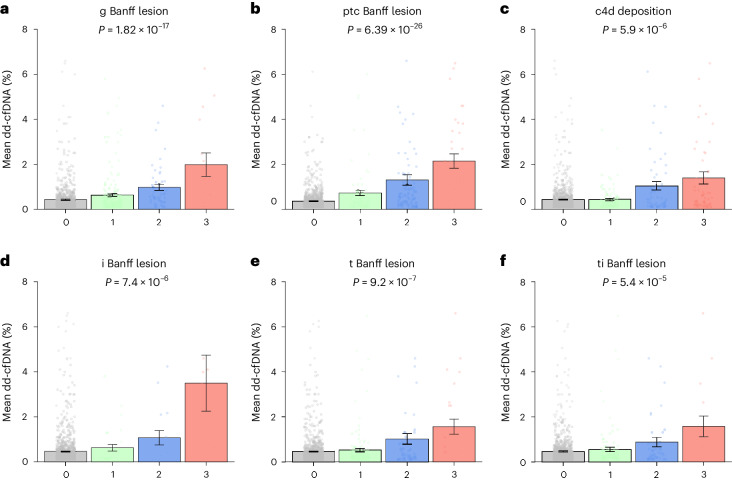
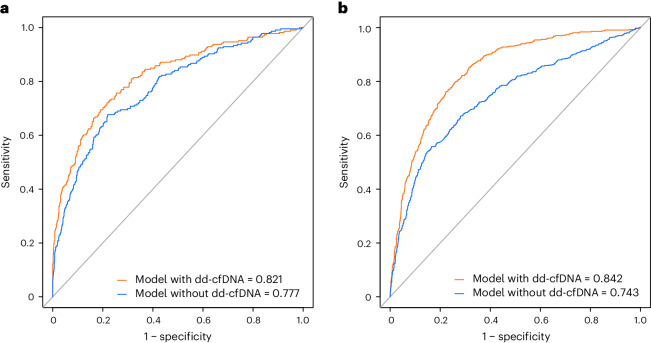
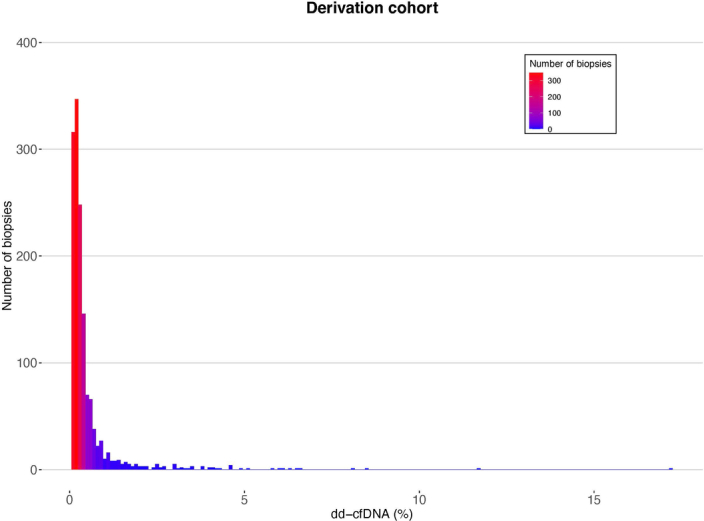
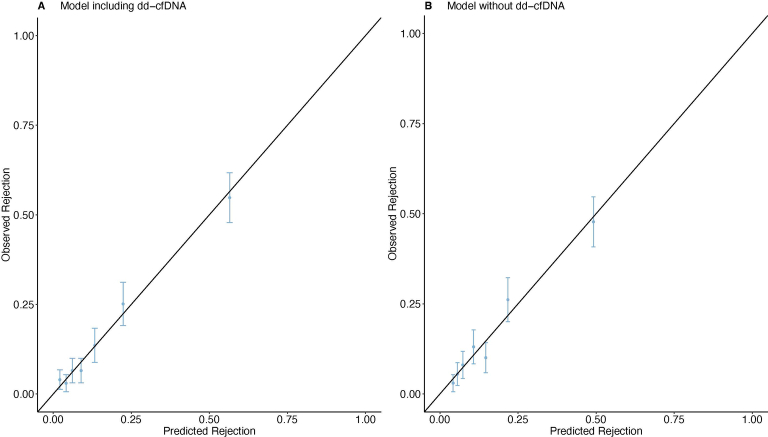
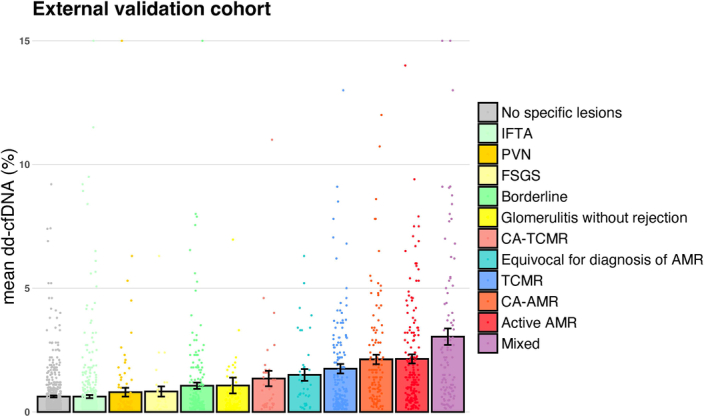
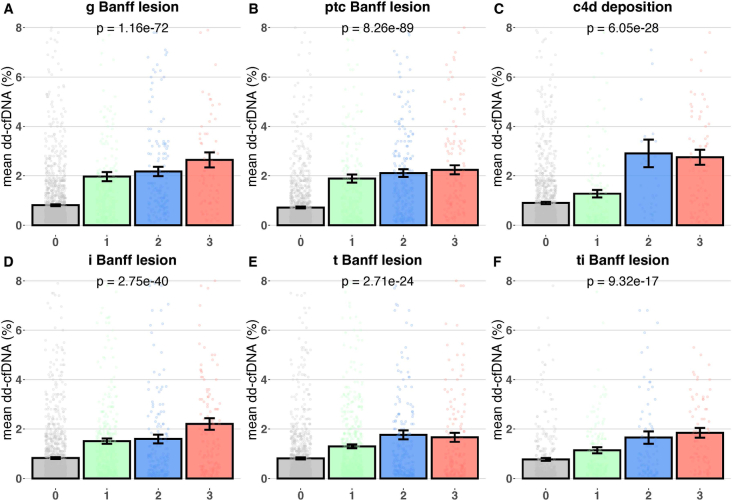
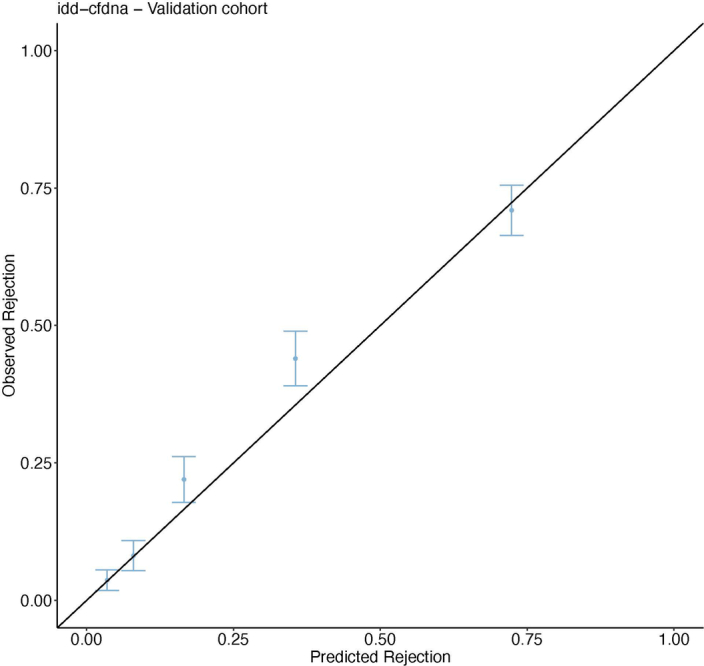
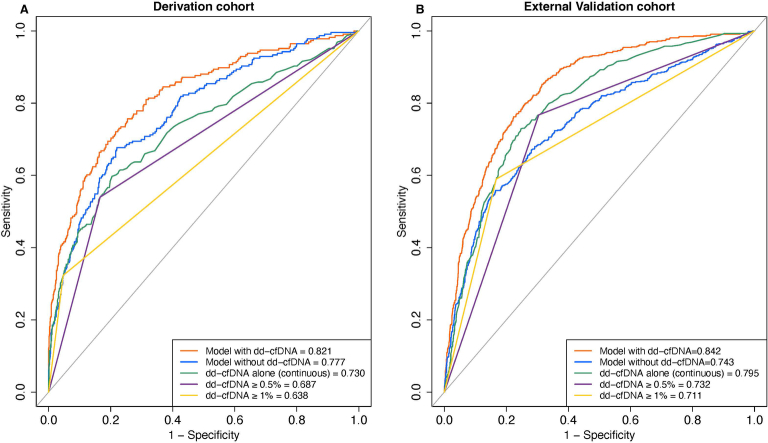
Donor-derived cell-free DNA (dd-cfDNA) is an emerging noninvasive biomarker that has the potential to detect allograft injury. The capacity of dd-cfDNA to detect kidney allograft rejection and its added clinical value beyond standard of care patient monitoring is unclear. We enrolled 2,882 kidney allograft recipients from 14 transplantation centers in Europe and the United States in an observational population-based study. The primary analysis included 1,134 patients. Donor-derived cell-free DNA levels strongly correlated with allograft rejection, including antibody-mediated rejection (P < 0.0001), T cell-mediated rejection (P < 0.0001) and mixed rejection (P < 0.0001). In multivariable analysis, circulating dd-cfDNA was significantly associated with allograft rejection (odds ratio 2.275; 95% confidence interval (CI) 1.902-2.739; P < 0.0001) independently of standard of care patient monitoring parameters. The inclusion of dd-cfDNA to a standard of care prediction model showed improved discrimination (area under the curve 0.777 (95% CI 0.741-0.811) to 0.821 (95% CI 0.784-0.852); P = 0.0011) and calibration. These results were confirmed in the external validation cohorts (n = 1,748) including a cohort of African American patients (n = 439). Finally, dd-cfDNA showed high predictive value to detect subclinical rejection in stable patients. Our study provides insights on the potential value of assessing dd-cfDNA, in addition to standard of care monitoring, to improve the detection of allograft rejection. ClinicalTrials.gov registration: NCT05995379 .


Conflict of interest statement

The authors declare no competing interests.

Figures

Fig. 1
Fig. 1. dd-cfDNA levels according to kidney allograft diagnoses.
Mean level of dd-cfDNA according to the histological biopsy results. Each bar corresponds to one histological diagnosis with its mean dd-cfDNA value. Each dot corresponds to an individual dd-cfDNA value. Data are presented as mean ± s.e.m. The figure shows the increment of dd-cfDNA with active diseases (CA-TCMR, CA-AMR, active AMR, acute TCMR and mixed rejection (AMR + TCMR)). CA-TCMR, chronic active T cell-mediated rejection; CA-AMR, chronic active antibody-mediated rejection; FSGS, focal segmental glomerular sclerosis; PVN, polyomavirus-associated nephropathy. Source data
Fig. 2
Fig. 2. Association of dd-cfDNA with antibody-mediated lesions and TCMR lesions.
af, Mean level of dd-cfDNA according to the Banff scores of AMR (glomerulitis (a), peritubular capillaritis (b) and c4d deposition (c)) and TCMR (interstitial inflammation (d), tubulitis (e) and total inflammation (f)). Each dot corresponds to an individual dd-cfDNA value. Each of these scores ranges from 0 to 3, with higher scores indicating more severe lesions. The lesions were defined according to Banff 2019 classification. Data are presented as mean ± s.e.m. Comparisons between the groups were performed using two-sided Kruskal–Wallis test with adjustments for multiple comparisons. This figure shows the increment of dd-cfDNA with the severity of the lesions. g, glomerulitis; i, interstitial inflammation; ptc, peritubular capillaritis; t, tubulitis; ti, total inflammation. Source data
Fig. 3
Fig. 3. Performances of models with dd-cfDNA and without dd-cfDNA to detect kidney allograft rejection.
a,b, The ROC curve, which describes the capacity of the models in discriminating rejection in the derivation cohort (a) and in the external validation cohort (b). The orange and blue lines represent the ROC curves of the models with and without dd-cfDNA, respectively. The two models also include the standard of care parameters that were independently associated with rejection in the derivation cohort (eGFR, proteinuria, anti-HLA DSA, previous episode of rejection, kidney graft instability). In those two cohorts, including dd-cfDNA beyond standard of care parameters resulted in better discrimination performances, as the AUC increased from 0.777 to 0.821 in the derivation cohort (P = 0.0011) and from 0.743 to 0.842 in the validation cohort (P < 2.2 × 10−16) using the Delong test. Source data
Extended Data Fig. 1
Extended Data Fig. 1. Distribution of the dd-cfDNA in the derivation cohort.
This figure shows the distribution of dd-cfDNA in the derivation cohort.
Extended Data Fig. 2
Extended Data Fig. 2. Calibration curves of the final multivariable model including dd-cfDNA versus excluding dd-cfDNA.
This figure show calibration curves of the multivariable model including dd-cfDNA (panel A) and without dd-cfDNA (panel B) in derivation cohort. The x-axis represents the predicted probability of rejection and the y-axis represents the observed fraction of rejection. The bars indicates the 95% Confidence Intervals. There is a better agreement between the predictions and the observed rejection events with the model including dd-cfDNA than in the model excluding dd-cfDNA.
Extended Data Fig. 3
Extended Data Fig. 3. Association of dd-cfDNA according to the histologic phenotype in the validation cohort.
This figure shows the mean level of dd-cfDNA according to the histological biopsy results in the validation cohort. Each bar corresponds to one histological diagnosis with its mean dd-cfDNA value. Each dot corresponds to an individual dd-cfDNA value. This figure shows the increment of dd-cfDNA with active diseases (Chronic-active-T-cell mediated rejection, Chronic-Active antibody-mediated rejection, Active antibody mediated rejection, Acute T-cell mediated rejection and mixed rejection (AMR + TCMR)). Data are presented as mean values +/- SEM.
Extended Data Fig. 4
Extended Data Fig. 4. Association of dd-cfDNA with Banff scores in the validation cohort.
This figure shows the mean levels of dd-cfDNA according to the ABMR features (g Banff score [glomerulitis], ptc Banff score [peritubular capillaritis], c4d graft deposition) and the TCMR features (i Banff score [interstitial inflammation], t Banff score [tubulitis], and ti Banff score [total inflammation]). Each of these scores ranges from 0 to 3, with higher scores indicating more severe lesions. The T bars indicates standard errors. Each dot corresponds to an individual dd-cfDNA value. Data are presented as mean values +/- SEM. Comparisons between the groups was performed using two-sided Kruskal-Wallis test with adjustments for multiple comparisons. This figure shows the increment of dd-cfDNA with the severity of the lesions.
Extended Data Fig. 5
Extended Data Fig. 5. Calibration curve of the integrative dd-cfDNA score in the validation cohort.
This figure shows the calibration curves of the integrative dd-cfDNA score in the validation cohort. The x-axis represents the predicted probability of rejection and the y-axis represents the observed fraction of rejection. The bars indicates the 95% Confidence Intervals.
Extended Data Fig. 6
Extended Data Fig. 6. ROC curves of the different models and of dd-cfDNA as a continuous biomarker or with specific thresholds (0.5 or 1%) in the derivation and validation cohorts.
Panel A shows the receiver-operating (ROC) curve of different models (model including or without dd-cfDNA), and of dd-cfDNA alone, with or without thresholds. Panel B depicts the ROC curves in the validation cohorts.

Similar articles

Cited by

References

    1. Sellarés, J. et al. Understanding the causes of kidney transplant failure: the dominant role of antibody-mediated rejection and nonadherence: attributing causes of kidney transplant loss. Am. J. Transplant.12, 388–399 (2012). 10.1111/j.1600-6143.2011.03840.x - DOI - PubMed
    1. Kaplan, B. & Meier-Kriesche, H. U. Death after graft loss: an important late study endpoint in kidney transplantation. Am. J. Transplant.2, 970–974 (2002). 10.1034/j.1600-6143.2002.21015.x - DOI - PubMed
    1. Muduma, G., Odeyemi, I., Smith-Palmer, J. & Pollock, R. F. Review of the clinical and economic burden of antibody-mediated rejection in renal transplant recipients. Adv. Ther.33, 345–356 (2016). 10.1007/s12325-016-0292-y - DOI - PubMed
    1. Bloom, R. D. & Augustine, J. J. Beyond the biopsy: monitoring immune status in kidney recipients. CJASN16, 1413–1422 (2021). 10.2215/CJN.14840920 - DOI - PMC - PubMed
    1. Naesens, M. & Anglicheau, D. Precision transplant medicine: biomarkers to the rescue. J. Am. Soc. Nephrol.29, 24–34 (2018). 10.1681/ASN.2017010004 - DOI - PMC - PubMed

Publication types

Associated data