. 2024 Aug:239:102635.
doi: 10.1016/j.pneurobio.2024.102635. Epub 2024 May 31.

Calcium plays an essential role in early-stage dendrite injury detection and regeneration

Affiliations

Calcium plays an essential role in early-stage dendrite injury detection and regeneration

Vinicius N Duarte et al. Prog Neurobiol. 2024 Aug.

Abstract

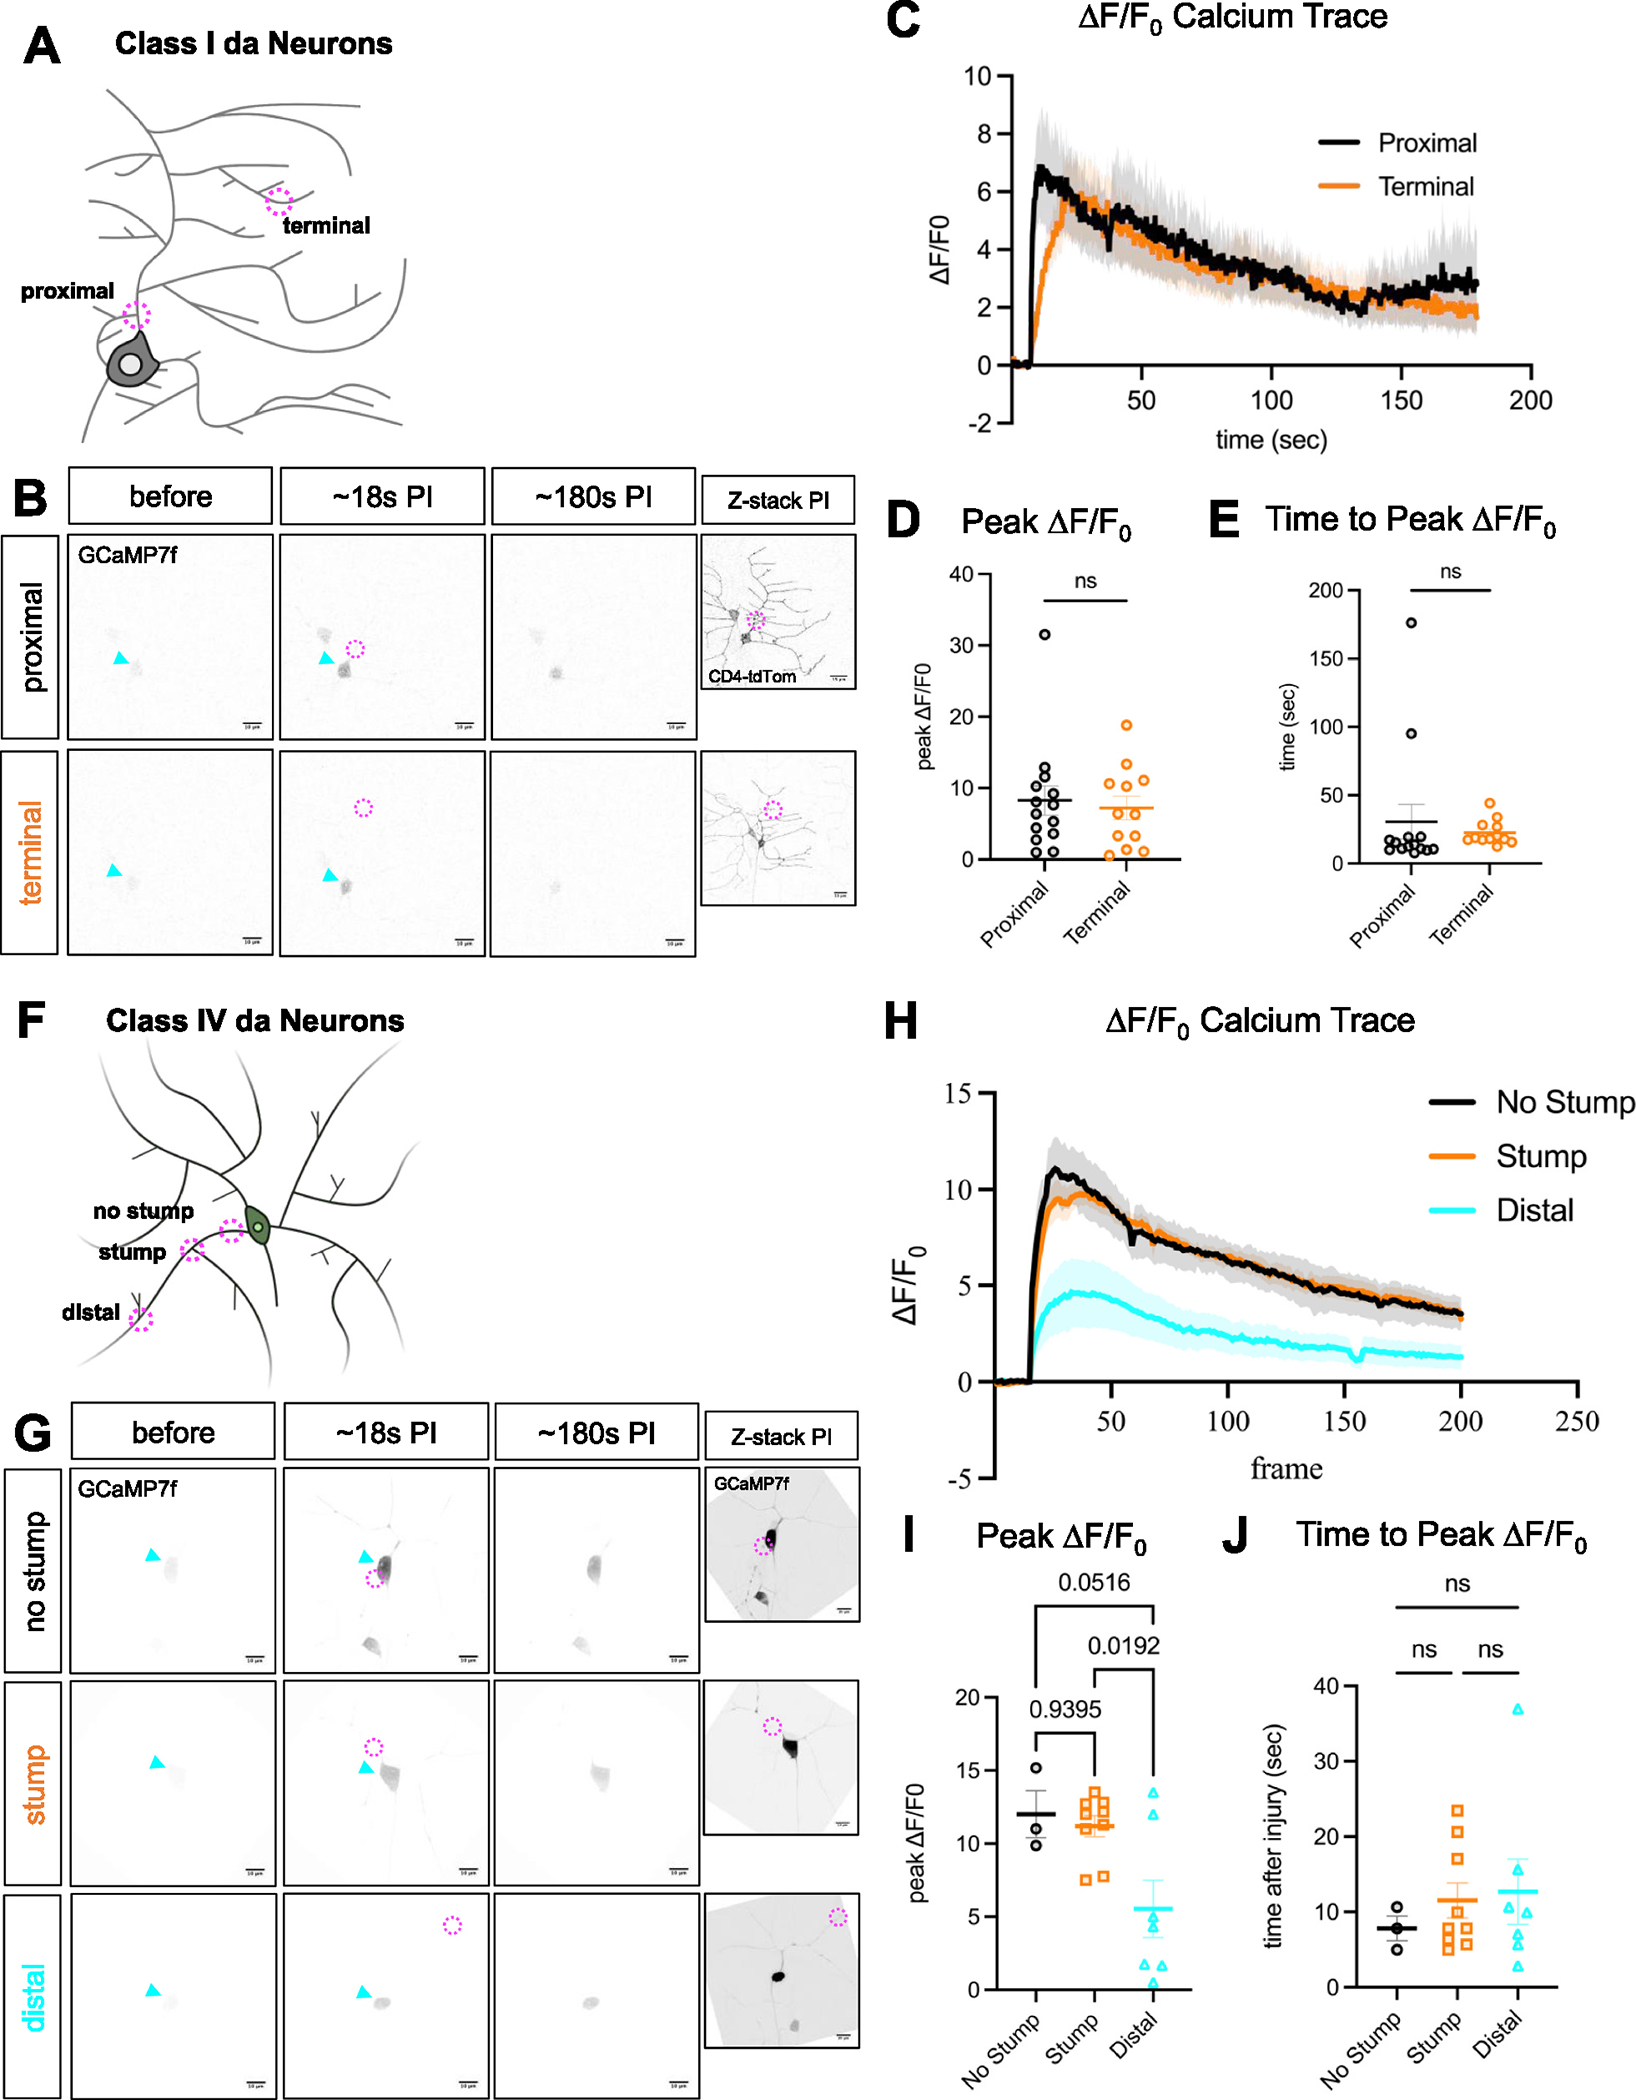
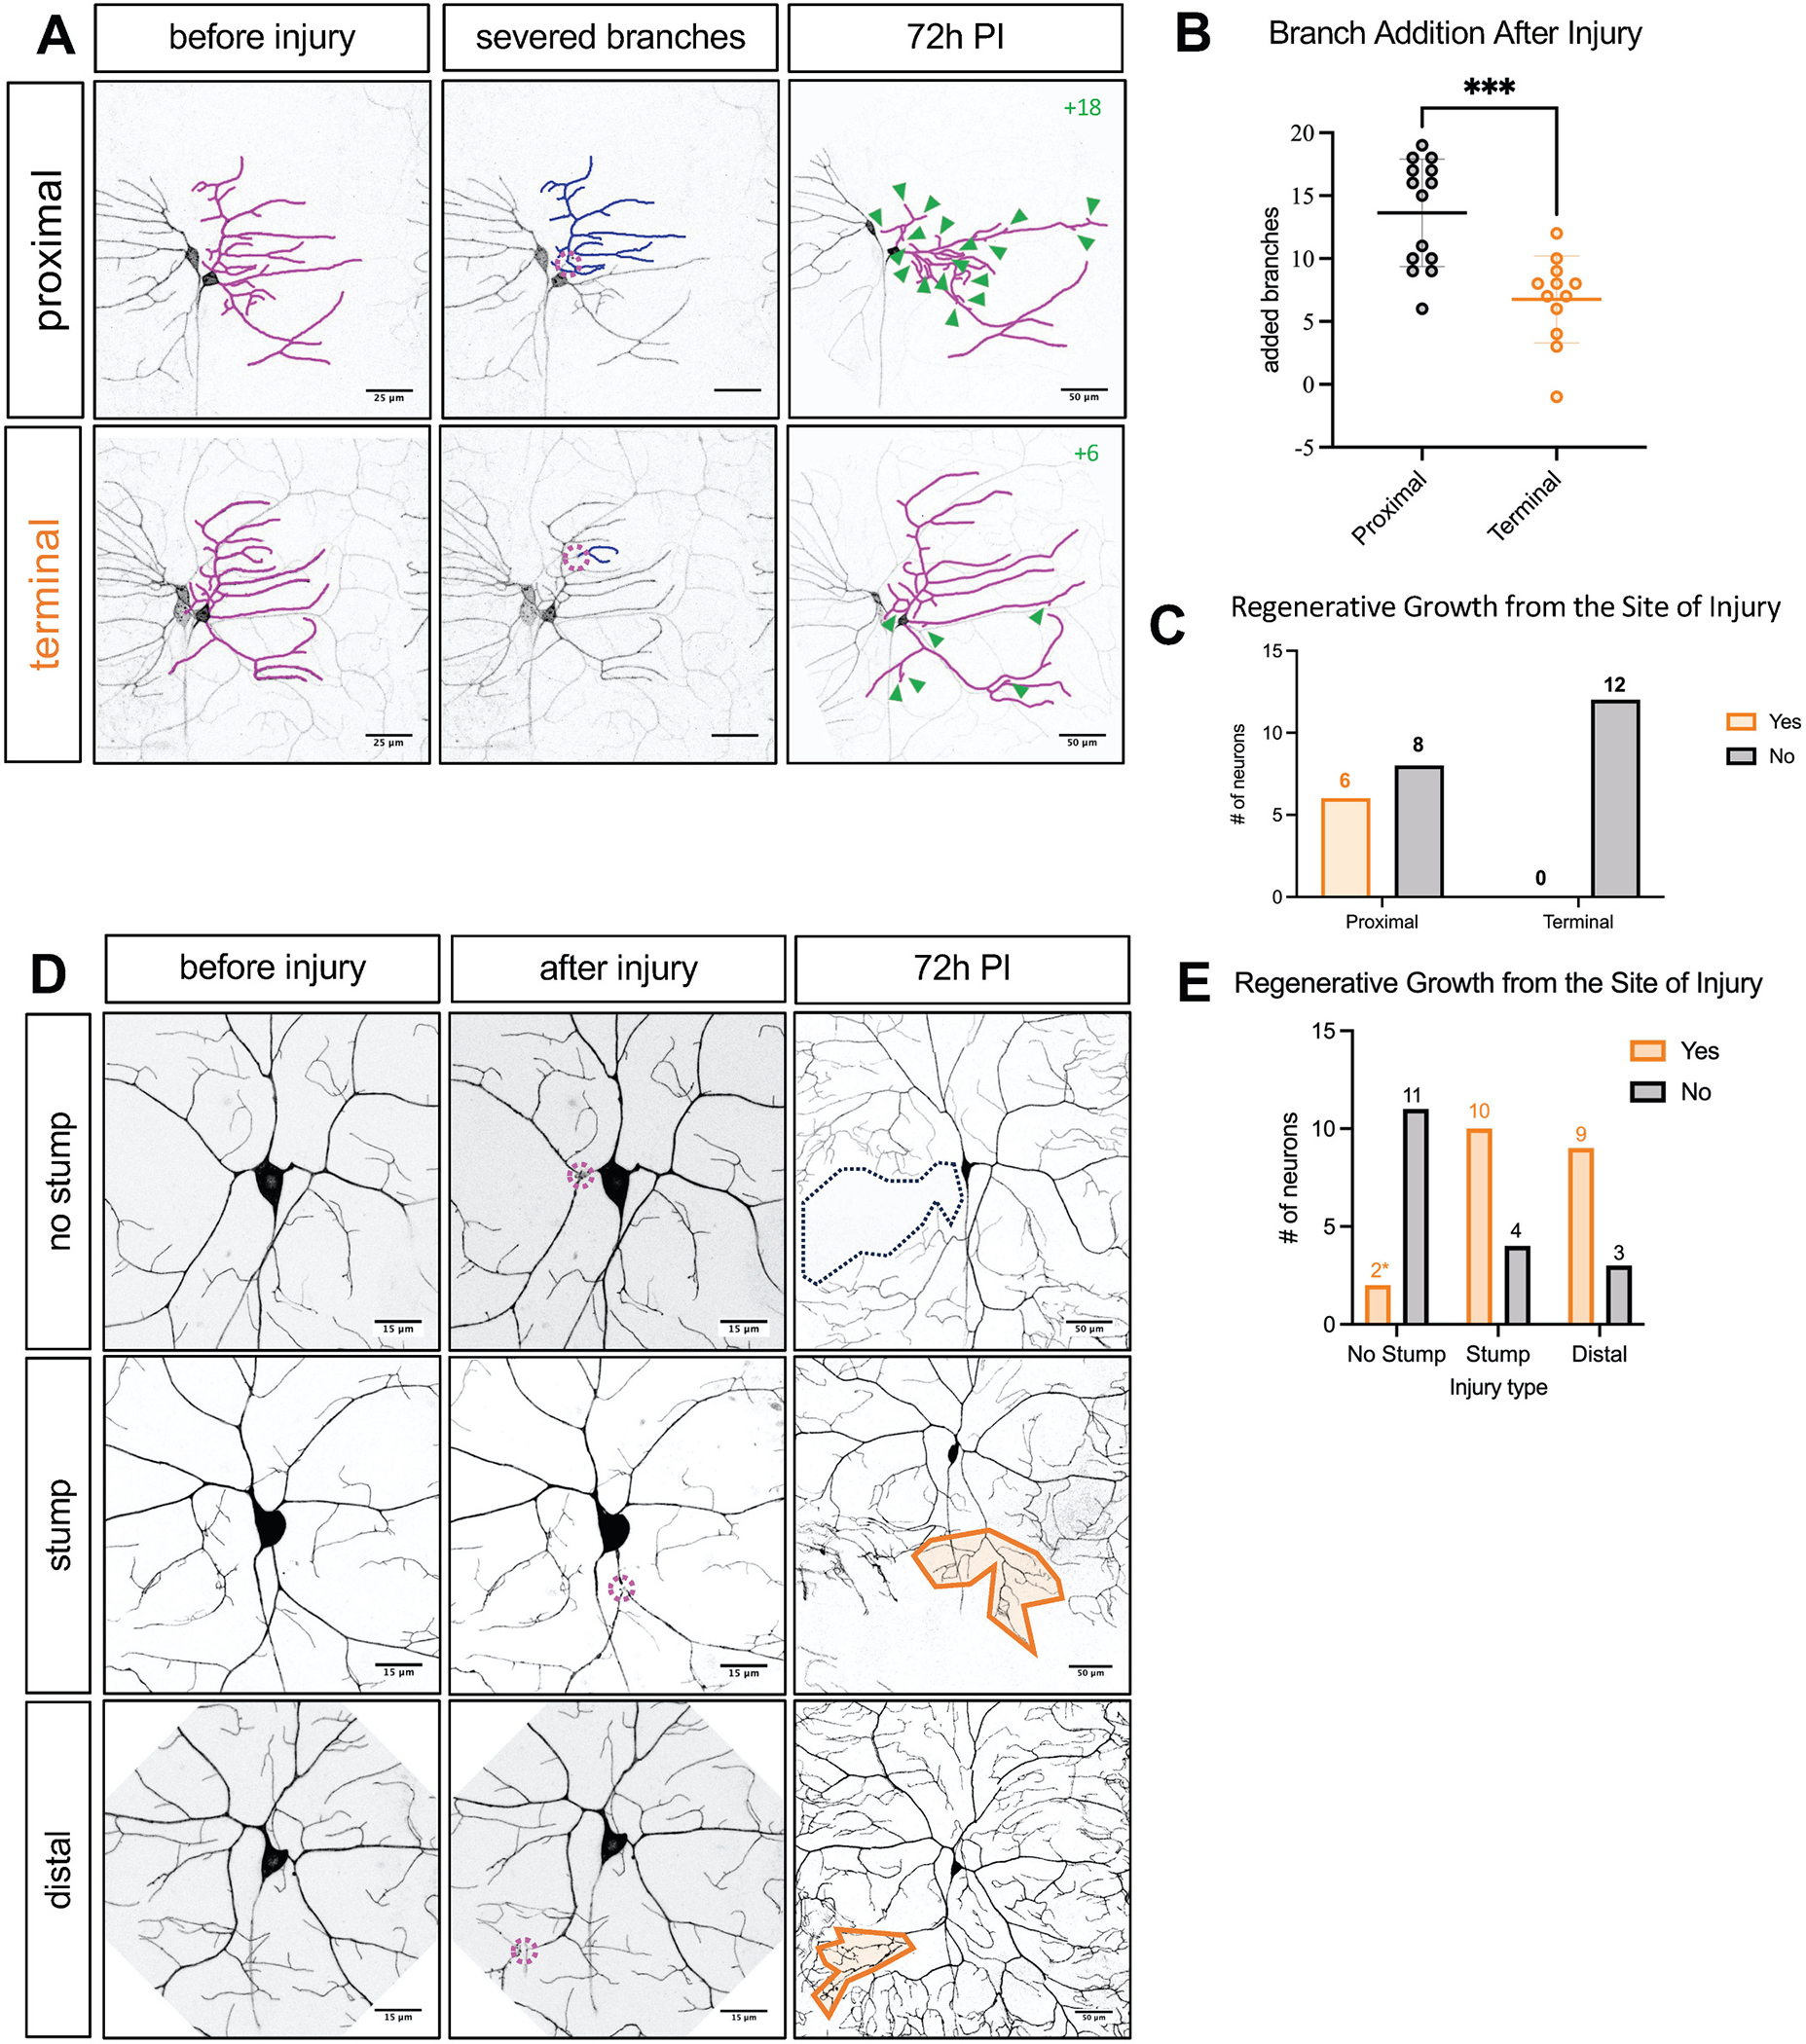
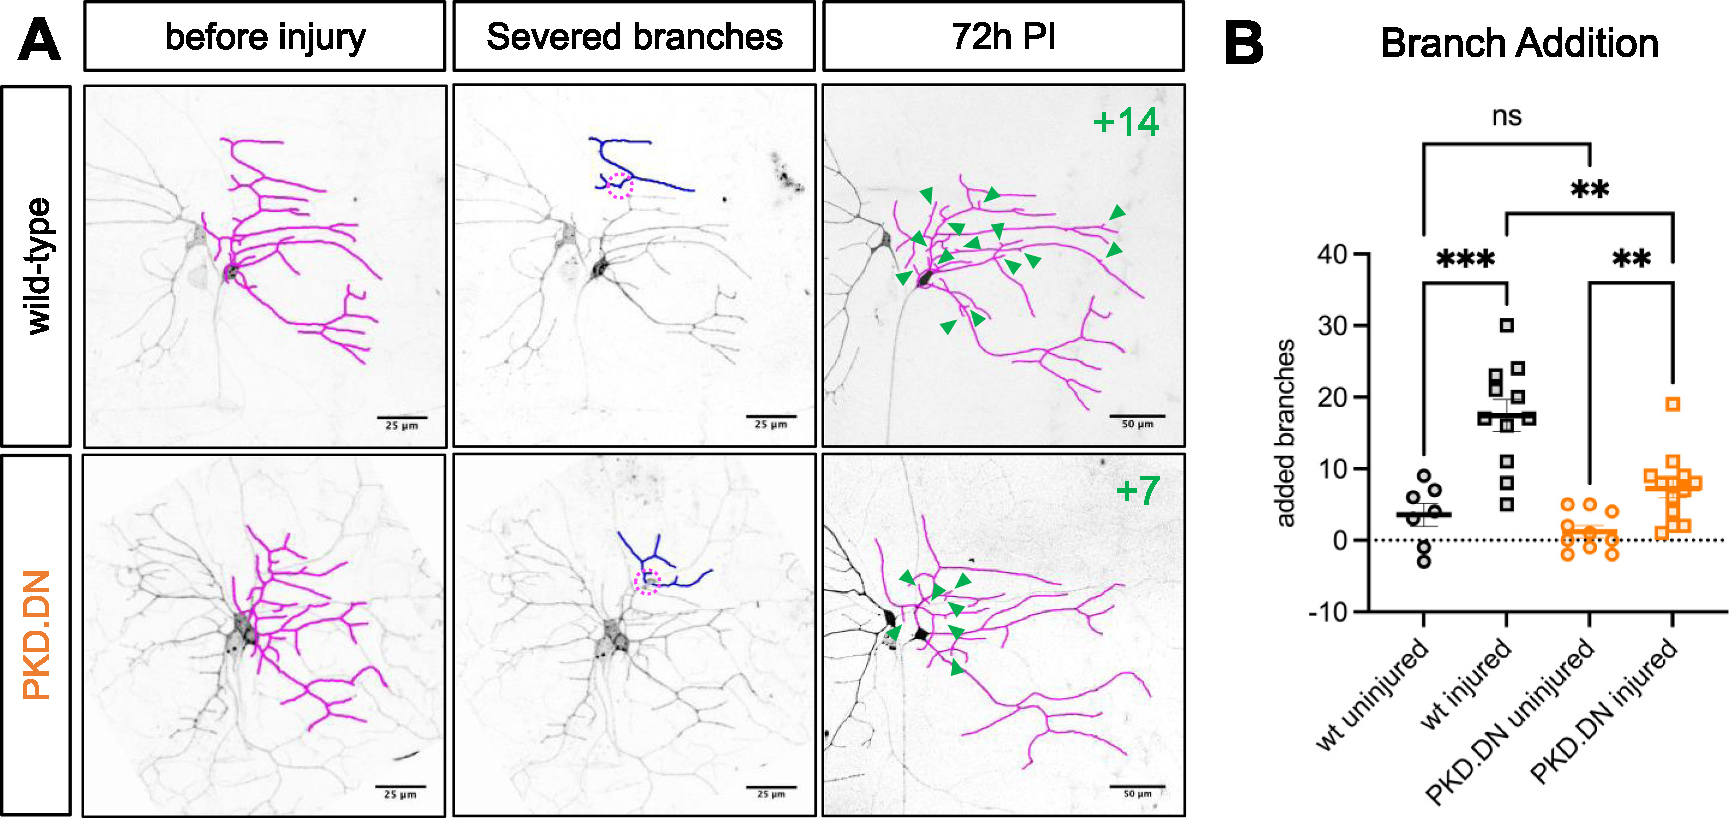
Dendrites are injured in a variety of clinical conditions such as traumatic brain and spinal cord injuries and stroke. How neurons detect injury directly to their dendrites to initiate a pro-regenerative response has not yet been thoroughly investigated. Calcium plays a critical role in the early stages of axonal injury detection and is also indispensable for regeneration of the severed axon. Here, we report cell and neurite type-specific differences in laser injury-induced elevations of intracellular calcium levels. Using a human KCNJ2 transgene, we demonstrate that hyperpolarizing neurons only at the time of injury dampens dendrite regeneration, suggesting that inhibition of injury-induced membrane depolarization (and thus early calcium influx) plays a role in detecting and responding to dendrite injury. In exploring potential downstream calcium-regulated effectors, we identify L-type voltage-gated calcium channels, inositol triphosphate signaling, and protein kinase D activity as drivers of dendrite regeneration. In conclusion, we demonstrate that dendrite injury-induced calcium elevations play a key role in the regenerative response of dendrites and begin to delineate the molecular mechanisms governing dendrite repair.

Keywords: Calcium; Dendrite injury; Dendrite regeneration; Dendrite repair; Drosophila; Injury detection.


Conflict of interest statement

Declaration of Competing Interest The authors declare that they have no known competing financial interests or personal relationships that could have appeared to influence the work reported in this paper.

Figures

Fig. 1.
Fig. 1.. Dendrite injury triggers rapid somatic calcium influx.
(A) Timeline of experimental assays used throughout the study. (B) BioRender-generated graphics of neuron types used in this study. Throughout the figures, magenta dashed circles indicate the site of injury and cyan arrowheads indicate cell bodies. (C, G) Representative images of class I ddaE or class IV ddaC neurons before, 18 s after, and 180 s after injury. Scale bar, 15μm. (D,H) ΔF/F0 Calcium traces after axotomy (black) or dendrotomy (orange) of class I ddaE or class IV ddaC neurons. (E, F, I, J) Quantifications of peak ΔF/F0 and time (sec) to peak ΔF/F0. Values are plotted as mean ± SEM. **p < 0.01. *p < 0.05 by unpaired (I) or Welch’s (E, F, J) t-test.
Fig. 2.
Fig. 2.. Injury-induced calcium influx is sensitive to distance in class IV but not class I neurons.
(A, F) Graphics depicting different sites of injury to class I ddaE and class IV ddaC dendrite arbors. (B) Representative images of the GCaMP7f signal in class I ddaE neurons before injury, ~18 sec PI, and ~180 s PI. Maximum intensity projections with a membrane-bound tdTomato label are also provided to visualize the injury site more clearly. Scale Bar = 10μm. (C) Somatic ΔF/F0 plot after proximal and terminal injuries. (D, E) Peak and time to peak somatic ΔF/F0 plots. (G) Representative images of the GCaMP7f signal in class IV ddaC neurons before injury, ~18 s PI, and ~180 s PI. Maximum intensity projections with digitally enhanced GCaMP7f signal provided to visualize the injury site more clearly. (H) Somatic ΔF/F0 plot after no stump, stump, and distal injuries. (I, J) Peak and time to peak somatic ΔF/F0 plots.
Fig. 3.
Fig. 3.. Dendrite injury at different sites triggers varying levels of dendrite repair.
(A) Representative images of class I ddaE neurons before proximal or terminal branch injury, after injury with indication of severed branches (blue overlay), and 72 h PI with indications of regenerated branches (green arrowheads and total branches added in upper right). (B) Quantified branch addition after injury to either proximal or terminal dendrite branches. (C) Number of neurons displaying regenerative growth from the site of injury after injury to either proximal or terminal dendrite branches. (D) Representative images of class IV ddaC neurons before injury, after injury, or 72 h PI with indications for areas of regrowth or lack thereof. (E) Number of neurons displaying regenerative growth from the site of injury after no stump, stump, and distal injuries.
Fig. 4.
Fig. 4.. KCNJ2-mediated electrical silencing shunts injury-induced calcium influx.
(A) Representative GCaMP7f images of wild-type or KCNJ2.HA-expressing class I ddaE neurons before injury, ~12 s PI, and ~180 s PI. Maximum intensity projections with digitally enhanced GCaMP7f signal provided to visualize the injury site more clearly. Scale bars = 10 μm. (B) Somatic ΔF/F0 calcium trace of wild-type (black) or KCNJ2.HA-expressing neurons (orange). (C) Quantification of peak somatic ΔF/F0. Values are plotted as mean ± SEM. **p < 0.01 by Welch’s t-test. (D) Representative images of class I ddaE neurons expressing CD4-tdTomato before injury (magenta = traced dendrite arbor, scale bar = 20μm), after injury (blue = severed branches, scale bar = 20μm), and 72 h PI (green arrowheads denote regenerated branches, scale bar = 50μm). (E) Quantified branch addition in uninjured and injured neurons of both genotypes compared using ordinary one-way ANOVA with Sidak multiple comparisons testing. (F) Representative GCaMP7f images of wild-type or KCNJ2.HA-expressing class IV ddaC neurons before injury, ~12 s PI, and ~180 s PI. Maximum intensity projections with digitally enhanced GCaMP7f signal provided to visualize the injury site more clearly (scale bars = 10 μm). (G) Somatic ΔF/F0 calcium trace. (H) Quantification of peak somatic ΔF/F0. Values are plotted as mean ± SEM. *p < 0.05 by Welch’s t-test.
Fig. 5.
Fig. 5.. KCNJ2 expression only at the time of injury is sufficient to block dendrite regeneration.
(A) Timeline of the regeneration assay with Gal80ts. KCNJ2. GFP expression was restricted during development, induced 12 hours prior to injury, and restricted again immediately after injury. (B) Representative images of wild-type or KCNJ.GFP-expressing class IV ddaC neurons at 24 h PI (scale bars = 25 μm), 96 h PI (scale bars = 50μm), or uninjured controls at 192 h AEL (identical timepoint as 96 h PI; scale bars = 50μm). (C) Quantification of area coverage represented by magenta selection areas in (B). Values are plotted as mean ± SD. ****p < 0.0001, ***p < 0.001, **p < 0.01 by ordinary one-way ANOVA with Sidak multiple comparisons test.
Fig. 6.
Fig. 6.. Knockdown of L-type VGCCs and inhibition of IP3 signaling impairs dendrite regeneration
(A) Representative images of wild-type or Ca-a1D.RNAi-expressing class I ddaE neurons before injury (magenta = traced arbors; scale bar = 25μm), after injury (blue = trace of severed branches; scale bar = 25μm), or 72 h PI (magenta = traced arbors, green arrowheads = regenerated branches; scale bar = 50 μm). (B) Quantification of added branches in uninjured and injured neurons. (C) Representative images of wild-type or IP3-sponge expressing class I ddaE neurons as in (A). (D) Quantification of added branches as in (B). Values are plotted as mean ± SEM. ***p < 0.001, **p < 0.01, *p < 0.05 by ordinary one-way ANOVA with Sidak multiple comparisons test.
Fig. 7.
Fig. 7.. Protein kinase D activity regulates dendrite regeneration.
(A) Representative images of wild-type or PKD.DN-expressing class I ddaE neurons before injury (magenta = traced dendrite arbor, scale bars = 25μm), after injury (blue = severed dendrite branches, scale bars = 25μm), or 72 h PI (green arrowheads = regenerated branches, scale bars = 50μm). (B) Quantification of added branches at 72 h PI for uninjured and injured neurons. Values are plotted as mean ± SEM. ***p < 0.001, **p < 0.01 by ordinary one-way ANOVA with Sidak multiple comparisons test.

Similar articles

Cited by

References

    1. Baines RA, Uhler JP, Thompson A, Sweeney ST, Bate M, 2001. Altered electrical properties in DrosophilaNeurons developing without synaptic transmission. J. Neurosci. 21, 1523–1531. - PMC - PubMed
    1. Beckers A, Moons L, 2019. Dendritic shrinkage after injury: a cellular killer or a necessity for axonal regeneration? Neural Regen. Res. 14 (8), 1313–1316. - PMC - PubMed
    1. Berdan RC, Easaw JC, Wang R, 1993. Alterations in membrane potential after axotomy at different distances from the soma of an identified neuron and the effect of depolarization on neurite outgrowth and calcium channel expression. J. Neurophysiol. 69, 151–164. - PubMed
    1. Bisbal M, et al., 2008. Protein kinase D regulates trafficking of dendritic membrane proteins in developing neurons. J. Neurosci. 28, 9297–9308. - PMC - PubMed
    1. Brown CE, Li P, Boyd JD, Delaney KR, Murphy TH, 2007. Extensive turnover of dendritic spines and vascular remodeling in cortical tissues recovering from stroke. J. Neurosci. 27, 4101–4109. - PMC - PubMed

Substances