

Predicting prostate adenocarcinoma patients' survival and immune signature: a novel risk model based on telomere-related genes
- PMID: 38825615
- PMCID: PMC11144689
- DOI: 10.1007/s12672-024-00986-2
Predicting prostate adenocarcinoma patients' survival and immune signature: a novel risk model based on telomere-related genes
Abstract
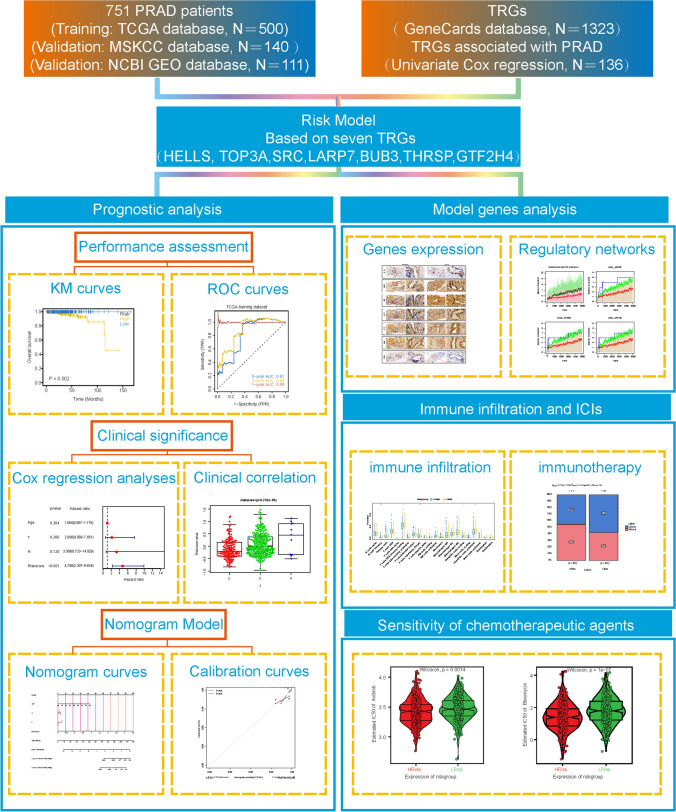
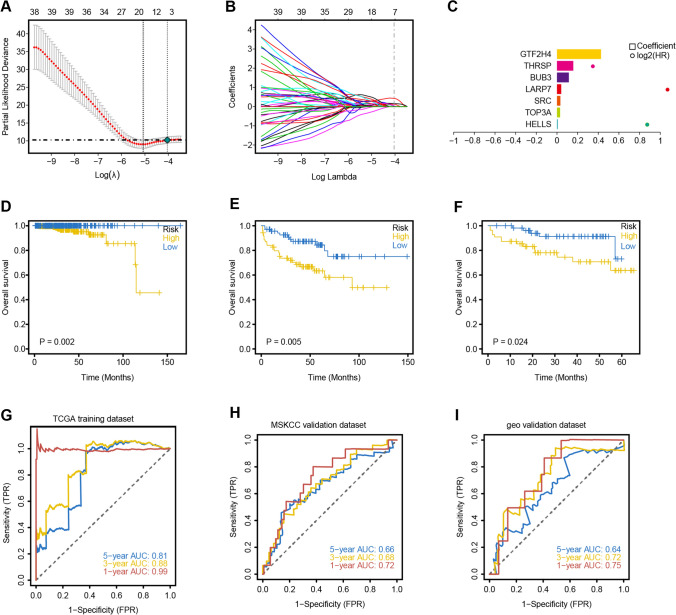
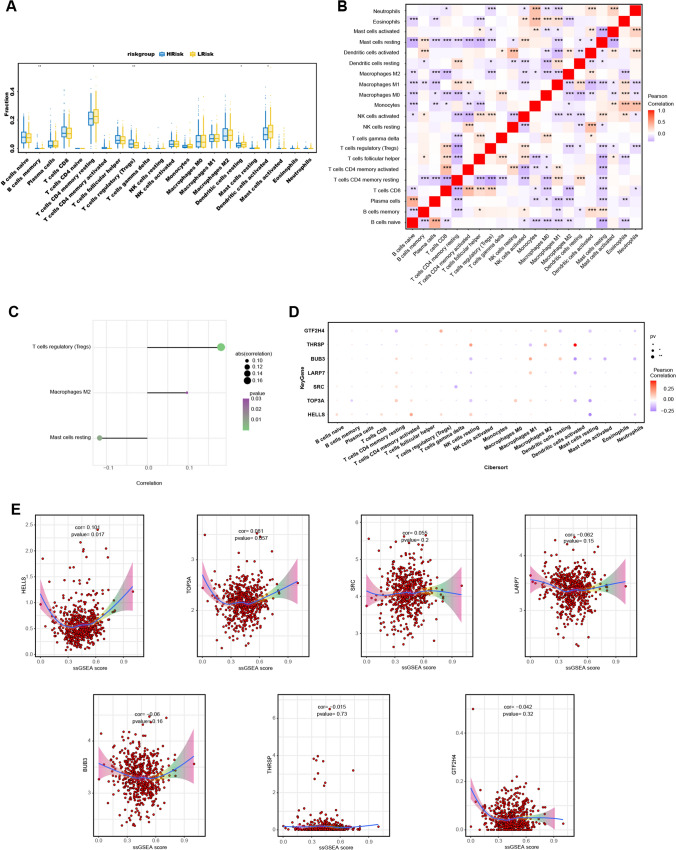
Alterations in telomeres constitute some of the earliest occurrences in the tumourigenesis of prostate adenocarcinoma (PRAD) and persist throughout the progression of the tumour. While the activity of telomerase and the length of telomeres have been demonstrated to correlate with the prognosis of PRAD, the prognostic potential of telomere-related genes (TRGs) in this disease remains unexplored. Utilising mRNA expression data from the Cancer Genome Atlas (TCGA), we devised a risk model and a nomogram to predict the survival outcomes of patients with PRAD. Subsequently, our investigations extended to the relationship between the risk model and immune cell infiltration, sensitivity to chemotherapeutic drugs, and specific signalling pathways. The risk model we developed is predicated on seven key TRGs, and immunohistochemistry results revealed significant differential expression of three TRGs in tumours and paracancerous tissues. Based on the risk scores, PRAD patients were stratified into high-risk and low-risk cohorts. The Receiver operating characteristics (ROC) and Kaplan-Meier survival analyses corroborated the exceptional predictive performance of our novel risk model. Multivariate Cox regression analysis indicated that the risk score was an independent risk factor associated with Overall Survival (OS) and was significantly associated with T and N stages of PRAD patients. Notably, the high-risk group exhibited a greater response to chemotherapy and immunosuppression compared to the low-risk group, offering potential guidance for treatment strategies for high-risk patients. In conclusion, our new risk model, based on TRGs, serves as a reliable prognostic indicator for PRAD. The model holds significant value in guiding the selection of immunotherapy and chemotherapy in the clinical management of PRAD patients.
Keywords: Immune checkpoint inhibitors; Immune microenvironment; Prostate adenocarcinoma; Risk model; Telomere.
© 2024. The Author(s).
Conflict of interest statement
The authors have no relevant financial or non-financial interests to disclose.
Figures


Similar articles
-
The novel transcriptomic signature of angiogenesis predicts clinical outcome, tumor microenvironment and treatment response for prostate adenocarcinoma.Mol Med. 2022 Jul 14;28(1):78. doi: 10.1186/s10020-022-00504-6. Mol Med. 2022. PMID: 35836112 Free PMC article.
-
A novel telomere-associated genes signature for the prediction of prognosis and treatment responsiveness of hepatocellular carcinoma.Biol Proced Online. 2025 Feb 27;27(1):8. doi: 10.1186/s12575-025-00271-8. Biol Proced Online. 2025. PMID: 40016654 Free PMC article.
-
Prognostic significance of B cell senescence-associated genes as risk markers in prostate adenocarcinoma.Transl Cancer Res. 2024 Nov 30;13(11):5771-5783. doi: 10.21037/tcr-24-724. Epub 2024 Nov 27. Transl Cancer Res. 2024. PMID: 39697756 Free PMC article.
-
A N7-Methylguanine-Related Gene Signature Applicable for the Prognosis and Microenvironment of Prostate Cancer.J Oncol. 2022 May 13;2022:8604216. doi: 10.1155/2022/8604216. eCollection 2022. J Oncol. 2022. PMID: 35602299 Free PMC article.
-
Impact of ITH on PRAD patients and feasibility analysis of the positive correlation gene MYLK2 applied to PRAD treatment.Front Genet. 2025 May 20;16:1589259. doi: 10.3389/fgene.2025.1589259. eCollection 2025. Front Genet. 2025. PMID: 40463716 Free PMC article.
Cited by
-
Comprehensive analysis of telomere and aging-related signature for predicting prognosis and immunotherapy response in lung adenocarcinoma.J Cardiothorac Surg. 2025 Jan 6;20(1):31. doi: 10.1186/s13019-024-03337-y. J Cardiothorac Surg. 2025. PMID: 39757226 Free PMC article.
-
Identification of a telomere-related gene signature for the prognostic and immune landscape prediction in head and neck squamous cell carcinoma by integrated analysis of machine learning and Mendelian randomization.Medicine (Baltimore). 2025 Apr 18;104(16):e42211. doi: 10.1097/MD.0000000000042211. Medicine (Baltimore). 2025. PMID: 40258723 Free PMC article.
References
Grants and funding
LinkOut - more resources
Full Text Sources